Introduction
In reflecting on heritage interpretation, Tilden (1957) described six principles about leading people to appreciate the importance of a place, among which three stand out, being able to provoke, relate and reveal. Providing information is not the same as providing interpretation, as interpretation involves information, emotional connection and action (Tilden 1957).
Geodiversity is not only geological diversity, but includes geological components of space, as well as geographical and anthropogenic factors, and through interpretation brings people closer to knowledge of the site and thus helps society adapt to change and mitigate damage to nature, and come to a better understanding of natural processes (Gordon et al. 2011). The use of geodiversity as a tool for environmental studies is growing in importance (dos Santos et al. 2019), highlighting the importance of the physical environment in nature.
Geointerpretation is all that is done to communicate, manage, and understand heritage, which aims to facilitate people's understanding of natural resources. Interpretation is defined by Hose (2012) as determining and then communicating the meaning of a phenomenon, event, geological or geomorphological place.
Geointerpretation is also an element of geotourism, which includes geological aspects as the main tourist attractions and emerges as a new opportunity for tourism to natural areas (Moreira 2014), providing the transfer and communication of knowledge to the public, using interpretative means. Breg Valjavec et al. (2022) state that it is the role of geointerpretation to support new concepts of geotourism using the "power of education and knowledge", as well as protecting geological heritage, and contributing to the growth of local economies and improving geoscientific knowledge.
In recent years, several projects using new geotechnologies have been developed in the field of geological heritage (Brilha et al. 1999; Cayla 2014; Leonov 2010; Martin 2014), enabling the digital viewing of information in interactive three-dimensional forms. Geoscientific information and geoconservation themes can be represented using visual media, with maps linked to other media (MacEachren 1995). In addition to maps, 3D illustration schemes, and animations can be developed to enable users to interact with the information (Martin 2014). Virtual visualization, or geovisualization, is useful at different stages of geological heritage management: scientific research, evaluation, conservation and monitoring, visitor flow management, and providing cognitive support resources through visual presentation (Reynard and Brilha 2018).
Here, we provide an example of how digital technologies can be used for geointerpretation through virtual visualization through an interactive poster, a map of geomorphological records, multimedia information, and 3D modeling supported by scientific articles. Our example is the sandy barrier system of Rio de Janeiro, relatively well preserved compared to other coastal areas.
Study Area
The study area is the coastal plain of Maricá (Fig. 1), located in the city of Maricá, in the state of Rio de Janeiro (Brazil), in an extensive lagunar system, with a 42 km maritime waterfront with the Atlantic Ocean. It includes also the APA Maricá coastal plain, located in the central portion of the Maricá coastal plain, approximately 7 km long, which is relatively well preserved and houses sandbank and coastal plains covered by Atlantic Forest vegetation (dos Santos et al 2017).
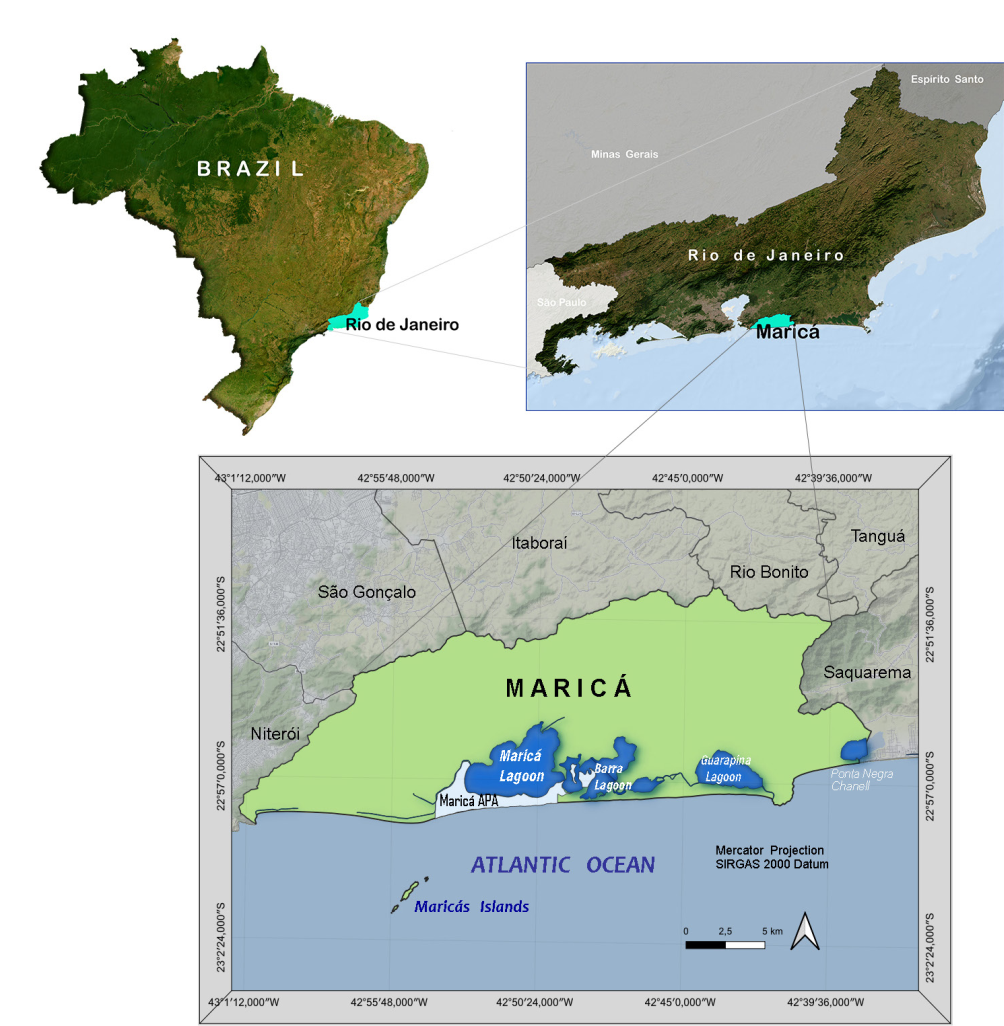
Figure 1. Location map of the study area, city of Maricá, in the state of Rio de Janeiro (Brazil).
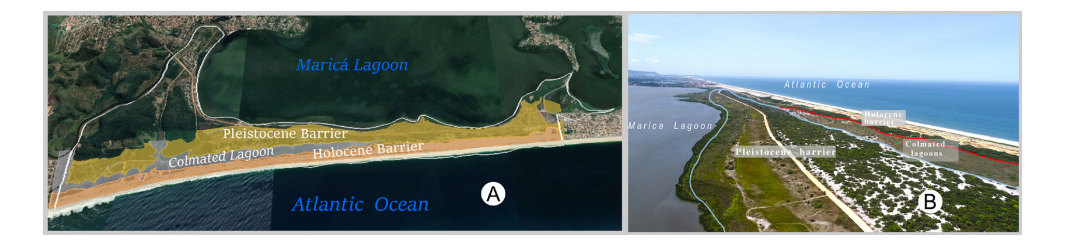
Figure 2. Geomorphology of the Maricá coastal plain: (a) Maricá Lagoon to the north, the Holocene and Pleistocene barriers separated by lagoons (Google Earth Image); and (b) the double barriers system (Pleistocene and Holocene barriers) separated by lagoons (photo by Monteiro, Alex, 2021).
Geomorphologically, there are two Quaternary sandy barriers, which limit a small plain containing a series of isolated swamps and dried ponds (colmated lagoons) in the southern portion (Silva et al. 2014), the Pleistocene internal barrier (Ireland 1987) and the Holocene external (Martin et al. 1984), as shown in Fig. 2.
The geological evolution of the Maricá coastal plain through the Quaternary was strongly controlled by changes in relative sea level, which controlled the migration of barriers, causing their progradation and retrogradation. Silva et al. (2014) described the heights of the Holocene barrier in the APA Maricá region, ranging from 5.4 to 9 m above mean sea level, reaching up to 12 m in the dunes, key information for the protection of this coast from current sea level variations. The dunes, located on the Holocene barrier, are of primary importance for protection of this area, facing the erosive action of stormy waves, which act quite intensely on the beach and redistribute sediments along the coast of Maricá (Silva et al. 2014).
The varied geomorphology along the Maricá sandbank generates various microenvironments that lead to a complex ecosystem involving different vegetation profiles (Oliveira and Silva 1989). These plant communities have a distribution pattern perpendicular to the coastline, strongly influenced by the topographic variability of the geomorphological environments (beach, barriers, dunes, lagoon plain, etc.), the range of marine spray and salinity, and proximity to the water table (which emerges in the lagunar plain area) and by edaphic conditions (dos Santos et al. 2019).
These scientific records of the evolution of the Maricá coastal plain can contribute to geoconservation by providing information to use in interpretative products addressed to non-experts, through media with photos, images, maps, and published information to provide a simplified explanation of the geological phenomena.
Methodology
We aim to produce an interactive digital resource, a poster, comprising a geomorphological map, films and images of Maricá generated by the drone, at high resolution, supported by scientific information in four paleogeographic maps, in compliance with the fundamentals of geointerpretation.
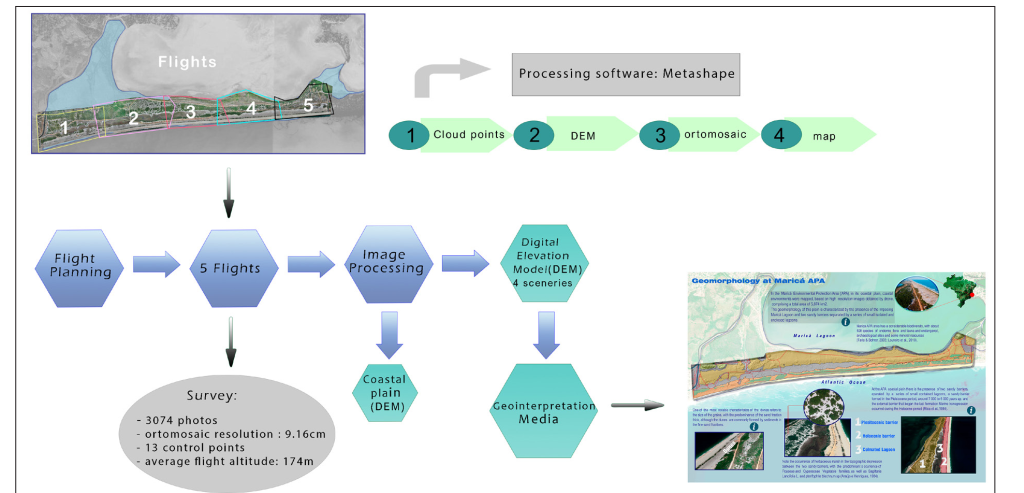
Figure 3. Methodological scheme for production of the interactive poster with key steps: flight planning, image processing, map elaboration, and survey data synthesis.
The steps of the methodology are (Fig. 3):
● Collection of drone images drone;
● Image processing;
● Production of the geomorphological map of the Maricá APA coastal plain;
● Representation of sea level maps of sandy barriers; and
● Production of interactive visual media of the generated maps and scientific information.
Production of the geomorphological map and marine paleo-maps
1. Collection of drone images (flight)
The aerial images were obtained through the 4-rotor Quadrycopter DJI Phantom 4 Pro drone on the APA Maricá area with a Nadir angular camera (FOV = 90º). This drone was chosen because of its long flight time, approximately 25 minutes. In capturing images the drone flew at a height 160 m, with a speed of 10 m/s, resulting in a GSD (soil distance) of 4.8 cm, recording photos of 7.13 MB of resolution. Five flights were programmed in the Drone Deploy software to cover a total area of 7.63 km2, executed in 3 h, with longitudinal and lateral overlapping, 75% and 65%, respectively, making a total of 3149 photos. Thirteen control points were used, belonging to the instant positioning network, implanted, in 2020, by IBGE (Instituto Brasileiro de Geografia e Estatísticas), obtained by navigation GPS or geodetic GPS, at Datum SIRGAS 2000.
2. Image processing
We conducted image processing, the transformation of aerial images into cartographic products, using the 3D modeling software Agisoft Metashape Professional in Russian version 1.7.1, a stand-alone software product that performs photogrammetric processing of digital images and generates 3D spatial data for vectorization from the map and the 3D models. Processing consists of four main steps:
· Dense Point Cloud Generation, producing the collection of points that represent a 3D form, where each point has its own set of coordinates x, y and z and, in some cases, additional attributes.
· Digital Surface Model (DSM), where all input images are combined and stitched together to form a single image in a mosaic using the digital image correspondence technique.
· Digital Elevation Model (DEM), a land grade referenced to a vertical datum (a geodetic datum is an abstract coordinate system with a reference surface), i.e., a surface that serves as the basis for the measurement of altitudes. The Illustrative 3D DEM with texture was created in the QGIS program with a vertical exaggeration of four times, and processed in the Blender 3.10 program, as it provides a very realistic view of the area. The DEM was used together with the orthomosaic for the vectorization of the geomorphological map.
· Orthomosaic, a map composed of several orthoimages, adjusted versions of the original air image that takes into account the distortion due to the tilt of the camera, topographic relief or distortion of the camera lens.
3. Vectorization of the geomorphological map
The production of the geomorphological map, at a scale of 1: 10,000, was performed in the Quantum GIS software, a professional Geographic Information System application. The vectorization of the features was referenced to the geomorphological characterization of the Geomorphological Charter of the Municipality of Maricá, RJ, the Brazilian Geological Service (SGB), with interpretation of base relief standards from the fusion of orthophotos with the digital elevation model (DEM) and fieldwork. The SGB chart was produced with the digital cartographic base and municipal limits on the scale of 1:25,000, of the Brazilian Institute of Statistical Geography (IBGE), 2015.
We used the geomorphological characteristics of the SGB chart as a basis to represent the double barrier system based on the topographic profile of the sandy barrier system (Silva et al. 2014), including geomorphological features such as hills, erosive cliffs, and dunes. Additionally, for details of the features, we combine the DEM with the interpretive photo reading of the orthomosaic, to highlight the limits of precision of geomorphological features.
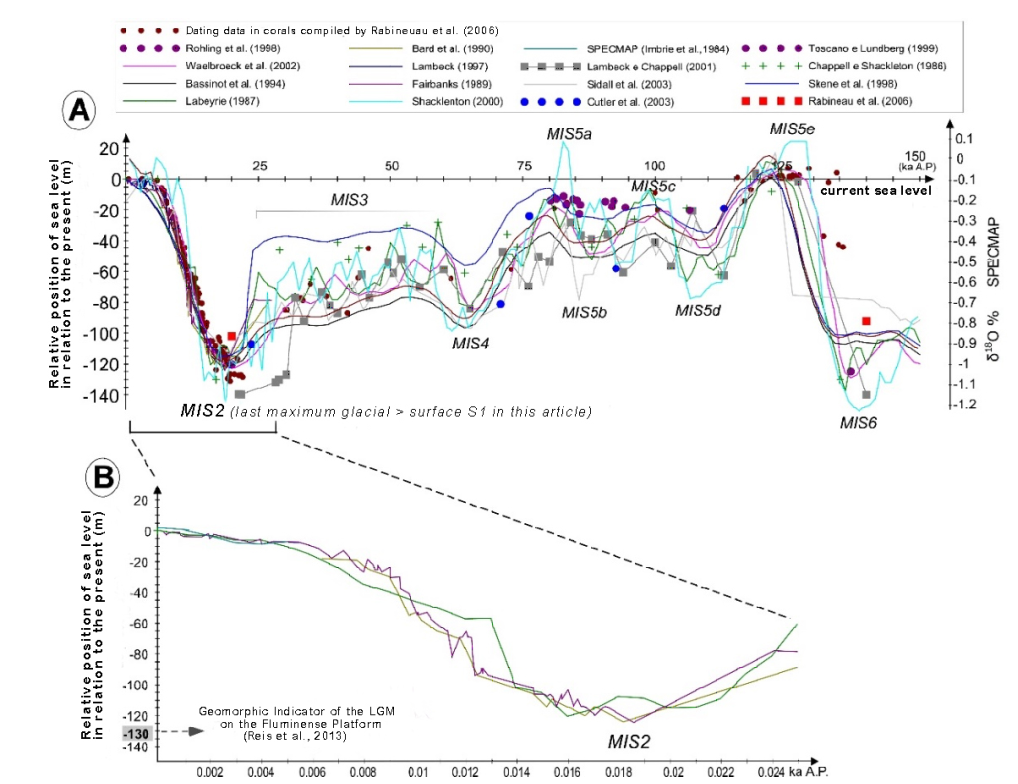
Figure 4. Envelope of eustatic curves based on isotopic ratio δ18 (modified from Reis et al., 2013). Curve used to estimate the age of the Pleistocene barrier in the 3rd sea level map.
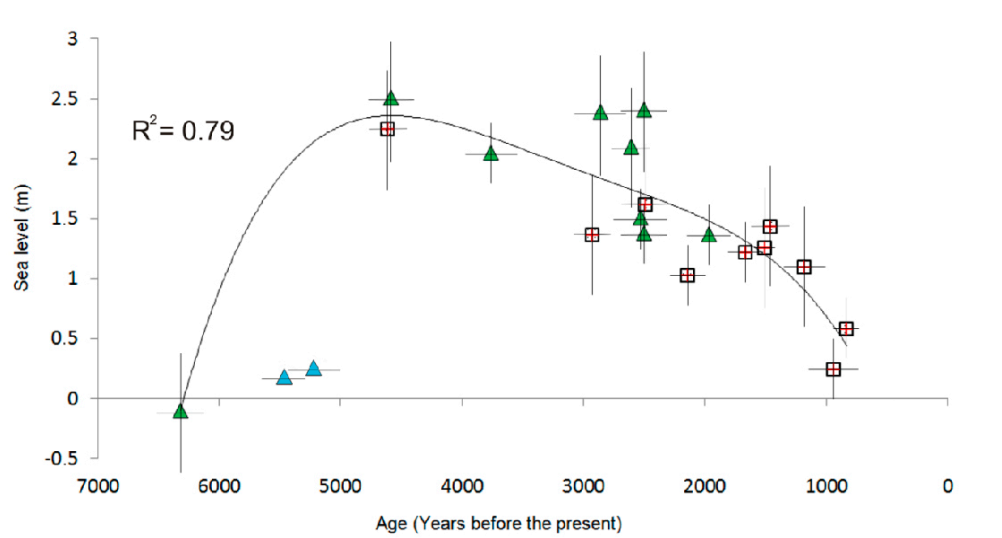
Figure 5. New curve of relative sea-level changes for the lagoon region in the State of Rio de Janeiro (Brazil), based on 21 paleolevels (Dias 2009). Curve used to estimate the age of the Holocene barrier for the 1st and 2nd sea level maps (Jesus et al. 2017).
4. Sea level maps
For the representation of sea level changes, in the region of the municipality of Maricá, digital models of elevation of the municipality itself were produced, with reconstructions of past times in four maps with marine conditions relating to regression and transgression, with oscillations of sea level, which were decisive in the evolution of the Rio de Janeiro coast. We used average sea level variation curves that simulate sea levels at different geological times, with digital models of elevation from the ALOS/PALSAR satellites, to show the varying coastlines and used isobars from Brazilian nautical charts to indicate the geometry of the depth of the sea through time. The following materials were used:
1) The eustatic curve, which presents the absolute variation of sea level to the upper Quaternary period, for the last ~ 500 ka (Tadeu dos REIS et al. 2020), in Figure 4, and for the Holocene the curve of Jesus et al. (2017).
2) Digital Elevation Model (DEM) of the municipality of Maricá, extracted from the image Radar Alos Palsar, 2015, AP 26956 FBS F6720 RT1 High Resolution (PRISM 2.50 and AVNIR-2 medium of 10 m color); and
3) Isobarimetric curves extracted from the Nautical chart 23100 (Int 2123), on a 1:300,000 scale, in the Mercator Projection, in Datum WGS-84, produced by the Hydrography and Navigation Direction (DHN).
Results
The main result of our work was a digital, interactive geographic model based on the geomorphological map, images, 3D videos, and illustrative animations to show the reconstiructions of old marine levels of the double system of sandy barriers through the Quaternary, resulting from sea level fluctuations. The aim is the promotion of geodiversity and geoscientific dissemination to society, where the public can have an exact idea of the scientific approach to nature and about the conservation of the area, enhanced by understanding the geological history.
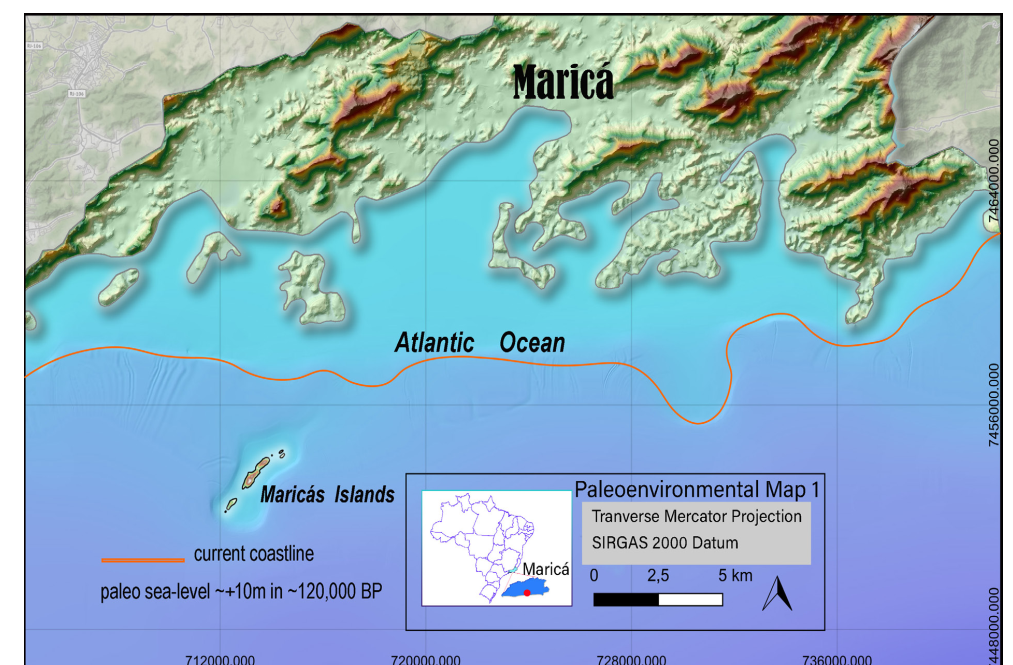
Figure 6. First map with sea level at 10 m above the current sea level, with the presence of a large inlet and with most of the area currently occupied by the flooded coastal plain.
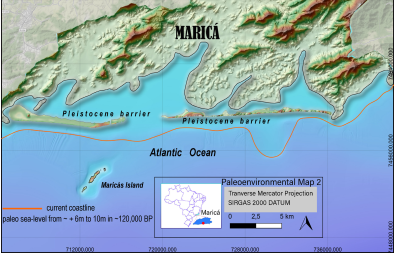
Figure 7. Second map with sea level about +6 m to +10 m above the current sea level, with the emergence of the Pleistocene external barrier, ~ 120,000 y BP.
A. Sea level maps of Maricá coastal plain
MAP 1: when sea level was approximately 10 m above the current level, and the entire coastal plain was flooded (Fig. 6). Perrin (1984) proposed that this related to an important transgressive event around 120,000 y BP.
MAP 2: when the sea level was approximately 6 to 10 m (Turcq et al. 1999) above the current level when the Pleistocene barrier occurred, approximately 120,000 y BP (Fig. 7). Costa et al. (2011) established the radiocarbon date of approximately 120,000 y, confirming Turcq et al. (1999) who suggested that these coastal environments would have started their formation in the Pleistocene, with flooding of the coastal plain and later emergence of the sandbank.
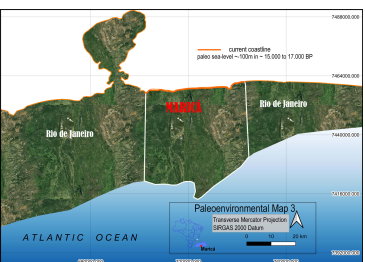
Figure 8. Third map where the continent began from the continental shelf, at approximately 100 m
MAP 3: when the sea level fell approximately 100 m below the current level, between ~ 15.000 and 17.000 y BP (Jesus et al. 2017). At this time, the Maricá islands were linked to the continent (Fig.8 ).
MAP 4: when sea level rose approximately 2.5 m above the current level (Fig. 9). Martin et al. (1984) showed that before the maximum transgression, approximately 3,700 y BP, a second barrier island was already formed, isolating a new lagoon, considerably smaller than the previous one
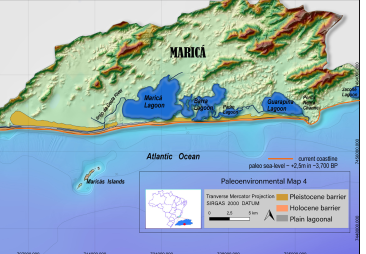
Figure 9. Fourth map, with sea level ~ 2.5m above the current sea level, approximately 3,700 y BP.
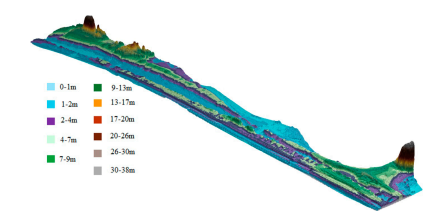
Figure 10. Digital elevation model of the coastal plain of the Maricá Environmental Protection Area with the representation of altitudes
B. Digital Model Elevation (DEM) APA
The DEM (Fig. 10), was generated by “Agisoft Metashape” software, at a resolution of 9.22 cm and a density of 118 points per m2. The highest altitude observed is 38 m at the ends of the raised area of the hill feature. Altitudes up to 2 m occur in the lagoon area, shown in the image by the color blue. In the Holocene barrier are found altitudes of up to 10 m and in the Pleistocene barrier of up to 12 m.
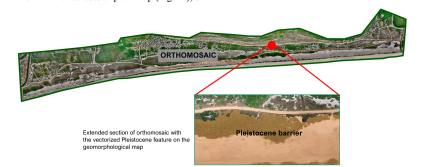
Figure 11. Extended stretch of the Pleistocene feature in the orthomosaic produced by image processing for geomorphological map vectorization.
C. Orthomosaic
An orthomosaic (set of georeferenced photos) was used for the production of the high-resolution map, allowing linear and areal measurements. Combined with the MDE, this enabled vectorization of the limits of the features very accurately, as shown in Fig. 11, which presents the whole orthomosaic with the expanded area of the Pleistocene barrier.
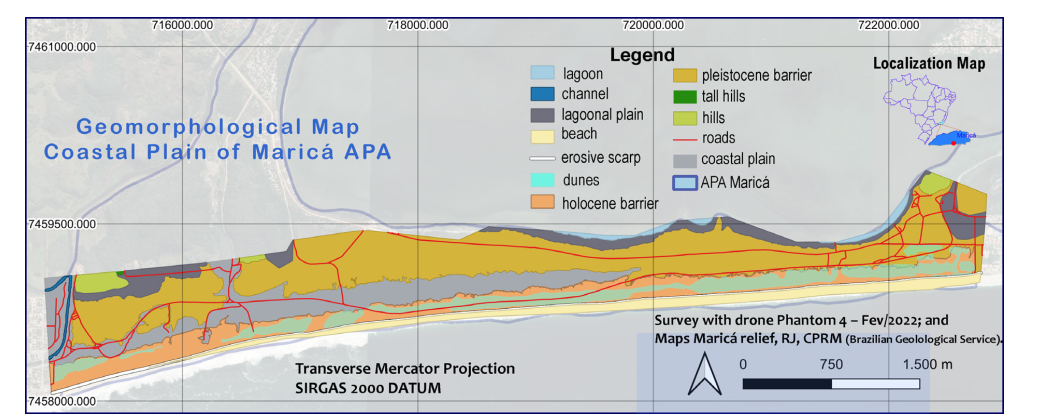
Figure 12. Geomorphological map of Environmental Protection Area of the Maricá coastal plain.
D. Geomorphological map
The APA Maricá coastal plain map (Fig. 12), on a scale of 1:10,000, covers a total area of 5.874 km2, with a longitudinal length of approximately 790 m, and has 11 features, in addition to the roads and erosive cliffs that configure linear features. The most prominent features are sandy, Holocene (1.3 km2) barriers, close to the sea, and the Pleistocene (2.5 km2), near the lagoon margin. Between the two barriers is the lagoon area, with an area of approximately 1 km2 and altitudes ranging from 4 to 12 m. The dunes are concentrated in a track that extends on the reverse of the Holocene barrier, with an area of 550 m2, and reaches up to 106 m longitudinal length. Erosive escarpments can be observed along the Pleistocene barrier where it meets the beach for a length of 8.0 km. The hills appear in the northern portion of the map, where the plain has the highest altitudes and constitutes a small portion of the plain (135 m2).
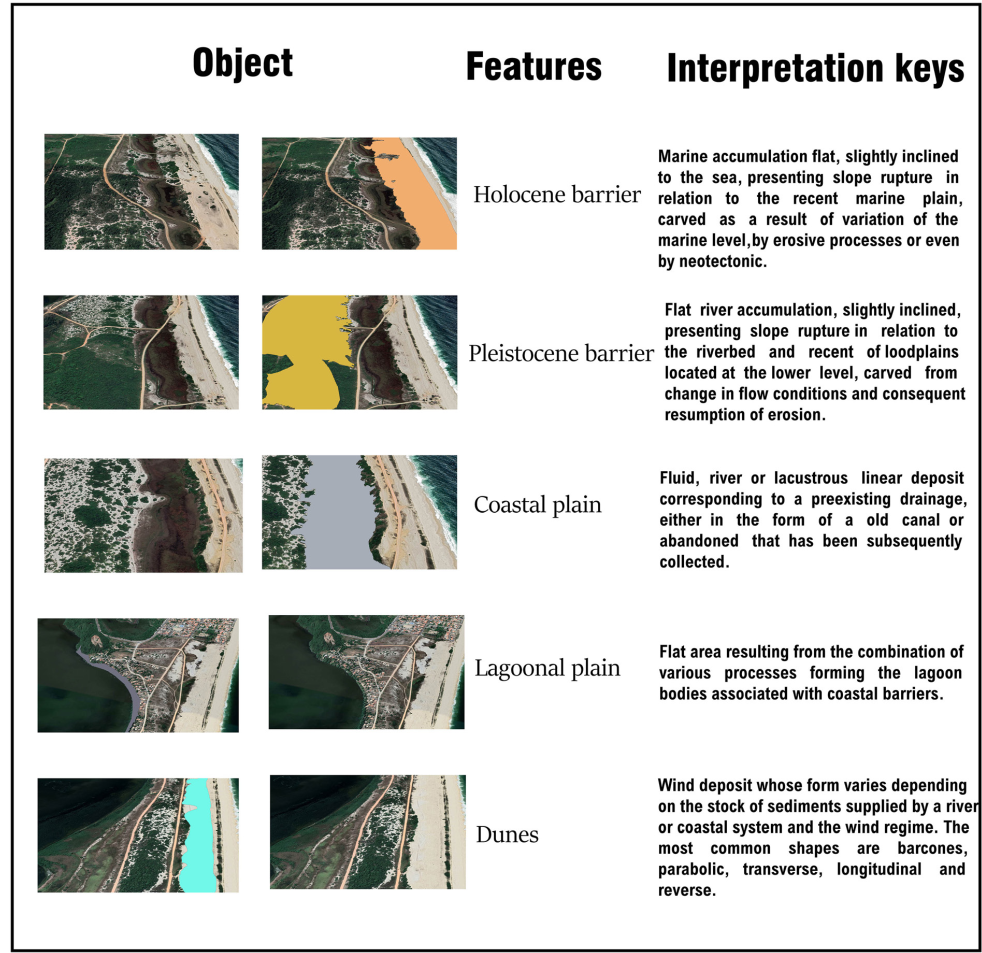
Figure 13. Illustrative frame of the main features of the geomorphological map of Environmental Protection Area of the Maricá coastal plain.
E. Illustrative frame of the main features of the geomorphological map
For the detailed vectorization of the features, it was necessary to combine the MDE with the interpretive photo reading of the orthomosaic, to highlight the limits of the areas accurately. Then the predominant features are listed (Fig. 13), according to the IBGE Geomorphology Manual (2009) with the types modeled on the map.
F. Production of interpretative media
The construction of interactive visual media, as a tool in geointerpretation will enable the public to understand and know the Maricá coastal plain, supported by key features and characteristics based on published articles, and explaining the processes and geomorphological concepts. The purpose is to contribute, through environmental education, with geotourism,
The interpretative media produced in this work has as its theme the scientific information of the Maricá coastal plain, referred to in articles, to allow the public to be aware of the importance of geomorphological characteristics, through virtual reality. Interactive and multimedia maps have become geovisualization tools for data exploration (Theus 2005), with images by which one can show geomorphological formations, in high resolution, with the visualization of scientific data for the monitoring of geological evolution (MacEachren 2001).
We argue that our digital interpretive model meets the three most prominent principles of Tilden (1957), in provoking by attracting the audience to think, in revealing by giving a new idea of the place, and in relating by creating a connection to the place to convince people of its value and the need for conservation. The panoramic flight over the APA, including geomorphological features, is used to put the user on-site, giving the idea that the virtual environment can be seen as real (Lange 2001; Shin 2004). One of the advantages of using multimedia is to tell a story with emotion, using music, accelerating many years of stories (Carter 2001). The digital model explains the double barriers system, and we suggest that the APA geomorphological map and other information meet the concept of geotourism, through the understanding of the landscape, according to Moreira (2014). The geomorphological map, which allows the user to know the features represented, is a geo-visualization tool for geographical interpretation (Martin 2014).
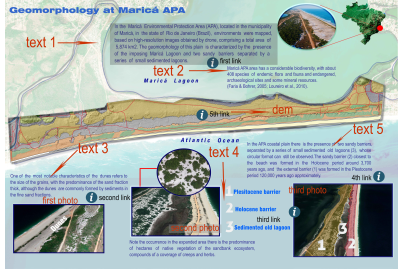
Figure 14. Digital poster with the location of the text and links
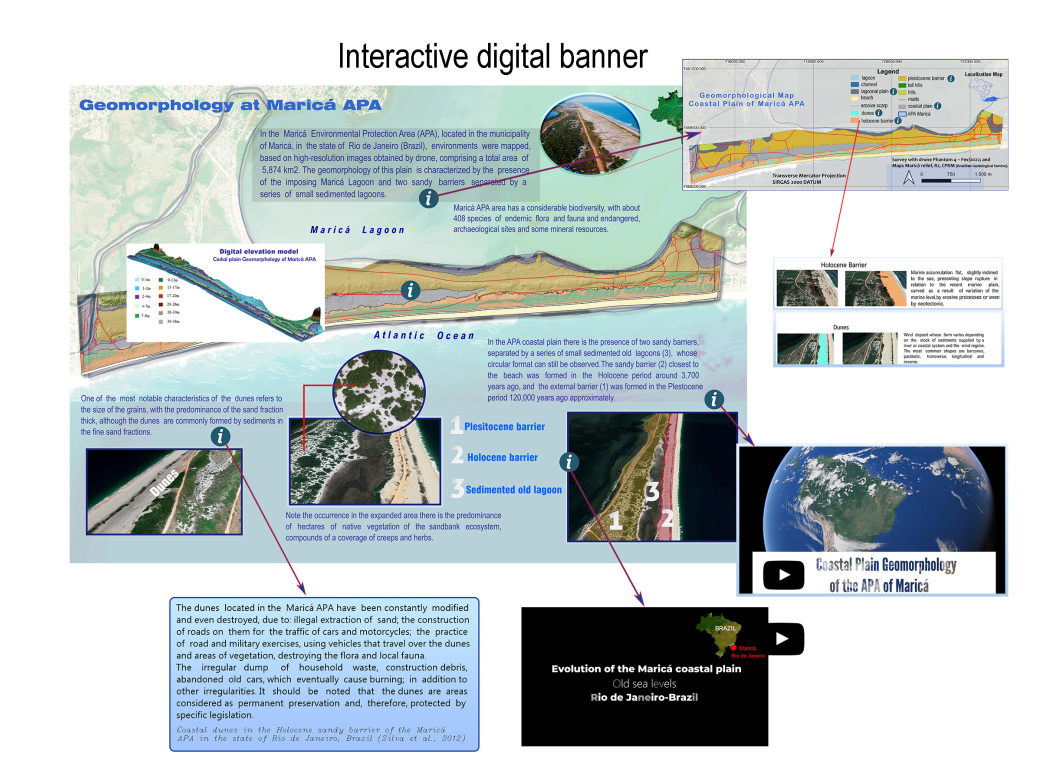
Figure 15. Digital poster with the videos, texts and image links.
G. Interactive Geointerpretation Model
The model (Fig. 14) was prepared using Photoshop 21.1 for illustrations and images in pdf format with links to 3D photos and text and animation, produced in Filmora 11 software. The model includes geomorphological information on the APA Maricá coastal plain, based on already published scientific articles. In texts 1 and 2, at the top of the poster, there is a description of the area mapped by drone, the double barriers system and the biodiversity of the area that is referred to in the geomorphological map with shaded relief of the represented features. At the bottom of the poster are three photos acquired by the drone, associated with text 3 about the dunes, text 4 with a scientific reference to occurrences of plant species and text 5 with the description of the double barriers system. In addition to this information on the poster, there are five symbols “ɩ” (Fig. 15) with information links to complementary information, other images, animations and movies. This interactive poster can be printed in high resolution and it can be made digitally available at the Environmental Protection headquarters or other geoconservation dissemination resources.
The functionality of this digital poster meets the essential elements of interpretation when it comes to how it assists in understanding the importance of the geological site (Carter 2001). This poster can be used for environmental education, as part of children's geoeducation, and for non-specialists in geotourism development by explaining historical processes and geomorphological concepts. The media has an indirect influence on learning, as it proposes elements that offer cognitive knowledge activities (Jonassen et al. 1994).
According to Reynard and Brilha (2018), digital tools are often used to create an environment that helps explore geosites with a contemplative approach or an educational purpose; and they can be of great interest to interpreters and teachers to show a realistic reconstruction of inaccessible landscapes or sites (Martin 2014).
The first link is connected to texts 1 and 2 (Fig. 14) which is related to the geomorphological map shown in this work, with some aspects of the identified relief, where it is possible to select a desired feature and be directed to the description of the geomorphological characteristics and their area in km2. The represented area is about 6 km2 and traveling this area is quite difficult which makes this tool especially useful. A multimedia map is seen as a real alternative to conventional mapping and has the advantage over a printed product in being capable of updating and free distribution (Cartwright & Peterson 2007). Maps have the power to connect people to natural and cultural landscapes that are too extensive to investigate directly (Bailey et al. 2007).
The second link is connected to text 3 (Fig. 14), which is about the dunes in the first photo, and is a kind of hypertext that allows access to verbal texts, images, sounds, etc. According to Jiang et al. (1995), hypermedia is the extent of hypertext through the use of multimedia, which in this case is an image. This link can act as an illustrative panel produced outdoors, as it uses images and concise text and points to the occurrence of the geological features, the dunes (Carter 2001). Such an application has an advantage over physical illustrative panels, as it does not have the cost of a web page.
The third link is connected to text 4 (Fig. 14) and points to the third drone image, with the features of the barriers and the lagoons, which points to animation with maps of the marine Maricá coastal plain. This image includes vectorized features of the double system of barriers (Pleistocene and Holocene) and the lagoons. The animation has instrumental music in the background and includes the four maps accompanied by explanatory texts of geomorphological evolution in the Quaternary. Here, there is a combination of two multimedia features, digital maps and descriptive texts. There is an understanding that the combination of two media has a positive impact on learning (Mayer and Sims 1994) and is under cognitive theory based on the idea that mental image formation helps in learning (Clark and Paivio 1991). The use of multimedia tools allows us to transmit complex information in a simplified manner, leading the user to make connections between observations and interpretations through images of geological processes at generally understood scales.
The fourth link connected to text 4 (Fig. 14) also points to the third drone image, which triggers a film that contains an animation from Google Earth simulating a virtual flight from the coastal plain of APA, to which the features (Pleistocene, Holocene barriers and Lagunar plain) vectorized in this work, in KML (Keyhole Markup Language) format were added. The virtual flight was produced at approximately 500 m height, allowing the visitor to see the same time dynamic paintings of scientific research texts already published, describing the geomorphological features and their interpretations. This video was screened in the Visitor Drivers of the APA Maricá, taught in September 2023 on the theme of Geodiversity.
The fifth link is the map image, which points to an image of the digital elevation model, showing the altitudes of the raised area, generated by the processing of images to enable visualization of the area relief.
Discussion
In recent years, there have been numerous projects using new technologies in geoconservation and geointerpretation (Henriques et al. 2011). Examples include the “Geoguide” application, with a replica of the 3D modeling of the Chauvet-Pont d'Arc cave, in France, to enable public visitation on the web (Reynard et al. 2015; Pica et al. 2018); the virtual model of the Valley of the Geyderes in Russia, with photos, panoramas, 2D and 3D videos and vector models (Leonov et al. 2010); and the high resolution base map of the Yosemite National Park valley in the United States to monitor rock drop activity (Rabatel et al. 2008; Lato et al. 2012).
An understanding of the geological heritage of the site is essential for the development of geotourism, highlighting the geological and geomorphological characteristics of the site, and for proposals for interpretative activities that may show the public the importance and value of the area (Carter 2001). Consistent knowledge of geodiversity is an essential factor in the holistic approach to sustainable tourism development, but it is also highly relevant to compete with nature conservation (Newsome et al. 2012).
A considerable amount of literature reflects the growing development of digital tools applied to geological heritage management, as well as various research techniques that can be applied to conservation projects, including orthophotography for producing maps (MacDonald 2006; Stanco et al. 2011). As part of geovisualization (Regolini Bissig et al. 2009), maps enable the portrayal of the temporal record of a geological process and can help the public to understand the origin of geomorphological formations. Geovisualization using high-resolution images or 3D representation techniques allows the acquisition of precise digital models appropriate for geosite monitoring and can also be used to prevent the vulnerability of geotourists and geosites (Reynard and Brilha 2018).
People's involvement in interpretative planning is crucial to the transmission of the message, as people are participants in interpretation, receivers and senders, so for successful implementation of a plan, it is necessary to work with a wide variety of people, including government representatives, volunteer groups, and local communities to combine the widest range of perspectives (Carter 2001). Producing an interpretation is vital in tourism management in sensitive environments, including many geological sites (Newsome et al. 2012). On the other hand, it is important to understand that the diffusion of geosciences, with the involvement of the population in the dissemination and conservation programs of natural heritage, can promote financial and environmental sustainability (Mansur 2009).
The APA is a landscape with significant natural expression and special cultural characteristics from the traditional fishing colony of Guarani Mata Verde Bonita village. Currently, the area is suffering degradation due to inadequate disposal of waste, and deforestation, and is still the object of an even greater threat, the construction of a luxury resort by the Spanish group Maraey, which will occupy an area of 844 ha. The decade-long works began in April 2023, even contrary to a lawsuit filed by the local fishing and indigenous communities against construction. There is a risk that this venture will end the main economic activity of the fishing community and disregard the importance of maintaining green areas in the urban environment (Loureiro 2010). The “Pro Restinga” movement of environmental organizations, social collectives and researchers has been defending the conservation of the area through manifestations and protests on-site and through social media, on the socio-environmental relevance of the APA of Maricá.
The Maricá coastal plain also stands out for its remarkable environmental diversity, with the presence of a lagunar ecosystem complex, archaeological sites, housing the Maricá APA Conservation Unit, which holds a nursery of endemic species (Dos Santos et al 2017). The Maricá Lagoon is part of the wider Maricá-Guarapina Lagunar System. Silvestre et al. (2021) reported from a study of 123 samples from four boreholes that the bottom of the lagoon is formed by five sedimentary layers and that about 120,000 ya, the basin already existed until the lagoon barrier system caused a partial closure of the basis.
The dunes at APA Maricá located on the Holocene barrier, which reach up to 12 m from mean sea level, are extremely important for protection from the erosive action of intensive storm waves (Carvalho Da Silva & Luiz De Abreu 2012). These dunes have been constantly modified and even destroyed by illegal sand extraction, the construction of roads for traffic of cars and motorcycles, the practice of off-road and military exercises, the irregular dumping of household waste, rubbish of construction works and other waste disposal. It should be noted that the dunes are protected by specific legislation (Carvalho Da Silva & Luiz De Abreu 2012).
APA Maricá management can now count on several tools from this work, including the map that demonstrates the limit of APA, and connects with published research such as dating, and annotation of areas with dunes, particular organisms, species and samples, geomorphological features and barimetric records. Links between managers and the public are enabled and promoted by the new 3D view on the web (Bleisch and Dykes 2006). A second proposal is to connect the digital model to interpretative panels installed on site (Carter 2001), to explain the important points and improve education and communication because, as pointed out by UNESCO (2005), education is one of the most effective forces to bring about changes in knowledge, values, behavior and lifestyles needed to achieve sustainability and stability.
This work aims to disseminate the characteristics of geological heritage by application of geoconservation technologies for the public. Then, here we have presented a virtual poster with images that point to an explanatory text and a virtual tour of the APA Maricá area, recorded on Google Earth, accompanied by geological information from published research, and for maps with descriptions of the geomorphological features. Maps were also produced with representation of the marine habitats of the Maricá coastal plain.
There was a similar study on the Peneda-Gerês National Park (PGNP) in Portugal, where Brilha (1999) proposed the diffusion of geological characteristics through photos and sketches available on the web, with concise scientific texts for the public. In a second example, Regolini Bissig et al. (2009) presented an interpretive application for the web on three connected geomorphological sites, the Derborence Lake, in the Alps Hautes Calcaires, Switzerland, producing an interpretive 3D map available on the web, demonstrating the connection of geomorphological features with the evolution of the landscape. In a third work, Antoniou et al. (2018) developed a web-based application about the Methana Peninsula in the southern part of Greece, comprising a story map with geological data, maps, narrative texts and multimedia content and allowing interaction with users. These works all present similar media to those produced in this article, through an interactive poster, linked to images, scientific textual information, and multimedia information.
The interactive poster with the map and 3D animation has a good level of interactivity as a means of organizing complex information, responding to user requests or offering a virtual experience of one part of the world (Reynard and Brilha 2018). The media proposed here combines real information always associated with a geographical location, whether a map, photos or a virtual tour, allowing the audience to know exactly where the dunes, barriers, or geomorphological features are located. These digital media offer the advantage of having a very small cost compared to the production of panels, leaflets, and publications, or the need to install a specific room for video display. The poster can be viewed at the address http://neac.sites.uff.br/wp-content/uploads/sites/517/2024/05/mapa_base.pdf
Conclusion
We used a drone to acquire aerophotogrammetry photos, making it possible to obtain panoramic images and recording of films for geovisualization tools to publicize the special importance of the geomorphological evolution of this site, in the spatialization of scientific results. The high-resolution recording of the Maricá APA coastal plain, besides contributing to geointerpretation, by disclosing a place to increase the awareness of heritage, through educational and interpretative experiences will provide a cartographic representation of the evolutionary processes of the formation of the plain coastal, through the reconstruction of old marine levels of the Quaternary period.
The results can help foster devices and propose tools that adjust the needs and interests of users to broaden the site's dissemination and implement communication effectively for environmental education, and even encourage more people to know interpretive media. The aerial images offer a challenging opportunity for the propagation of environmental science and education and also enable the creation of applications that can be built for the spatialization of dating records, and records of other geomorphological events and also propose a virtual tour of the site.
Acknowledgments
The authors thank drone pilots Cláudio Ribeiro, Alex Monteiro, and Deyvison Pampolha for the execution of flights and helpfulness throughout visits to the area. Thanks also to INEA, the State Environment Institute responsible by the APA, for authorizing entry into the APA on numerous visits, and to all technicians who assisted in the studies and analysis
Conflict of Interest
The authors declare no competing interests.
References
Antoniou V, Ragia L, Nomikou P, Bardouli P, Lampridou D, Ioannou T, Kalisperakis I, Stentoumis C (2018). Creating a story map using geographic information systems to explore geomorphology and history of Methana Peninsula. International Journal of Geo-Information. 7: 484. https://doi.org/10.3390/ijgi7120484.
Bailey H, Smaldone D, Elmes G, Burns R (2007). Geointerpretation: the interpretive potential of maps. Journal of Interpretation. 12: 45-59. https://doi.org/10.1177/1092587207012002
Bleisch S, Dykes J (2006). Planning hikes virtually–How useful are web-based 3D visualizations? In Proceedings GIS Research UK 14th Annual Conference. Nottingham, UK, 313-318. http://doi:10.1201/9781420055504.ch21
Breg Valjavec M, Dunato Pejnović N, Draženović M, Čonč Š, Polajnar Horvat K (2022). The transboundary approach to landscape geointerpretation: challenges in interpretive planning and geoconservation. Geoheritage. 14:116. http:/doi:10.1007/s12371-022-00751-3
Brilha JB, Dias G, Mendes AC, Henriques RF, Azevedo I, Pereira R (1999). The geological heritage of the Peneda-Gerês National Park (NW Portugal) and its electronic divulgation. Towards the balanced management and conservation of the geological heritage in the new millennium. [Barettino, M. Vallejo & E. Gallego (Eds.)]. Sociedad Geológica de España. 315-318: 316.
Carter J (2001). A Sense of Place An interpretive planning handbook, Scottish Interpretation Networked (2 ed, p:18), 36 e 22.
Cartwright W, Peterson M (2007). Multimedia Cartography. Springer. 2nd ed, 546: 5-8. Berlin, Heidelberg: Springer.
Cayla N (2014). An overview of new technologies applied to the management of geoheritage. Geoheritage. 6: 91-102. https://doi.org/10.1007/s12371-014-0113-0
Clark JM, Paivio A (1991). A dual coding theory and education. Educational Psychology Review. 3: 149-210. https://doi.org/10.1007/BF01320076
Costa LA, Ramos RRC, Dias FF (2011) Sedimentação no segmento costeiro de Itaipu-Camboinhas (Niterói-RJ) durante o pleistoceno médio/final e Holoceno inicial. In Congresso Da Associação Brasileira de Estudos do Quaternário 13: 3–4.
Da Silva ALC & De Abreu MLL (2012) Dunas costeiras na Barreira Arenosa Holocênica da APA de Maricá no Estado do Rio de Janeiro, Brasil. Revista Geonorte. 3: 367-376.
Da Silva Loureiro D, Lage Matias M, Guichad Freire D (2010). Avaliação do conflito sócio-ambiental na APA da restinga de Maricá- RJ. Anais XVI Encontro Nacional dos Geógrafos. Porto Alegre, RS: 9.
Dias FF (2009). Variações do nível relativo do mar na planície costeira de Cabo Frio e Armação dos Búzios – RJ: reconstrução paleoambiental holocênica e cenários futuros. 5f e 15f. Doctoral Thesis in Geology, Instituto de Geociências, UFRJ, Rio de Janeiro, RJ.
dos Santos CP, Coe HH, Ramos YB, de Sousa LD, da Silva AL, Freire DG, Silvestre CP (2017). Caracterização das Comunidades Vegetais na Restinga de Maricá, Rio de Janeiro, Sudeste do Brasil. Revista Tamoios 13.1: 127–128.
dos Santos DS, Mansur KL, de Arruda Jr ER, Dantas ME, Shinzato E (2019). Geodiversity mapping and relationship with vegetation: A regional-scale application in SE Brazil. Geoheritage. 11: 399–415. https://doi.org/10.1007/s12371-018-0295-y.
DHN (Diretoria de Hidrografia e Navegação) - Hydrography and Navigation Direction - Organization of the Brazilian Navy responsible for the production of Brazilian nautical chart.
Gordon JE, Barron HF, Hansom JD, Michael, Thomas MF (2011). Engaging with geodiversity – Why it matters. Proceedings of the Geologists' Association. 123: 1–6.
Henriques MH et al. (2011) Geoconservation as an emerging geoscience. Geoheritage. 3: 117-128. https://doi.org/10.1007/s12371-011-0039-8
Hose AH (2012). 3G’s for Modern Geotourism. Geoheritage, 4: 7–24. http://doi:10.1007/s12371-011-0052-y
IBGE (2009) Geomorphology Technical Manual. 2nd Ed, Rio de Janeiro: IBGE,175, p:38.
IBGE (2020)- Instituto Brasileiro de Geografia e Estatísticas. Brazilian Institute of Statistical Geography - Organizion responsible for specifications and general standards for geodesic curvey in Brazilian Territory.
Ireland S (1987). The Holocene sedimentary history of the coastal lagoons of Rio de Janeiro State, Brazil. In: Sea Level Changes. Basil Blackwell. The Institute of British Geographers Special Publications Series, 2666: 25-66.
Jesus P, Dias FF, Muniz RD, Macário KC, Seoane CS, Quattrociocchi DG, Cassab RD, Aguilera O, Souza RC, Alves EQ, Chanca IS (2017). Holocene paleo-sea level in southeastern Brazil: an approach based on vermetids shells. Journal of Sedimentary Environments. 2: 35-48. https:// doi: 10.12957/jse.2017. 28158
Jiang B, Kainz W, Ormeling F (1995). Hypermap techniques in fuzzy data exploration. Proceedings of the 17h ICC, Poster Session, Barcelona, p.1923-1927.
Jonassen DH, Campbell JP, Davidson ME (1994). Learning with media. Restructuring the debate. Educational Technology Research and Development. 42: 31–39. https://doi.org/10.1007/BF02299089
Lange E (2001). The limits of realism. Perceptions of virtual landscapes. Landscape and Urban Planning. 54: 163–182. https://doi.org/10.1016/S0169-2046(01)00134-7
Lato MJ, Bevan G, Fergusson M (2012). Gigapixel imaging and photogrammetry: development of a new long range remote imaging technique. Remote Sensing. 4: 3006-3021. https://doi:10.3390/rs4103006Leonov, A (2012). Application of ERS data for virtual heritage. Earth From Space 15:55-61
Leonov A, Serebrov A, Anikushkin M, Belosokhov D, Bobkov A, Eremchenko E, Frolov P, Kazanskiy I, Klimenko A, Klimenko SV, Leonova V(2010). Virtual story in cyberspace: Valley of Geysers, Kamchatka. In 2010 International Conference on Cyberworlds. Sigapour: IEEE. https:// doi: 10.1109/CW.2010.42
Mac Donald LW (2006). Digital Heritage: Applying Digital Imaging to Cultural Heritage. Routledge, London, 582, p:160.
MacEachren AM (1995). Visualization in modern cartography: setting the agenda. Visualization in Modern Cartography. 28: 1-12. https://doi.org/10.1016/B978-0-08-042415-6.50008-9.
Mansur KL (2009). Projetos Educacionais para a Popularização das Geociências e para a Geoconservação. Geologia USP. Publicação Especial. 5: 63-74. https://doi.org/10.11606/issn.2316-9087.v5i0p63-74
Martin L, Maia MC, Flexor JM, Azevedo AE. (1984). Evolucão Holocênica da planície costeira de Jacarepaguá (RJ). In Congresso Brasileiro de Geologia. 33, p:105-118.
Martin S (2014). Interactive visual media for geomorphological heritage interpretation. Theoretical approach and examples. Geoheritage. 6: 149–157. http://doi:10.1007/s12371-014-0107-y
Mayer RE, Simms VK (1994). For whom is a picture worth a thousand words? Extensions of a dual coding theory of multimedia learning. Journal of Educational Psychology. 86: 389-401. https://doi.org/10.1037/0022-0663.86.3.389.
Moreira JC (2014). Geoturismo e interpretação Ambiental (1st Ed, p:29). UEPG: Ponta Grossa, Paraná. https://doi.org/10.7476/9788577982134.
Newsome D, Moore SA, Dowling RK (2012) Natural area tourism: ecology, impacts and management. Channel View Publications: Bristol, UK.
Perrin P (1984). Evolução da Costa Fluminense entre as Pontas de Itacoatiara e Negra, preenchimentos e restingas. In: Restingas, origens, processos (LD Lacerda, DSD Araújo, R Cerqueira & B Turcq, orgs. Universidade Federal Fluminense/CEUFF, Niterói,65-73.
Pica A, Reynard E, Grangier L, Kaiser C, Ghiraldi L, Perotti L, Del Monte M (2018). GeoGuides, urban geotourism offer powered by mobile application technology. Geoheritage. 10: 311-326. htpp://doi:10.5016/geociencias.v39i03.14366
Rabatel A, Deline P, Jaillet S, Ravanel L (2008). Rock falls in high-alpine rock walls quantified by terrestrial lidar measurements: A case study in the Mont Blac area. Geophysical Research Letters. 35(10): 2. https://doi.org/10.1029/2008GL033424
Reis AT, Maia RM, Silva CG, Rabineau M, Guerra JV, Gorini C, Ayres A, Arantes-Oliveira R, Benabdellouahed M, Simões IC, Tardin R (2013). Origin of step-like and lobate seafloor features along the continental shelf off Rio de Janeiro State, Santos basin-Brazil. Geomorphology.203: 25-45. https://doi.org/10.1016/j.geomorph.2013.04.037
Tadeu dos REIS A, Amendola G, Dadalto TP, Silva CG, Poço RT, Guerra JV, Martins V, Cardia RR, Gorini C, Rabineau M (2020). Arquitetura e evolução deposicional da sucessão sedimentar pleistoceno tardio-holoceno (últimos ~20 ka) da Baía de Sepetiba (RJ). Revista Brasileira de Geociências. 39 (3): 695-708. https://doi.org/10.5016/geociencias.v39i03.14366
Regolini Bissig G, Alves A, Brandolini P, Garavaglia V, Ghiraldi L, Giardino M, Hobléa F, Martin S, Pelfini M, Reynard E, Rodrigues M (2009) How was Lake Derborence (VS, Switzerland) formed? Popularisastion of geosciences by means of a geotourist map. In Proceeding of 6th European Congress on Regional Geoscientific Cartography and Information Systems (Vol. 2, pp. 290-293). Bayerisches Landesamt für Umwelt.
Reynard E & Brilha J (2018) Geoheritage assessment, protection, and management. Elsevier.. http:// doi: 10.5212/TerraPlural.v.12i2.0009.
Reynard E, Kaiser C, Martin S, Regolini G (2015). An application for geosciences communication by smartphones and tablets. In: Engineering Geology for Society and Territory-Volume 8: Preservation of Cultural Heritage. Springer International Publishing, 265-268. http:// doi: 10.5212/TerraPlural.v.12i2.0009.
SGB (Serviço Geológico Brasileiro) - Brazilian Geological Service- retrieved from www.sgb.gov.br
Shin YS (2004). Virtual experiment environment’s design for science education. International Journal of Distance Education Technologies. 2(4): 62-76. http:/doi: 10.1109/CYBER.2003.1253480
Silva AL, Silva MA, Gambôa LA, Rodrigues AR (2014). Sedimentary architecture and depositional evolution of the Quaternary coastal plain of Maricá, Rio de Janeiro, Brazil Brazilian Journal of Geology. 44: 191-206. https://doi.org/10.5327/Z2317-4889201400020002
Silva JGD, Oliveira ASD (1989). A vegetação de restinga no município de Maricá-RJ. Acta Botanica Brasilica. 3: 253-272:259.
Silvestre CP et al. (2021). Sedimentary facies and Holocene depositional evolution of the Maricá Lagoon, Rio de Janeiro, Brazil. Journal of South American Earth Sciences. 111: 103438. https://doi.org/10.1016/j.jsames.2021.103438
Stanco F, Battiato S, Gallo G (2011). Digital imaging for cultural heritage preservation. Analysis, restoration, and reconstruction of Ancient Artworks. 521: 145
Theus M (2005) Statistical data exploration and geographical information visualization. In Exploring Geovisualization. Elsevier. https://doi.org/10.1016/B978-008044531-1/50424-3.
Tilden F (1957). Interpreting our heritage. University of North Carolina Press.
Turcq B, Martin L, Flexor JM, Suguio K, Pierre C, Tasayaco-Ortega L (1999). Origin and Evolution of the Quaternary Coastal Plain between Guaratiba and Cabo Frio, State of Rio de Janeiro, Brazil. Environmental Geochemistry of Coastal Lagoon Systems. Rio de Janeiro, Brazil – Série Geoquímica Ambiental. 6: 25-46.
UNESCO (2005) - UNESCO and Sustainable Development. United Nations Educational, Scientific and Cultural Organization - https://www.unesco.org/en/brief