Introduction
Here we present a quantitative-qualitive conceptual framework for assessment of geodiversity and apply it to a geoconservation and geotourism “hot spot” of New Zealand’s Coromandel Peninsula (Fig. 1). The method is specifically tailored to estimate geodiversity values within the geological context of an eroded Miocene to Pliocene bimodal volcanic arc formed on a Mesozoic graywacke basement and evolved within a typical siliciclastic shallow marine sedimentary basin. In addition, the complicated volcanic geoforms in combination with their non-uniform erosion provide a perfect geoenvironment where the terrestrial and marine geological settings interface, creating complex coastal areas and near sea level – in many aspects Alpine style – geomorphology. We demonstrate our proposed method is easy to apply to anywhere on Earth and ready to be adapted to local geological and geomorphological assets.
The method is based on an arithmetic average value of key geodiversity elements of the studied area, where the range of the units is based on 5-point system. The identified geodiversity elements represent geological and geomorphological aspects of particular settings, and we demonstrate how our method can be applied to other geoenvironments. The system utilizes the scientific knowledge relating to the subject and includes aspects of geodiversity: geology, geomorphology, soil science, hydrology, and others. In terms of conceptualization, we explore the terms of geodiversity and established methods for assessment to gain a deeper understanding of the current scientific view
The Coromandel Peninsula was selected as a focus for our research due to its iconic position in conservation initiatives and tourism (mostly eco and niche tourism) ventures in New Zealand with strong international recognition (Matthews et al. 2018). While the region is recognized for significant conservation developments both in a New Zealand and global context, to date conservation initiatives have been heavily biased towards flora, fauna, and ecology, the biotic environment (Bell 1994; Bell et al. 2004; Hare & Cree 2005; Stevens et al. 2007; Gardner-Gee & Beggs 2010; Gesing 2019; Hitchmough et al. 2020). Systematic assessment of its geological heritage associated with establishment of a basic inventory has just started recently in New Zealand (Hayward 2017). Conservation research and initiatives based on coastal regions of the Coromandel Peninsula provide useful case studies for assessing global and planetary changes (Schneider et al. 2017).
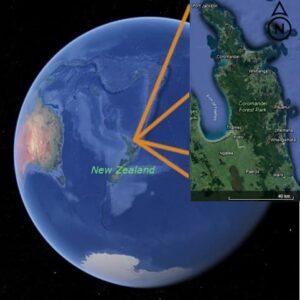
Figure 1. The location of Coromandel Peninsula in the North Island of New Zealand (image is from Google Earth). Its narrow (~40-km) NW-SE-trending, about 100km-long peninsula separating the Bay of Plenty from the Hauraki Gulf.
The Coromandel Peninsula is a narrow (~40-km) NW-SE-trending peninsula, about 100 km long, separating the Bay of Plenty from the Hauraki Gulf in the North Island of New Zealand (Fig. 1). Its Mesozoic graywacke-dominated basement (Mortimer et al. 2014; Mortimer et al. 2017) hosts Miocene-to-Pliocene andesitic-to-dacitic stratovolcanoes in the western and central parts and Pliocene silicic calderas in its eastern locations (Briggs & Fulton 1990; Adams et al. 1994; Malengreau et al. 2000; Nicholson et al. 2004; Smith et al. 2006; Booden et al. 2012; Hayward 2017). Pliocene basaltic volcanoes are significant geo-cultural sites in the NW of the peninsula and the Mercury Islands group, forming dense coastal settlement sites used by pre-European indigenous inhabitants. The region has a rich Māori cultural heritage (Wellman 1962; Lyver et al. 2008; Moore 2013; McIvor & Ladefoged 2016; Davidson 2018; Maxwell et al. 2018) as well as mining heritage from the early European settlement time, with mining for epithermal mineral deposits still active (Barker et al. 2006; Spörli & Cargill 2011; Legget 2012). The region’s geology is strongly influenced by the effect of immediate and prolonged post-volcanic activity, creating a great variety of rock alteration features, mineralization, and landforms (Malengreau et al. 2000; Sheppard et al. 2009; Mauk et al. 2011; Simpson et al. 2019). The Coromandel Peninsula is one of New Zealand’s iconic tourism destinations, especially Cathedral Cove, Hot Water Beach and nearby areas (https://www.newzealand.com/nz/feature/11-must-do-north-island-experiences/, https://www.tourism.net. nz/region/coromandel/attractions-and-activities#tab-listings-list). Meanwhile, research in this region is concentrated on biosphere and cultural studies (Betty et al. 2020). The peninsula also consists of extensive rural areas and is strongly impacted by local and regional tourism developments The region has been the subject of some advanced research on tourism perceptions, useful for an expanded understanding of the geoheritage framework of the region (Fairweather & Swaffield 1999; Holzapfel 2003).
The post-pandemic economic downfall has impacted the region heavily, but it still stands as a top New Zealand tourism destination (Rowland 2020; Tantau 2020; Thames-Coromandel District Council 2021) While tourism research, biotic nature research, and a few core geological researches have been undertaken relating to the region, there has been no geoheritage or geodiversity research conducted yet in the area. However, the Coromandel Peninsula is a prime location to explore and develop geodiversity studies from multiple directions. Here we present a preliminary conceptual framework to highlight the geodiversity of the region. Geodiversity is a complex definition with several meanings (Brilha et al. 2018). In the next sections we explore the current state of our understanding of geodiversity and provide a locally suitable conceptual framework to apply to the Coromandel Peninsula.
The Definition of Geodiversity
Geodiversity as a scientific discipline is relatively young, with consensus of a complete meaning still to be reached. Its definition often depends on the type of research and environment of the region. Some researchers define geodiversity as a value based on the number of geological features (Gray 2004), while others claim that processes and climate must be included in this paradigm, as well as evidence of human and biological activities (Kozłowski 2004). This demonstrates contemporaneous development of the term that could include geological sites, abiotic processes, geomorphic processes, and cultural connections and influences. Therefore, clarification of the definition will assist us in creating a simple method to calculate the rate of geodiversity throughout the world, with an embedded ability to compare the results and establish regionally appropriate systems for geoconservation and geotourism.
According to Serrano & Ruiz-Flaño (2007), the first recorded use of the term geodiversity was by Federico Alberto Daus, an Argentinian geographer, in the 1940s, but it was used to describe the landscape of human habitation and cultural diversity on geographical territory (geographical diversity), with only a light connection to geological values. In contrast, Gray (2004) described geodiversity as the sum of the Earth's history, tectonics, minerals, rocks, sediments, fossils, landforms, geomorphological processes, and soils. In other words, it is an aggregation of all geo-objects and processes that have an influence on geodiversity of the Earth. Kozłowski (2004) collated definitions of geodiversity as used by other researchers, and concluded that geodiversity is information about the Earth’s surface objects such as: geological aspects, geomorphological aspects, soils, and water resources. Systems, as the result of natural processes and human activity, were also added to his paradigm.
Polish scientists are working on the Geodiversity Atlas of Poland (Kozłowski 2001) which defines categories of geodiversity such as geological structures, the Earth’s surface relief, soils, surface water, groundwater, mineral and therapeutic waters, thermal waters, and landscape structures. However, only a few Polish maps of geodiversity are currently available for specific territories such as the Polish Carpathian Mountains (Zwoliński 2008; Zwoliński 2009), Tatra National Park (Zwoliński & Stachowiak 2012) in the south of Poland and Karkanowski Park Narodowe (Knapik et al. 2013) in the south-west part of Poland on the border with the Czech Republic. Kozlowski also referred to Postgate (1994), who claimed that “Geodiversity should be dealt with as a determinant of life which can evolve on planets with an appropriate humidity and temperature, and when metastability is present''. This quotation shows that climate has a high influence on the composition of geodiversity through the changes in weather condition which can be easily seen in the tropical areas of Africa and Australia (Milnes et al. 1987), where the high temperature and wet climate forming laterite which is considering as a rock and soil type (Tardy 1997). González Trueba (2007) considers seas and oceans and the physical elements and processes within them as an important part of geodiversity, which led to an expansion of this definition from the lithosphere to hydrosphere and atmosphere of the planet. Then, Gray (2018) claimed that geodiversity is the natural range (diversity) of geological (rock, minerals, fossils), geomorphological (landforms, topography, physical processes), soil and hydrological features. Additionally, it includes their assemblages, structures, systems, and contributions to landscapes (Gray 2013). Brilha et al. (2018), demonstrated the importance of nature diversity, as biotic and abiotic nature are the main elements for sustainability of human society. He showed how to identify geodiversity based on quantitative and qualitative approaches, scale, and potential use, while the main issue is to highlight the connection of geodiversity with ecosystem services such as: water, minerals, fuel, number of services from supporting and regulation to cultural.
Our method is one step towards placing geodiversity within a framework of sustainability against the backdrop of current environmental issues faced by humanity, much as biodiversity has become a marker for our continued impact on the Earth and its biotic systems. Brox & Semeniuk (2019) identified the “8G’s” for protection, management, and education in the field of geology: geology (1), geoheritage (2), geoconservation (3), geosites/geoparks (4), geomanagement (5), geo-education (6), geotourism (7), and geodiversity (8). They concentrated on the questions of geoheritage, geoconservation, geosites/geoparks, geomanagement and, only lightly touched on geoeducation aspects. However, the 8G’s are a complex paradigm in understanding management of geological data and can in fact complicate the application of geological knowledge for geoconservation, geoeducation, and geotourism. However, Gray & Gordon (2020) criticized Brox and Semeniuk’s work on the 8G’s, especially on the aspect of geodiversity. They questioned the separation of geodiversity from the other 7 G’s and presented it as one stand-alone geological aspect, which is contrary to Gray’s (2018) previous work, where geodiversity is the backbone of geoconservation and geoheritage. This demonstrates that defining aspects of geodiversity, geoheritage and all other subjects related to them are still subject to debate. This can be justified by the complexity represented by the term geodiversity where abiotic nature is not only landforms and geology shaping our environment, but also the many other aspects, which interact with them.
Geodiversity as a Concept in Mainstream Global Scientific Outlets
Our main aim is to assess the current global understanding of geodiversity and define the most measured and utilized aspects in any geoheritage valorization works. We aim to create a method for the geodiversity assessment of the Coromandel Peninsula using research outputs based on numerous globally recognized databases such as Thomson Reuters and Web of Science [https://www.webofknowledge.com]. We followed this logical path to ensure the global relevance and acceptance of our results, so they can be compared immediately to other locations. The most significant concept this study addresses is geodiversity, and we have used the Web of Science (WoS database) to identify internationally significant and peer-reviewed research outputs from 1900 to 2021. The results of our search demonstrate influences of various researchers on the field of geodiversity and define the number of studies accessible to scientists throughout the world. A further issue is that a significant proportion of the knowledge base (articles, reports, and research) may only be accessible for local use. The search word “Geodiversity” was chosen as a topic through all data bases (WOS, BIOABS, CABI, CCC, FSTA, KJD, MEDLINE, RSCI, SCIELO). Our search identified 813 articles from 1995 (Sharples 1995), which we consider a very good number for such a young science topic. The highest number of papers have been published in the last five years (390 results) 2017 – 84 articles, 2018 – 98 articles, 2019 – 120 articles, 2020 – 119 articles and 2021 – 26 articles (Fig. 2). Hence, a search through the WoS shows that geodiversity is a developing term. Moreover, these actions encourage others to further refine the definition of geodiversity and extend the research framework for abiotic nature.
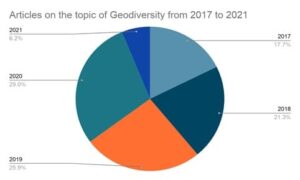
Figure 2. The number of articles on the topic of Geodiversity from 2017 to 2021 based on a search through Web of Science database. Where 2019 and 2020 are the most productive years for Geodiversity.
Conceptual Structure of Geodiversity
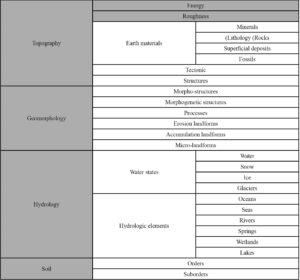
Serrano & Ruiz-Flaño (2007) summarized all geodiversity’s parameters in one table to display elements of existing definitions (Table 1). However, they claimed that components of geodiversity are not as important as their scale of research. The scale shows the level of organization which scientists should use for assessment, and they created four levels of geodiversity: particles (atoms and molecules, minerals, sediment particles, energy processes), elements (topography, geology, geomorphology, hydrology, and soils), places (geotope and geosystem etc.), and landscape geodiversity (includes biotic and abiotic factors (natural diversity) and human influence). The final scale level is open relationships to geographical diversity through the connection of geology and other scientific fields of study.
Table 1. Elements of Geodiversity on the Earth (Serrano and Ruiz-Flaño, 2007). This table showing that the basic parts of geodiversity is topography, geomorphology, hydrology, and soils. While the right column shows elements, which are the parts of bases.
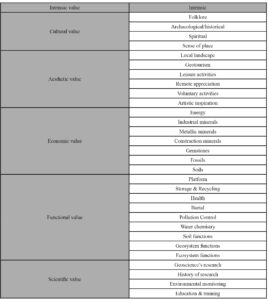
Geodiversity values are given to factors of abiotic nature such as lithology, tectonic processes and features, geomorphology, soil, hydrology, topographic elements, and physical processes on the land surface and in the seas and oceans. Further, geodiversity can be seen in all systems generated by natural and human processes, which cover the diversity of particles, elements, and places. A significant study of geodiversity was made by Gray (2008b), where he added to the geological and geomorphological objects also their assemblages, relationships, properties, interpretations, and systems, thereby widening the definition. Earlier, Gray (2005) also presented the table of values for study of geodiversity and geoconservation (Table 2).
Table 2. The summary of Geodiversity Values (Gray, 2005). Gray presented this table to show how the term of Geodiversity can relate to different science subjects through values. For example: intrinsic value is showing things as they are rather then how they can be used.
Currently, geodiversity research occurs predominantly in Europe, Asia, and America, with a particular geoconservation perspective to protect the heritage of abiotic nature and human culture, as well as providing geotourism and geoeducation in these places. Zwolinski et al. (2018) described a framework for assessment of geodiversity by two methods. First, the direct method is based on field work observation with collecting and measuring elements of the natural environments such as rocks, soils, types of landforms, etc. Analytical methods are then used to establish an accurate view of geodiversity of the region. However, this method is expensive and time-consuming as well as being limited. In contrast, the indirect method is much cheaper as it is based on calculation of raster and vector data using Geographical Information System (GIS) software, which though accessible and widely applicable can have low accuracy. Additionally, Zwoliński et al. (2018) distinguish three groups of methods: qualitative, quantitative, and qualitative-quantitative. The qualitative method uses the experience of experts to create a value system for features or sites to be assessed. The quantitative method is the simplest as it applies instrumental measurements, calculations, and analysis of the raw data. Quantitative-qualitative methods is a combination of the previous two, hence it is probably the most advanced and technically one of the best solutions in the assessment of geodiversity.
Today, quantitative assessment of geodiversity is the most popular among researchers. One method (Cañadas & Flaño 2007; Serrano & Ruiz-Flaño 2007) uses an equation based on the number of elements in the study area, thus creating an index of geodiversity as well as a roughness index. Da Silva et al. (2019) applied this equation in their assessment of the Seridó Geopark Project, Northeast Brazil, using a 2 x 2 km grid to divide the area into 824 polygons, and then calculating a value for each polygon. To obtain a result for geodiversity, they calculated and combined five subindex maps: hydrology, geomorphology, lithology, pedology, and mineral occurrences.
Bétard and Peulvast (2019) used the same method to identify geodiversity hotspots in the Ceará State, in north-eastern Brazil, using the geodiversity and threat indexes to highlight places with high geodiversity and subject to a high threat as the main sites which would most benefit from protection. To create a geodiversity index, they applied a calculation to the geological diversity index, the geomorphodiversity index, the pedodiversity index, and the hydrodiversity index. All these indexes were presented as models created from maps and readily available online resources such as SRTM. Meanwhile, the threat index was calculated using the protection level sub-index, the land degradation sub-index, and the land use sub-index.
Russian researchers used their own variant of this methodology to highlight places with high geodiversity. For example, Loskutova (2020) researched geodiversity of the Kosh-Agachskij district of SE Altai, Russia, aiming to establish geotrails and excursion-education programs that would be easily accessible to tourism operators and planners. She uses earlier definitions of geodiversity, such as Eberhard’s (2002) claim that “Geodiversity includes evidence of the Earth’s history, previous life, ecosystems, environment, and range of current processes (biological, hydrological and atmosphere), which emerge in rocks, surface relief and soils” and Stanley’s (2004) definition that “Geodiversity is the link between people, landscapes and their culture through the interaction of biodiversity. soils. minerals. rocks. fossils, active processes and the built environment ”. Loskutova (2020) concluded that geodiversity is a range (or diversity) of geological formations, surface formations and soil specialties with collaboration of all systems and processes. According to Chernyh (2008), “Local systems of specially protected natural territories: reality and perspective” describe geodiversity as abiotic natural objects such as water source ecosystems, natural facies with high radioactivity, caves, and others. He claimed “Often, the specialty of territory is determined through the complex of typical parameters, which together create a unique object. All processes are repeatable, but their complexes are always special”.
Then Korf (2020) in her PhD dissertation demonstrated a quantitative assessment of geodiversity of the territory of Verhnia Chui in Altai Geopark, Russia. The main goal of this project is to develop a methodology to assess significance of elements of geodiversity for geotourism in the defined territory. Korf (2020) proposed a table defining types and subtypes of elements of geodiversity (Table 3) incorporating elements of geodiversity such as biogeological, stratigraphic, geomorphological, geoarcheological, geological, water resources, and complexes. These elements were chosen according to sites with a high level of tourism attraction.
Table 3. Table of the proposed conceptual framework of geodiversity of Coromandel Peninsula. The table contain two main objects: geology and geomorphology, while additional objects are hydrology, climate, human and biological footprint. Every object contains the number of elements which describe it in more details.
Objects | Elements | Subject |
Main Values Geology and Geomorphology | Morphology and Valley Network General topography of region | Definition of landform categories, valley network and slope angle categories |
Rock and Fossils Types Definition of the rocks, fossils and their ages | Spatial representation and weight value assignments of specific rock/fossil types | |
Volcano types Definition of the volcano types recorded in the field | Application of volcano geology model to calderas, intermediate stratovolcanoes and small monogenetic volcanoes (assignment of values) | |
Caves Identification of caves | Measuring numbers and types of caves as well as their spatial distribution pattern | |
Alteration and Weathering and Mineralization Definition of alteration and weathering types | Application of weathering index to surface areas, assignment of number density of altered and weathers surfaces and mineralization types | |
Structural elements Definition of faults and folds in the context of the region structural geology | Spatial measurement of the types and abundances of the structural elements | |
Soil – Mass movement Identifying type, distribution and mass movement | Categorization and valorization of soil types and mass movements with spatial representation | |
Additional Values Hydrology - Hydrosphere | Drainage network Identifying the drainage pattern and types (links to the “Valley network” but measuring the current runoff pattern) | Measuring of drainage pattern, assigning values of water production |
Lakes - Swamps - Marshland Identifying their locations | Spatially assigning values of swamp in respect of their geological entity | |
Coastal Hydrosphere Identifying coast types, tidal zones and shallow marine environment | Defining the values associated with specific coastal environment | |
Geothermal and Hot Spring Region Location and definition of their types | Associating values of their significance in geological context | |
Climate | Weather Pattern, Wind Pattern Sunny Hours Identification of weather pattern, seasonality and paleoclimate | Categorization of weather patterns in geological context with special reference to orogenic rain fall data, temperature variation and sun exposure data |
Biological Footprint | Modern Biological Impact on Rocks and Soils Identifying biological footprint types | Categorization of biological footprint types (marine, domestic/wild animals and humans) |
Human Footprint | Human Occupation Sites and Archaeology Identification of type of archaeological sites, human activities, cultural horizons and geological tool mastering and trading | Categorization of archaeological values and spatial representation of them. |
Mining and Natural Resource Utilization Identification of ore types, distribution and exploitation through history | Categorization of ore and economic geology sites of the region |
Components of Geodiversity in our Evaluation Method
To sum up, geodiversity from a global perspective is a relatively new area in the scientific arena, which has not been completely defined. To date, it has been developing towards a definition mainly based on geological factors shaping the diversity of abiotic nature around us. Hence, we have arrived at a picture of geodiversity as a systems-based definition containing information about all abiotic elements and processes, and the subsequent impact on geological objects and landscapes, including human and biological footprints. Reflecting on this definition, any data collected from the natural environment can be considered a facet of geodiversity or an influence on geodiversity values. For example, soil evolution demonstrates abiotic processes (weather condition, epithermal activity) working in parallel with biologically driven processes to alter solid rock into soil through chemical, mechanical, and biological weathering resulting in a nutritionally complex soil profile (Van Breemen & Buurman 2002). This demonstrates that soil should be considered an element of geodiversity, while associated abiotic and biological processes as weathering triggers can be considered side effects rather than main elements. In this case, any point on a landscape surface contains many natural abiotic elements, which may lead scientists to modify the scale of their research to simplify their study. It is also apparent that there are two pathways towards estimating geoheritage; one that follows a globally calibrated theoretical and practical method, and another that is specifically tailored to the study area following its special geological and geomorphological values. Intuitively, the first approach can be used for comparative studies across a great variety of geological and geomorphological scenarios. However, this may provide low resolution results with limited use for local authorities and organizations in regional assessment and local planning.
To overcome the above-mentioned issue, we provide a geodiversity measuring system specifically tailored to the Coromandel Peninsula in New Zealand (Table 4). While our framework is site-specific, the proposed method is not. Our research methodology can be applied to visible factors (no deeper than mineral level) within landscapes to create an overall inventory of geodiversity values at a practical and useful scale for further research, land management, tourism ventures, and community development.
Table 4. The scale of the main values of geodiversity. The table shows the summery of grades values of four elements of core of geodiversity. Morphology can be assessed according to the steepness of the slope, geology – rock types with connection to their ages which depend on their amount exposed on the surface. Weathering showing the rate of rock erosion. Structural elements are folds and faults, where their values depend on their complexity.
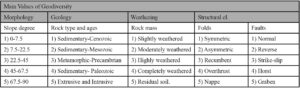
Our method (Table 4) builds on previous definitions of geodiversity (Gray 2004; Kozłowski 2004; Gray 2005; Serrano & Ruiz-Flaño 2007; Gray 2008a). The Coromandel region has high values for volcanic geology together with coastal processes (Adams et al. 1994; Malengreau et al. 2000), mineralization and alteration genesis (Adams et al. 1994). All these themes have made this area attractive for human settlement and development (Harding & Boothroyd 2004). In definitions of geodiversity, geology and geomorphology have been considered as core factors, so we weight these more than other processes and influences, as these relate to the physical body of the Earth. On the other hand, climate, hydrology, human and biological footprints are considered processes that shape geodiversity and trigger changes in the core geology and geomorphology (Fookes et al. 1988).
We separated core geodiversity values based on geological and geomorphological processes shaping the region, from those we define as additional values. We include streams and rivers in the SW and Central sector which have had a considerable influence on the landscape morphology (West et al. 2005), namely geomorphology and valley networks. An additional main value is rock and fossil types, which is strongly connected to the third main value of volcano types. This is reinforced by the geological definition of the wider region as The Coromandel Volcanic Zone, which includes andesite, rhyolite, and basalt rock formations (Booden et al. 2012). Subsequently we included weathering (mineralization and alteration), even though previously we described weathering as an additional value. However, here we refer to weathered rock masses as geosites (McPhie 1993; Hack 2020). Alteration and mineralization have provided ideal conditions for forming epithermal gold and silver ore deposits, resulting in a significant history of extraction from quartz, and associated social and economic development (Hayward 2017). Structural elements are significant, as faults and folds provide visual evidence of tectonic movements (Fossen 2016). Cave formation may also be influenced by geological processes but are ultimately shaped by weathering and erosion (Davies & Morgan 1980). The last element of geodiversity we consider are soil forming processes and soil types, as rocks become highly altered by biological, chemical, and physical weathering over long periods (Nazarenko et al. 2006).
As an additional value, we chose hydrology as rivers, streams, lakes have a considerable influence on rock formation in the south part of the peninsula, while oceanic activities in the north and east strongly shape coastal geomorphology (West et al. 2005; Hayward 2017). Climate is included as an important factor shaping geodiversity through its influence on weathering and erosion of rock masses (Tukiainen et al. 2017). Biological activity has influences on rock in transforming it into soils, especially through metabolic processes in the micro-biome (Nazarenko et al. 2006). As previously mentioned, human activities have had a significant impact on the Coromandel ecosystem with weathering, mineralization, and alteration processes leading to mining activities in the region (McPhie 1993; Hack 2020).
Our approach fulfils criteria outlined by other researchers and uses approaches to understand and characterize geodiversity. Geographical Information Systems (GIS) will help scientists make a simple calculation of general geodiversity of the studied territory resulting in a precise plan of geoconservation for protection, or to provide a foundation for the most economical and highly educational tracks for geotourism and geoeducation ventures (Bétard & Peulvast 2019; Gravis et al. 2020).
Assessment Methodology.
In this section, we concentrate on the main geodiversity values as previously defined, to create a general systematic framework applied specifically to the Coromandel Peninsula. Assessment of the main values can be achieved relatively simply by selecting mapped locations with the highest concentration of different types of geomorphologic and geological features and mark them for comparison with other points. However, this type of assessment could be improved through accurate assessment of the whole territory. A similar approach has been followed by Betard & Peulvast (2019) in Ceará State (Brazil) by creating a range of maps in ArcGIS to calculate the geodiversity hotspots through the index of geodiversity and index of threats. Their research demonstrates this type of methodology as effective in visualizing geodiversity at a landscape scale, thereby facilitating protection of the most valuable, vulnerable, or high-risk locations. However, their research was driven by a different goal than ours, and they used maps at a relatively low 1:500, 000 scale, providing a low-resolution overview of the geodiversity.
Our project may be a first step towards establishing a foundational database for higher scale thematic geodiversity maps that could be deployed for local, regional, and national planning and land-use mapping. Higher scale geological maps at 1:100, 000 and 1:50, 000 scale exist for the Coromandel Peninsula, but some were published in the 1970s and are nearly fifty years old, leading to challenges in creating detailed thematic geodiversity maps without substantial on-ground field-surveys. Therefore, for this project our target is only the region of the Coromandel Peninsula where we can realistically use existing data and create new data to provide a realistic and effective map of geodiversity values.
To create a geodiversity map, we calculate the main elements of abiotic nature of the region (Table 4) as a sum of 7 marks, with 35 the highest achievable. These 7 marks are representative of main values (Table 3), and each is rated from 1 to 5, where 1 is the most common object and 5 is the rarest and the highest mark possible for one element of geodiversity (Table 4). The area of research will be assessed (Dias et al. 2021) according to information from the morphological (elevation and slope), geological, soil and other maps. For the first time, the assessment will be done through GIS software which allows us to divide the whole area into polygons with a specific mark from 1 to 5. Chosen maps are divided into a grid, with each square assigned elements of geodiversity to provide enough information to calculate a mean value for the square for every element of geodiversity. In conclusion, each square has 7 maps with marks that sum up in a single number a representation of the geodiversity value.
Observation of Main Values
The main values in the conceptual framework of geodiversity (Table 3) include 7 elements: Morphology, Rocks, Volcanoes, Caves, Weathering, Structural Elements, and Soils. Morphology is one of the main elements of geodiversity, describing the shape of the landscape, and including all aspects of the rocks and history of a region. We begin assessment with mapped and surveyed landscapes, where basins, plains, hills, cliffs, and mountains can be used as an analogue for the scale from 1 to 5, where plains are the lowest mark of geodiversity and mountains the highest (Fig. 3). While this may prove useful, one shortcoming is the difficulty in defining strict boundaries between landscape forms. For example, a plain displaying a slope of 7 degrees could be a stand-alone plain, or a plain transitioning to a region of foothills. Therefore, wider landscape and geological context is important. Hence, we decided to concentrate not on the forms of the relief but on their parameters. Sloping areas can easily be divided into small polygons based on degree of slope, using the program Grass GIS (https://grass.osgeo.org/). This software has a function that can create a slope raster map based on a horizontal vector map. Slope steepness was chosen, as steep slopes are most likely to contain rock outcrops because orogenic activity can create higher elevations. On the other hand, steeper slopes can also result from weathering and erosion, which transfer particles downhill and expose new outcrops where rocks were covered by weathered material. However, even with this concept, we still encounter problems relating to gradation.
Some researchers have explored dividing slopes into categories according to steepness; Zhuchkova & Rakovskaja (2004), created two scales of slopes for steppe and mountain areas (Table 5). The Barcelona Field Studies Centre (https://geographyfieldwork.com /SlopeSteepnessIndex.htm) proposed their own grade, and unlike the previous one, it can be used to assess any kind of territory. Despite the differences, all have similarities for steep slopes from 45 degrees and higher. Based on their work, we chose these five levels: 1) 0–7.5, 2) 7.5–22.5, 3) 22.5–45, 4) 45–67.5 and 5) 67.5–90 degrees (Table 5).
Table 5. The scale of slopes made by Zhuchkova and Rakovskaja for two morphological types of territory Plains and Mountains (2004). The difference in the rate of slope’s degrees according to the erosion threat for soils layers.
Plains | Mountains | ||
Less than 1 degree | Flat | Less than 4 degrees | Flat |
1-3 degree | Light slope | 4-10 degree | Gentle slope |
3-5 degree | Gentle slope | 10-20 degree | Light slope |
5-7 degree | Light slope | 20-30 degree | Middle slope |
7-10 degree | Middle slope | 30-45 degree | Steep slope |
10-15 degree | High slope | 45-60 degree | High-steep slope |
15-20 degree | Steep slope | 60 and more degree | Cliffs |
20-40 degree | High-steep slope |
|
|
40 and more degree | Cliffs |
|
|
Steeper slopes have more value for geodiversity due to the unrelenting nature of erosional processes, we suggest that all types of landforms evolve in the direction of equalizing towards the sea-level surface according to the geographical cycle (Davis 1899). We describe this as a form of “geomorphological entropy” and suggest this justifies placing a higher value on cliffs and mountains. Moreover, steep slopes can be seen to form more dramatic landscapes with defined lookout points; specific elevation-dependent ecological sites with their unique communities; diverse stream networks; common landmass movement sites with open cliffs and outcrops; and more intense processes due to climate, weathering, and steepness and elevation. Additionally, we note here that mountains hold significant cultural and aesthetic value for many societies through history (Gossage 2008; Fearnley & Hersey 2018), as well as providing an important backdrop to the historical development of geological research and theory (Schaer 2010). We suggest elevation as a useful factor for assessment as well as correction of the slope mark. However, this is not within the scope of this initial study but should be included in further modifications of the method.
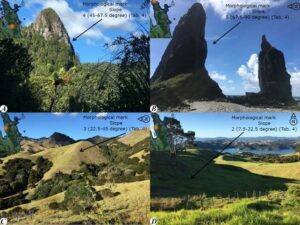
Figure 3. The variety of morphology of Coromandel Peninsula. A – one of Camel’s humps is a volcanic conduit of Rhyolite is demonstrate the high value of morphology, as a steep weathered cliff (Nevelshville, Coromandel Peninsula, New Zealand) (WGS 84: 175.659117; -37.188237), B - Sugar Loaf are two pillars of andesite rock, with nearly 90 degree slope (Fletcher Bay, Coromandel Peninsula, New Zealand) (WGS 84: 175.412924; -36.470640), C - Hilly area formed on the Mesozoic Greywacke with different types of nearly 45 degree slopes (Kirita Hill, Coromandel Peninsula, New Zealand) (WGS 84: 175.436965; -36.876089), D – the another part of hills of the same Greywacke, where slopes are more gradual (The road from Kereta to Manaia, Coromandel Peninsula, New Zealand) (WGS 84: 175.438123; -36.871195)
Table 6. Percentage of rock types exposed on Earth’s surface as function of geological age (Blatt and Jones, 1975). According to the table Extrusive and Intrusive rocks are the rarest, while Sedimentary rocks especially Cenozoic a the most common.
Eras | Crystalline | Sedimentary | No. of usable data points | |||
Extrusive | Intrusive | Metamorphic and “Precambrian” | Total | |||
Cenozoic | 4 | 0 | 0 | 4 | 33 | 290 |
Mesozoic | 2 | 1 | 1 | 4 | 18 | 177 |
Palaeozoic | 1 | 1 | <1 | 2 | 13 | 117 |
Precambrian | 0 | 6 | 15 | 21 | 1 | 173 |
Age unknown | 1 | 1 | 1 | 3 | 1 | 26 |
Total | 8 | 9 | 17 | 34 | 66 | 783 |
The age of rock is another way to weight the final mark of geodiversity in the rock type value. Here the oldest rocks are often lowest, according to Steno’s Laws of Superposition and Original Horizontality (Kelly & Thomas 2013) which make them the most unlikely to be exposed at the surface (Blatt & Jones 1975). While this gives the oldest rock the highest value, we can also use the table of abundance of rock types exposed on Earth’s surface according to their geologic ages (Table 6). Therefore, according to our arbitrary values, sedimentary rocks from the Cenozoic have a value of 1; sedimentary rocks from the Mesozoic a value of 2; metamorphic rocks from the Precambrian a value of 3; Paleozoic sedimentary rocks a value of 4; and all extrusive and intrusive rocks of any age a value of 5 (Table 4).
Volcanic diversity has a particularly high value for the Coromandel Peninsula, and we suggest it should be calculated separately from rocks and relief as a more precise combination of geological and geomorphological features (Suthren 1985; Cas & Wright 1988; White & Houghton 2006; Martí et al. 2018; Casadevall et al. 2019; Németh & Palmer 2019). Moreover, volcanic landforms can be studied separately, focusing on type of volcano (Fig. 4), rock material, (Fig. 5), and/or type of erosion (Fig. 6), and their age together with influence of historic and recent tectonic activities. In this way, a volcano can be seen not as an isolated facet in the collective assessment of territory, but the aggregate sum of all objects and evidence of processes. They can be mapped according to their stratigraphic units and facies distribution (Martí et al. 2018; Németh & Palmer 2019). Here we choose to concentrate on the dominant rock material distributed around the source of eruption, which can additionally be classified as a transporting agent and forming the environment of deposition and composition (Martí et al. 2018). Therefore, the main outcome is to clearly identify the eruptive unit and facies within the ring plane of stratovolcanoes and on outflow ignimbrite sheet for caldera-dominated systems (Martí et al. 2018; Németh & Palmer 2019).
Figure 4. Cliff of the volcanic caldera. Rhyolite eroded mostly by oceanic activities (physical and chemical weathering). (Hahei, Coromandel Peninsula, New Zealand) (WGS 84: 175.81513; -36.84298). The high of the person is 188 cm.
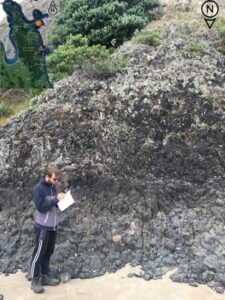
Figure 5. Outcrop on the beach. Columnar jointed basalt was influenced by oceanic and biological activities (physical, chemical, and biological weathering) (Opito bay, Coromandel Peninsula, New Zealand) (WGS 84: 175.811136; -36.722004). The high of the person is 168 cm.
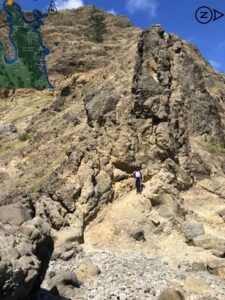
Figure 6. Erosional remnants of andesite volcano dome eroded by the power of gravity (an example of physical weathering) (Fletcher Bay, Coromandel Peninsula, New Zealand) (WGS 84: 175.40256; -36.47189). The high of the person is 168 cm.
For volcanic landforms in the Coromandel region, we use the description of volcano facies types (Wohletz & Heiken 1992). Remnants of Miocene-to-Pliocene andesitic-to-dacitic stratovolcanoes in the western and central parts are assigned a range of values for facies depending on composition and proximity to eruption centers: the Central Facies (0.5 to 2 km from central vents), which is close to volcano vents, is assigned the highest value of 5, as the source of lava flow and ash ejection and likely to contain nearly all original rock types. The scale is divided into increments of 1.5, with the next assigned value 3.5 for proximal facies (5 to 10 km from central vents); medial facies (10 to 15 km from central vents) a value of 2; and distal facies 0.5 (>10 to 15 km from central vents) (Table 7). Rhyolitic caldera complexes can be used for assessment of the eastern locations of the Coromandel Peninsula with Pliocene silicic calderas featuring dominantly in the landscape (Briggs & Fulton 1990; Adams et al. 1994; Malengreau et al. 2000; Nicholson et al. 2004; Smith et al. 2006; Booden et al. 2012; Hayward 2017). Rhyolitic caldera complexes have also been assigned a range of values based on facies: intra-caldera dome facies a value of 5 (with caldera diameter up to 20 km); intra-caldera fill facies a value of 3.5 (with caldera diameter up to 10–20 km); extra-caldera proximal facies a value of 2 (with caldera diameter up to 10–20 km); and extra-caldera distal facies a value of 0.5 (with caldera diameter 10–100 km) (Table 8). Additionally, general information about volcanoes will be calculated through the standard calculation of geological and geomorphological diversity and other main values, with facies recognizable through geological maps and photographs of the surface and supported by field surveys.
Table 7. Scale of volcanic facies of Subaerial Andesitic Stratovolcanoes. It is a useable scale for the assessment of young (active) volcanos.
Subaerial Andesitic Stratovolcanoes | ||
5 | Central Facies | · consanguineous dykes, especially those that are radial or randomly oriented · consanguineous sills that are concordant with moderate to steep initial dips · breccia pipes and stocks • hydrothermal alteration with steep lateral gradients · coarse agglomerates · thick, steeply banded siliceous lavas · coarsely stratified but poorly sorted tephra · steep initial dips · thin lava flows that are volumetrically subordinate to fragmental ejecta · ponded crater - and vent-fillings with sharply divergent cooling joints |
3.5 | Proximal Facies | · dominated by broad, thick lavas · intercalated coarse grained pyroclastics, poorly sorted pyroclastic breccias may be cut by consanguineous dykes • moderate to step initial dip |
2 | Medial Facies | · pyroclastics dominate over lavas · lahars with angular or subangular blocks up to 10 m or so in diameter · tephra layers with good sorting and grain sizes mainly in the lapilli to coarse ash range · zones of weathering and soil development (paleosols) between lava flows · clastic debris reworked by water · moderate to shallow dips |
0.5 | Distal Facies | · fine layered tephra with grain sizes in the range of coarse-to-fine ash, and with an outward increasing ratio of glass to crystals · lahars with blocks that rarely exceed a metre in diameter and have rounded or subrounded particles in their matrix · interlayered shallow-water sediments, soils, and organic debris · lava flows restricted mainly to isolated vents, basaltic sheets, and intra-canyon flows |
Table 8. Scale of volcanic facies of rhyolitic caldera complexes. This type of graduation is especially important for Coromandel Peninsula as it has 5 calderas in the central-east part of peninsula.
Rhyolitic Caldera Complexes | ||
5 | Intracaldera Dome Facies | · rhyolitic lava domes and short flows · autobreccia carapaces and aprons · near-vent pyroclastic falls · minor basalt scoria cones may be present |
3.5 | Intracaldera Fill Facies | · collapse breccias interbedded with ignimbrite · very thick crystal rich ignimbrites · co-ignimbrite lag fall breccias and interbedded epiclastics · lacustrine deposits |
2 | Extracaldera Proximal Facies | · interbedded, mainly thick, ignimbrite and airfall rhyolitic tuffs · minor rhyolitic domes · basalt scoria cones · welded centres · coarse lithic clasts |
0.5 | Extracaldera Distal Facies | · mainly un-welded ignimbrites with fine clasts · volcanogenic epiclastics |
Caves are included in the main values of geodiversity as they provide access to underground features and processes highlighting continual lithological diversity. Though caves are poorly studied in the Coromandel Peninsula, we can include them in this assessment as they can be located using topographical maps. Ideal information would relate to volume, type, and more detailed descriptions obtained through field surveys. As in previously described frameworks for assessments, we base this on a mix of geological, geomorphological and volcanological descriptions. Assigned values follow the same format as for rocks and slope, with the rarest type assigned the highest value. Types of caves were described by Davies & Morgan (1980) in their report about cave geology, created as an educational resource for earth science students. Provisionally, we assign a simple value system for caves as: lava tubes - 4, wind caves - 3, sea caves - 2 and solution caves - 1. We also note that some caves may hold significant cultural values for the indigenous population, with caves often used as burial sites by Māori (Gravis et al. 2017). Because of their tapu (sacred) nature we acknowledge that there may be undisclosed caves in our study area, and these would not be included in our assessment unless in partnership with local tangata whenua (indigenous people of the land).
In our study area, we can calculate the arithmetic average of the sum of marks of all caves. To meet the criteria of 5 as the highest mark, we include a coefficient of 1.25 in cases where the area being assessed has three or more caves. In addition, caves may have internal features such as stalactites, stalagmites, columns, drapery, cave pearls, and others that can only be assessed by a ground survey, with this being the case for volume as well. Presently we include them in the assessment of geodiversity according to their types, with future research proposed for a higher resolution assessment of caves and their contribution to geodiversity of the area.
Weathering, alteration, and mineralization of rock formations are assessed collectively as they all reflect different facets of erosional processes (McPhie 1993; Hack 2020). The three main types of weathering are biological, chemical (disintegration), and physical (decomposition). All these processes may act independently of each other, or in a complementary manner (Ng et al. 2001; Arıkan et al. 2007; Cabria 2015). In the Coromandel Peninsula, most volcanic landforms have been subject to intensive weathering from proximity to the seashore, where biological, atmospheric, and hydrological weathering are more intensive compared to continental areas. Additionally, underground hot springs influence overlying rock formations, which can lead to irreversible damage to their textural connection, making them unstable and fragile (McPhie 1993; Gifkins et al. 2005). Therefore, we consider this assessment valuable for our study area because of the large number of hydrothermally alteration processes (Hayward 2017). In our study, we concentrate on two types of assessments of weathering as described by Cabria (2015) and Hack (2020), one of which is simple according to ISO 14689-1:2017 and the other more complex (Table 9). We applied the simplest method as we consider it adequate for our initial assessment. Applying a scale of 1–3 we assign the following values: intact or fresh rock (0), discolored rock (1), disintegrated rock (2), and decomposed (3). For rock mass we assign a scale of 1–5 as follows: fresh (0), slightly weathered (1), moderately weathered (2), highly weathered (3), completely weathered (4) and residual soil (5).
Table 9. Weathering rate of Intact rock and Rock mass (ISO 14689-1:2017). The rate of changes can be easily recognizable during field observation utilizing this table as it connects to the colour, hardness, and stability of the rock mass.
Grade | Intact rock | Rock mass | ||
0 | Fresh | No visible sign of weathering/alteration of the rock material | Fresh | No visible sign of rock material weathering perhaps slightly discoloration on major discontinuity surfaces. |
1 | Discoloured | The colour of the original fresh rock material is changed and is evidence of weathering/alteration. The degree of change from the original colour should be indicated. If the colour change is confined to particular material constituents, this should be mentioned. | Slightly weathered | Discoloration indicates weathering of rock material and discontinuity surfaces |
2 | Moderately weathered | Less than half of the rock material is decomposed or disintegrated. Fresh or discoloured rock is present either as a continuous framework or as core stones. | ||
3 | Disintegrated | The rock material is broken up by physical weathering, so that bonding between grains is lost and the rock is weather/altered towards the condition of a soil in which the original material fabric is still intact. The rock material is friable, but the mineral grains are not decomposed. | Highly weathered | More than half of the rock material is decomposed or disintegrated. Fresh or discoloured rock is present either as a discontinuous framework or as core stones. |
4 | Completely weathered | All rock material is decomposed and/or disintegrated to soil. The original mass structure is still largely intact. | ||
5 | Decomposed | The rock material is weathered by the chemical alteration of the mineral grains to the condition of a soil in which the original material fabric is still intact, some or all of the mineral grains are decomposed. | Residual soil | All rock material is converted to soil. The mass structure and material fabric are destroyed. There is a large change in volume, but the soil has not been significantly transported. |
Alteration and mineralization have a high influence on weathering processes and the condition and appearance of rock. Alteration is a change in mineralogy and texture created by cold or hot aquatic solutions or gases, while mineralization is a process that changes the concentration of some chemical elements. Both processes can be driven by underground thermal activity heating up overlying rock formations, which can lead to irreversible damage to their textural and structural integrity, making them unstable and fragile (McPhie 1993; Gifkins et al. 2005). In volcanic areas, diagenetic and hydrothermal alteration can occur together, for example dissolution, replacement, and precipitation of minerals along the path of drainage. Assessment of these factors is valuable for the Coromandel Peninsula region (Fig. 7) because of the large number of hydrothermal processes that have taken place and resulting in hydrothermal alteration and mineralization (Hayward 2017). Epithermal mineral deposits have resulted in a significant history of mineral exploitation, with exploration and mining still taking place (Moore & Ritchie 1996; Christie et al. 2001; Piddock 2019). The next step in our assessment is to divide the areas influenced by mineralization and alteration from those only subject to weathering through surface processes such as weather, gravitation, and biological influences. We note an initial impression of the number of hot springs under rock formations as additional evidence of volcanic activities with a high impact on the geology and geodiversity values of our study area.
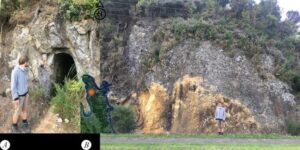
Figure 7. Hydrothermal alteration of andesite (Coromandel, Coromandel Peninsula, New Zealand) (WGS 84: 175.491980; -36.761419). A) Exit in the typical mine near Coromandel Wharf. B) Intense hydrothermal alteration of andesite rock near Coromandel Wharf. The high of the person is 168 cm.
Structural elements such as faults and folds are widespread in areas subject to tectonic processes, where they may influence landforms and weathering (Fossen 2016). Faults and folds in geological maps can show types and areas of influence. However, we consider it more useful to concentrate on the assessment of folds, as they can be more readily recognized in the field, while most faults may be missed on a map, due to small displacements at a scale of mm–cm (Barnes & Lisle 2013). The value of folds and faults can be calculated using the same numerical approach as for caves, calculating an arithmetical average for all types of faulting, and folding. According to “description of folds” (Fleuty 1964), we may observe features such as shape, altitude, and size, which may be measured in a field survey, butr we consider this beyond the scope of this initial assessment. Therefore, we will use a map for calculating fold values, while additional photographs will be used to support the result.
The typology of folds and faults can be scaled according accepted sequences from simple to complex types (Table 4). For folds, the scale is: symmetric (1), asymmetric (2), recumbent (3), overthrust (4), and nappe (5). We apply a similar scale for faults: normal (1), reverse (2), strike-slip (3), horst (4), and graben (5). Meanwhile, the length of the structural element will improve the accuracy of the final mark through its multiplication with the value for type. However, due to vegetative covering in the Coromandel Peninsula region, it is difficult to conduct on-ground surveys, leading us to concentrate on information from geological maps and indirect evidence. However future research could explore utility and practicality of LIDAR and other remote sensing methods for landscape scale investigation and assessment (Lo et al. 2021).
Soil type is one of the most complicated elements of geodiversity as it is formed by a combination of abiotic and biotic processes, and closely linked to biodiversity and ecological environment (Bétard & Peulvast 2019; Lausch et al. 2019; Rangel et al. 2019; Stavi et al. 2019; Fossey et al. 2020; Reverte et al. 2020; Santos et al. 2020; Zaady et al. 2021). Here we use a similar framework as for rock assessment; to assign a scale allowing assessment of soil-types according to uniqueness and rareness. However, this does require a precise analysis of New Zealand soils, especially on the Coromandel Peninsula. We suggest the main issue in soil categorization is the range of classification systems that may differ from country to country. For example, the United States uses three different systems with variations in levels of assessment. The United States Department of Agriculture (USDA) uses a system based on particle size distribution and is the most used method. The American Association of State Highway and Transportation Officials (AASHTO) uses a more accurate and complex system focusing on soil plasticity factors making it most useful for state and county highway departments. Finally, the Unified Soil Classification System (USCS) uses aspects of the previous systems, and includes liquid limit and organic matter concentrations, and is generally only used by geotechnical engineers (García-Gaines & Frankenstein 2015).
New Zealand uses its own classification system, initially based on aspects of the USA systems, and then improved by scientists due to the uniqueness of our territory and genesis processes (Hewitt 2010; Lausch et al. 2019). Additionally, the Food and Agriculture World reference base for soil resources (FAOWRB) is a globally recognized soil classification system that can be used for assessment and gradation of all soils as it is common for all countries. FAOWRB is based on three general principles: diagnosis of horizons, properties, and materials. It is considered the more acceptable system as it includes all soil types found throughout the world. Soils can also be assessed according to their age. Moreover, New Zealand soils have a specific genesis resulting from volcanic activities, which can create soils as a sequence of young soils buried under tephra’s (Gibbs 1980). A difficult decision is whether to concentrate on the topsoil profile or the sub-surface horizons as well. Considering all the previously discussed issues, we have simplified our assessment for this initial stage of our research. Each assessment grid territory will be assigned a value based on number of soils on the chosen area with the highest mark of 5 assigned to the highest diversity of soil types in the assessed territory. We suggest for further research the FAOWRB would be considered the most useful resource.
Example of the Assessment
According to a study of human visual abilities (Krisciunas & Carona 2015), human eyes can distinguish a candle flame from 2.6 km at night. Therefore, we will divide the study area into 6.25 km2 which will be adequate for our purposes as all objects of observation can be distinguished in the field without the aid of additional devices. However, distance and scale of geodiversity assessment can be changed because of the relief of the territory. Our principal goal for this initial research is to create a practical and useful framework providing significant results able to be confirmed by ground truthing.
To assist our assessment, we use the free software GRASS GIS (https://grass.osgeo.org/) and QGIS (https://qgis.org/en/site/), while mapping data is used as a general source of information. However, we acknowledge this will be adequate only for assessing the main values of geodiversity as previously described. The detailed sequences of calculation are presented below step by step to demonstrate the process in a manual environment using computer tools and electronic maps:
For a database we use a horizontal vector map (in .shp format). This map provides enough information for morphological assessment (Cherlinka et al. 2017). GRASS GIS has sufficient tools to create a slope map and divide it into segments according to the degrees scale (Table 4; Fig. 8) presented in the previous section.
For rock assessment we need a geological map (in .shp format) of the territory together with information about rock ages. This information can be used to calculate the area of rock using QGIS or GRASS GIS. Additionally, QGIS can be used to create a vector file with polygonal lines with different rock types according to the scale in case we have only a raster (.tiff format) map (Table 4; 8).
Caves are visible on the topographic map; therefore, these sites can be added with QGIS into our model as points associated with information on cave type. This information is sufficient for this initial broad stage of assessment until we can obtain more detailed information.
Figure 8. Example of Slope and Geological models for geodiversity assessment. Slope was created from SRTM 1-Arc-Second Global and Geological model from GNS 1:250,000 Geological Map of New Zealand (QMAP).
Soil maps are used to assess soil diversity by counting the number of discrete soil types (Cherlinka et al. 2017). We acknowledge this as a very broad assessment, and future work may develop a higher resolution scale according to types, thereby laying the foundation for a high-resolution framework for assessment of soil diversity in the context of the overall assessment of geodiversity.
The methodology we have outlined is proposed as an initial baseline for geodiversity assessment, with further research suggested that will highlight areas of improvement. By describing our system and demonstrating our methodology, we hope to have opened a door towards future research, observations, and improvements in the assessment system and its associated scales.
Conclusion
Geodiversity is a relatively recently established field of study, now growing and subject to additions allowing a holistic and systematic description of the whole of abiotic nature. In our discussion we demonstrated how the current paradigm can be broadly divided into two parts. The first contains major elements of geodiversity, described as the general body of abiotic nature such as rock formations and surface morphology, while the second part is more process based and includes elements such as climate, hydrology, biology, and humanity that influence and alter the former elements. We also demonstrated a basic methodology of geodiversity assessment, based on a 5-point system, where 1 is the lowest rate and 5 is the highest.
We suggest further research to refine this methodology for assessing geodiversity of the Coromandel Peninsula based on the previously described system. This will highlight potential improvements for our methodology; refine accuracy of the grading system; and allow application to other territories in New Zealand, and ultimately globally. This will facilitate the development of a system applicable to any type of region and its associated landscapes and abiotic environment. Subsequently, this will provide information for a readily accessible database able to be applied to geoeducation, geotourism, and geoconservation projects.
Acknowledgment
We thank Massey University for PhD Scholarship funding supporting for this research.