Introduction
Overview of Concepts
Geodiversity, geoheritage and geoconservation are interrelated concepts with distinctly different meanings and applications. Geodiversity is defined by Gray (2013) as “the natural range of geological, geomorphological, soil and hydrological features and more broadly includes its assemblages, structures, systems and contributions to landscapes”. The assessment of geodiversity is a recent endeavour in the geosciences and is concerned with the evaluation of abiotic diversity (Forte et al. 2018). Geoheritage is used to describe the importance (Díaz-Martínez, 2011) or quality (Pellitero et al. 2015) of the site and is the process of determining whether geodiversity has significant scientific, educational, cultural or aesthetic value (Díaz-Martínez, 2011). The assessment of geoheritage is further broken up into multiple steps: an assessment of scientific values, added values, followed by an assessment of vulnerability, threats and risks to the site (Kubalikova 2013). The concepts ‘geodiversity’ and ‘geoheritage’ and their assessment, have been recognised as distinctly separate research domains (Brilha 2015). Geoconservation is an action (Prosser 2013) with the intent of conserving geodiversity for its intrinsic, ecological and geoheritage value (Sharples 2002). A geoconservation site, through an established process, the geoconservation strategy, is a site deemed worthy by the relevant authorities to achieve conservation status (Seijmonsbergen et al. 2009). There are several successive steps involved in listing a geoconservation site: inventorying, qualitative or quantitative assessment using various methodological approaches (e.g. ranking techniques), conservation, interpretation and promotion (Brilha 2005). The inventorying stage is comprised of several steps that endeavour to ‘identify’ and ‘rank’ geosites based on their geoheritage and significance criteria values. Geosites that do not comply with the established criteria are typically not deemed worthy of being listed for geoconservation purposes (Brilha 2015). Therefore, from these initial assessments and ranking, the site’s conservation, interpretation, and promotion can be achieved (Brilha 2015, 2005).
We are in the midst of a sixth mass extinction (Leakey and Lewin 1996; Payne et al. 2016; Ceballos et al. 2017), evidenced by widespread environmental destruction and loss of habitats. Successful measures to avert this catastrophe rest on dramatically increasing and improving conservation efforts (Ceballos et al. 2015). Geoconservation is limited by the concept of ‘geodiversity’ which still has a marked conceptual weakness and is passing through a stage of methodological development and consolidation (Serrano and Ruiz-Flano 2007; Soms 2017). Achieving geoconservation outcomes are probably further hindered by the separation of geodiversity assessment from geoconservation strategies (Brilha 2015). When geoconservation outcomes have been achieved, landforms, geological features, and soils (geodiversity) have been successfully protected using established methodologies, such as the multi-faceted and sometimes subjective steps used in geoconservation strategies.
Decision making and processes in the environmental sciences are multi-faceted requiring the synthesis of a multitude of datasets, multiple stakeholders and sometimes subjective methodologies (Linkov et al. 2004). Similarly, achieving geoconservation outcomes is a multi-faceted endeavour requiring sometimes subjective methodologies (White and Wakelin-King 2014), disparities in geoconservation strategy steps (Brilha, 2015), and multiple output datasets from separate assessments. The different steps in geoconservation strategies requires using a variety of tools and methods to facilitate geoconservation outcomes; inventorying methods have been developed independently of geoheritage assessment methods and by extension geodiversity assessment methods (Brilha 2015), and therefore a range of separate methods and tools have ensued in geoconservation. Therefore, consolidating and streamlining existing methodologies may help to overcome some of the subjectivities and disparities in geoconservation strategies. Consider De Lima et al. (2010) who suggested that additional assessments in geoconservation strategies should be done at the same time as the geological assessment by the same team, and Crisp et al. (2020) who identified that mobile GIS applications could be used to unify geodiversity assessment methods with geoheritage and inventorying protocols to better facilitate and streamline geoconservation outcomes. This study furthers that objective by using the three ArcGIS mobile apps QuickCapture, Survey123 and Explorer to consolidate the geoconservation strategy steps inventorying and geoheritage assessment, with quantitative geodiversity assessment.
Mobile GIS Applications
Use of digital applications in conservation efforts has gained momentum and are now shaping conservation discourses and practices (Arts et al. 2015). The implementation of these technologies facilitates clear benefits to conservation science and its management (Arts et al. 2015; August et al. 2015; Pettorelli et al. 2014). For example, the digital applications ameliorate workflows, data accuracy and quality, and facilitate high standards in research results (Nowak et al. 2020). Further, the use of Geographic Information Systems (GIS) in mobile applications may provide significant reductions in cost and time (Iscan and Guler 2020), allowing data collection, monitoring and analyses to be simplified (Akhmetov and Aitimov 2015). Furthermore, digital applications facilitate improved data management capabilities, information access, visual representations and evidenced based decision-making (Arts et al. 2015).
Some benefits of mobile GIS applications are also evident in geoheritage, with some scholars having previously developed and proposed new innovations for each state of the heritage management process. Fieldwork and the integration of results have previously been merged in current geoheritage methods using available GIS technologies (Cayla et al. 2014; Martin et al. 2014). The identification, assessment, mapping, and communication of spatial information are now being facilitated and improved by using mobile GIS applications (Ghiraldi et al. 2010; Gallerini et al. 2011; Cayla et al. 2012, 2014; Martin et al. 2014). GIS and web-mapping technologies have facilitated the ‘communication’ of spatial information by developing geoheritage data visualisation interfaces (Gallerini et al. 2011; Martin et al. 2014). Virtual field trip (Cayla et al. 2012) technologies have facilitated the ‘identification’ and digital field mapping tools have facilitated the ‘mapping’ of information in the field (Gallerini et al. 2011; Ghiraldi et al. 2010; Martin et al. 2014). These technologies have assisted the steps to understand, preserve and enhance geoheritage protocols.
Geographic information systems have been described as some of the best tools for geodiversity assessments (Yongxin 2007), and by extension geoheritage management. Many multi-purpose mapping applications for mobile devices have emerged to facilitate open source spatial analyses and field surveys (Fan et al. 2019; Jolma et al. 2008; Nowak et al. 2020). ArcGIS Online is a recent and popular tool facilitating the storing of spatial data, creation of workspaces, spatial analyses, and the creation of maps (Nowak et al. 2020). One of the core tools driving the popularity of ArcGIS Online is its ability to create workspaces that are compatible with multiple mobile applications researchers and conservationists can utilize in the field (Nowak et al. 2020). Examples of common mobile applications compatible with ArcGIS Online are ArcGIS Collector, ArcGIS Survey123, ArcGIS Explorer, ArcGIS QuickCapture, ArcGIS Navigator and more. Scholars in other disciplines have previously used ESRI ArcGIS mobile applications to facilitate their own research objectives. For example, Jordan et al. (2019) utilized the ArcGIS Survey123 app to collect sociological data on tourism host community resident stress levels, and Lindsay (2014) proposed the benefit of mobile GIS apps to improve the efficiency and accuracy of fieldwork data collection in the field of archaeology. Lindsay and Kong (2020) subsequently developed a site survey workflow tool based on ESRI’s ArcGIS Collector mobile app to streamline the capturing and storing of settlement survey data in Armenia.
Tasmanian Geoconservation Database Case Study and Mobile GIS Technologies
Many agencies that manage geoheritage have developed their own online GIS tools and systems (Cayla et al. 2014). This case study considers Tasmania, Australia, one of the earliest places in the world to develop the geodiversity concept (Kiernan 1996; Kiernan 1997; Sharples 1993). Oracle database software is used to combine both textual and spatial data into a single database called the Tasmanian Geoconservation Database (TGD). The TGD information contained in the database is then housed in the Natural Values Atlas (NVA), a web-based system for providing access to published information on natural values (https://www.naturalvaluesatlas.tas.gov.au/) (Comfort and Eberhard 2011). An online web interface, The Land Information Systems Tasmania (TheLIST), was developed to help users locate and find relevant information. TheLIST layer, geoconservation sites, is directly linked to the TGD which is an integrated GIS database of the state’s geodiversity and is a central repository for the storing of geodiversity information (Houshold and Sharples 2008) to assist land managers in the management of identified values. The TGD is facilitated and further developed by the Geodiversity Conservation and Management team at the Tasmanian Department of Primary Industries, Parks, Water and Environment (DPIPWE) (Comfort and Eberhard 2011), with more refinements (DPIPWE 2016) that are still required (Table 1).
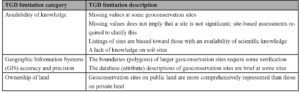
Table 1. The limitations and prospective refinements to be made to the Tasmanian Geoconservation Database (DPIPWE 2016).
Consolidation using digital technologies has been a continuing trend in the establishment of the TGD used today (Fig. 1). Prior to the establishment of the TGD, there were about 12 comprehensive geological inventories associated with Tasmania’s geodiversity. For example, in 1979, the Geological Society of Australia (GSA) published a report entitled Geological Monuments of Tasmania, prefatory to contemporary TGD processes used today (Eastoe, 1979; DPIPWE, 2016). However, the establishment of the first TGD enabled the consolidation of all 12 inventory documents or reports into one single digital database to facilitate geoconservation management in Tasmania; attribute information and spatial information were still separate. The attribute information was stored in a Microsoft Access Database, and spatial information was stored in an Oracle database (Fig. 1). Following a subsequent TGD system restructure, Oracle software was used to combine attribute and spatial data into one merged system now called the NVA (Comfort and Eberhard 2011). This provided more resourcing to facilitate fieldwork opportunities at existing or prospective geoconservation sites (Comfort and Eberhard 2011). Therefore, current trends have used digital technologies to consolidate and streamline the storage, representation, and accessibility of geoconservation information on databases, the TGD (Fig. 1). In this study we propose augmenting current consolidation approaches by further consolidating online databases with in-field processes, namely geoconservation strategies and quantitative geodiversity assessment methods, which are methods used to evaluate or quantify the number or diversity of geological elements in nature (hereafter referred to as ‘geodiversity assessment’).
Through digital coalescence, the simultaneous use of ArcGIS mobile applications, we demonstrate the viability of a unified toolkit (hereafter, the ‘geoconservation toolkit’) in facilitating geoconservation outcomes. Review of the TGD as a case study indicates the viability in using digital tools to consolidate online databases with geoconservation strategies and geodiversity assessment. For example, even though information is now accessible in one location, some relevant values are still missing from geoconservation sites with many biases toward scientific values, attribute descriptions that are vague and brief, and many site boundaries still requiring verification (Table 1). Acquiring the information to update online databases, or list new geoconservation sites, is acquired from established geoconservation strategies such as inventorying and geoheritage assessment. Further, the output value from geodiversity assessments representing the quantity of hydrological, soil and other geodiversity elements (hereafter referred to as ‘geodiversity’) (Table 1), are considered a separate research endeavour from geoconservation strategies (Brilha 2015). Therefore, we propose that through digital coalescence, geoconservation outcomes can be further consolidated by unifying geoconservation strategies with quantitative geodiversity assessment.
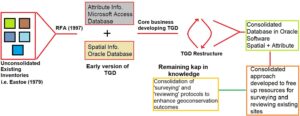
Figure 1. Consolidation trends in the establishment of the TGD. The Regional Forest Agreement in 1997 stimulated the first consolidated TGD database. Subsequently, a TGD restructure further consolidated the TGD to include both spatial and attribute information.
Review shows that consolidating geoconservation outcomes using digital tools may help to overcome current limitations in geoconservation strategies. For example, Brilha (2015) highlights that inventories of geodiversity are dynamic and readily change with advancements in scientific knowledge, with geosites losing or gaining geoconservation status with the discovery of new geological phenomena. The proposed geoconservation toolkit could facilitate more rapid and streamlined inventorying of geosites. With more than 1000 geoconservation sites listed on the TGD, it is evident that a streamlined approach using digital technologies could be used to expedite inventorying of geoconservation sites. In assessing the value of geodiversity (hereafter referred to as ‘geoheritage assessment’), White and Wakelin-King (2014) highlight that there is a miscellany of subjective and conflicting geoheritage criteria constraining the identification of relevant values of geodiversity. For example, the criterion integrity in the geoheritage assessment method considers the state of conservation of a site based on a scale of zero to one, with zero indicating destroyed and one indicating intact. Conversely, method considers only the preservation status of essential geodiversity elements on a scale of zero to one, with zero indicating not preserved, and one indicating intact. There are numerous other examples in the literature of varying geoheritage assessment criteria assessing the same values subjectively. A systematic approach was recommended by Brilha (2015) to overcome the misuse of terminologies and conflicting criteria in geoconservation strategies, namely geoheritage assessment. A geoconservation toolkit approach would facilitate compiling existing geoheritage assessment criteria into a field-app for the user to systematically select relevant criteria to implement at the geosite in question (hereafter referred to as ‘Suitability Analysis’). The primary objective of geoconservation strategies is to identify, protect, and manage valuable geodiversity (Brilha 2015), and yet geoconservation strategies and the assessment of geodiversity remain separate endeavours.
As demonstrated in this study, digital applications (hereafter referred to as ‘ArcGIS apps’) provide opportunities to bridge the gap between geoconservation strategies and geodiversity assessment. This is because there are now many commercial mobile apps facilitating location-based data collection, attribute collection and enhanced data storage, processing, and presentation. Commercial apps such as ArcGIS are now offering significant versality in their implementation across various disciplines. For example, the commercial ArcGIS app Survey123, offers significant customisability and an in-field user interface to suit the objectives of multiple research endeavours, in this case unifying geoconservation strategy steps and geodiversity assessment into a workable geoconservation toolkit approach. Therefore, there is considerable viability, hence the recent uptake (Filocamo et al. 2020; Pál and Albert 2019; Pica et al. 2018; Williams and McHenry 2020), in adopting mobile ArcGIS applications to facilitate geoconservation outcomes in Tasmania and potentially elsewhere. Many mobile apps have been developed to suit the objectives of individual research projects (Nowak et al. 2020), and different ArcGIS apps although versatile are comprised of distinctive functionalities. For example, AcrGIS QuickCapture is an app built to facilitate the rapid collection of field observations, and ArcGIS Explorer provides in-field access to pre-established digital maps. And ArcGIS Survey123 is an app facilitating field data collection through the creation, sharing and analysis of surveys. Therefore, we demonstrate the feasibility of combining these apps to unify geoconservation strategies with geodiversity assessment to produce a geoconservation toolkit. Further, mobile GIS technologies allow the acquisition of more complex attribute information, validation of geoconservation boundaries and the identification and replacement of missing values. For example, mobile apps can aid in acquiring missing data or eliminating human error by providing users with predefined values to be entered directly in the field (Davidovic and Stamenov 2011). Further, spatial locations of individual geological elements are currently absent from the TGD, and geospatial data locations are paramount in facilitating better analysis, decision making and management in the environmental sciences (Davidovic and Stamenov 2011). Mobile GIS applications allow precision of geospatial data acquisition in the field (Davidovic and Stamenov 2011). and site data sampling by mobile GIS apps can provide more accurate descriptions of objects of interest.
Objective
This study trialed the simultaneous implementation of three ESRI ArcGIS mobile applications QuickCapture, Survey123 and Explorer to close the current separation between quantitative geodiversity assessment and the geoconservation strategy, in a bid to consolidate geoconservation outcomes. This consolidated approach forming a ‘geoconservation toolkit’, was implemented at three north-west Tasmanian coastal geoconservation sites as a case study. The TGD on the NVA was also used as a case study to show how mobile GIS applications could potentially benefit all existing geoconservation inventories and assessments globally.
Materials and methods
Study Sites
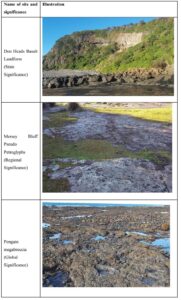
Coastal areas are usually high in geodiversity (Brocx and Semeniuk 2009, 2010). Yet studies assessing geodiversity in these coastal environments are uncommon (Crisp et al. 2020). Therefore, three Tasmanian coastal geoconservation sites were selected for the implementation of the geoconservation toolkit. To demonstrate the versatility of the proposed toolkit, all three geoconservation sites were of varying degrees of significance, geological type, representative values, scale, or relative age.
Don Heads Basalt Landform (State Significance)
The Don Heads Basalt Landform geoconservation site (444007E, 5443266N) is located adjacent to the city of Devonport (445268E, 5442112N) on the north-west coast of Tasmania, Australia (Fig. S1). The geographical significance of the site has been identified at the state level (DPIPWE 2019). The site was selected for this study given its high education potential and proximity to a senior secondary college (Bradbury 2012). The site is also of significant potential tourism value given its proximity to the only Spirit of Tasmania ship terminal in Tasmania. The site, an identified geological monument, was described by Eastoe (1979) as an excellent example of coastal landforms and basalt flow phenomena. Contiguous basalt flow phenomena have been observed further west (44080E, 5443195N) at Lillico Beach (Quilty et al. 2014). Given the site’s broad range of potential geoheritage values and significant geological phenomena, it was deemed suitable for the implementation of the toolkit.
Mersey Bluff Pseudo Petroglyphs (Regional Significance)
The Mersey Bluff Pseudo Petroglyphs geoconservation site (445923E, 5443376N) in Devonport, Tasmania, is located a few hundred meters from the popular tourist destination, the Bluff beach (Fig. S2). The site was selected for its significant cultural and tourism potential. At the site, a range of dolerite rock carvings are once believed to have been carved by Tasmanian Aborigines, however, these carvings are more recently considered to be the result of distinctive root weathering on curviplanar joints (Bradbury 1994). Further, there were no Aboriginal tribes believed to have inhabited the Mersey Bluff area (Plomley 1993). Despite the uncertainty around the origin of the petrogylphs, the site still exhibits significant cultural and tourism potential given the presence of the oldest Aboriginal operated museum in Australia, Tiagarra. Therefore, given the site’s cultural and tourism potential it was deemed suitable for the implementation of the toolkit.
Penguin Megabreccia (Global Significance)
The Penguin Megabreccia geoconservation site (423193E, 5447989N) is situated less than one kilometer from the main tourist attraction centers of Penguin (Fig. S3). Situated close to Penguin are notable examples of coastal geology; Goat Island (426754E, 5447368N), Penguin Point (425967E, 5447712N), Ladders Point (426835E, 5447019N), Tea Tree Point (424571E, 5447749N), Surf Club Point (422440E, 5448161N) and the Three Sisters Islands (426771E, 5447328N) located only 300m from the coastline. Therefore, this site was also selected for its potential to exhibit high aesthetic value. The megabreccia has previously been described as an ‘unusual’ phenomenon expressing the post-collisional, Middle-Late Cambrian extensional phase of the Tyennan Orogeny in Tasmania’s geological past (Bradbury 1994; Seymour and Vicary 2010), which is an example of the earliest phases of Gondwanan orogenesis (Moore et al. 2015). Therefore, the site probably exhibits some scientific value potential. Penguin was previously identified as a suitable location between 2005 and 2008 for the development of multi-storey beachfront buildings. However, developments were circumvented by listing existing properties as heritage-listed sites. Therefore, this site was also selected for its potential to exhibit high conservation value.
Data Collection and Arcgis Explorer
Geological phenomena were noted using a novel randomised observation-based approach, or otherwise a site reconnaissance approach, where the sites were explored on foot while simultaneously collecting geological information without adhering to established transects. Given the variability in the shape of boundaries, following a transect might have meant that some geological phenomena were missed or unintentionally overlooked within each geoconservation boundary. However, existing inventories on the TGD were used as a guide to identify notable features at each geoconservation site and such features were captured with the toolkit. To overcome potential navigational barriers in the field such as adhering to and remaining within the geoconservation boundaries, the ArcGIS Explorer app was used. The Explorer app displays a real-time location in the field relative to the boundaries. The ArcGIS Explorer app also provided the associated attribute information for each feature.
Consolidation One: Validation Boundaries
The boundaries of some larger geoconservation sites still require validation (Table 1). Through digital coalescence, the simultaneous use of all three ArcGIS mobile applications, site boundaries were validated while also collecting geodiversity, inventorying and geoheritage data. Shapefiles of validation boundaries were created using the ArcGIS Online platform. Validation boundary shapefiles were established by using aerial imagery, and by identifying geological features or landforms located outside of the existing geoconservation boundaries. ArcGIS Explorer facilitated in-field viewing of the validation boundaries and subsequent amendments where required.
Consolidation Two: Determination of Suitable Geoheritage Criteria
A comprehensive list of existing criteria used by geoheritage scholars was compiled by carrying out a literature search of current geoheritage assessment publications in Scopus (Table S2). The search to pinpoint relevant literature containing the criteria was refined by using the inbuilt advanced search functionality tools (Table S1). The Scopus search returned 130 articles, but only 80 were used to find currently used criteria. The 50 excluded articles were irrelevant, unable to be accessed or did not contain geoheritage assessment criteria. Finally, a total list of 130 existing geoheritage assessment criteria was compiled and subsequently used in the geoheritage assessment. The suitability or relevance of geoheritage criteria for the assessment of the site was determined using five disparate ranking standards (Fig. S4).
Relevance of the criterion to the geoconservation site was used to eliminate irrelevant criteria. Rarity of the criterion was used to distinguish frequently from seldom used criteria by tallying each criterion. The logic was that frequently used criteria were based on the experts’ opinion given their repetitive use in scholarly articles and so were probably suitable to implement at most geoconservation sites. Relevance of the criteria to existing TGD protocols was considered to select criteria relevant to or currently used by industry professionals at DPIPWE to list geosites. This ensured that the rapid geoheritage assessment method adhered to and supplemented existing TGD protocols. To support the rapid geoheritage assessment approach, a standard entitled replicability of the criterion was established. This standard ensured that criteria were selected that were not time-consuming or difficult to implement. For example, the criterion vicinity to urban networks would rank lower in this standard than the criterion integrity given that the former would require a step to determine the geographic position of the site to other towns and cities. And finally, the standard relevance of criteria to the grouped values was established to rank criteria associated with relevant values higher than those associated with irrelevant values. For example, at a site where scientific value is of higher relevance than all other values, the associated criteria with this value were more likely to be selected to assess the site given its higher-ranking value.
Consolidation Three: Inventorying
Inventorying was facilitated by using the standalone desktop version of Survey123 Connect. The survey was generated based on the inbuilt Advanced XLSForm template. The inventorying approach was developed based on the inventorying method set out in Brilha (2015). Step 1 (Fig. S5A) is the first tab available to users and is the first stage of the inventory process. An area classification was first allocated based on the size of the geosite, followed by an allocation of site type (Fig. S5B). The site type allocated determined which criteria were used to complete the inventory (see Brilha 2015). The first step also required that a literature review of the study site be completed. Relevant criteria will not appear in the inventory for evaluation unless Step 1 has been answered as ‘yes’. Subsequently, the criteria for the inventory were ranked from one to four (Fig. S5C).
Consolidation Four: Geoheritage Assessment
Geoheritage assessment was facilitated by using the standalone desktop version of Survey123 Connect. At the top of the home page (Fig. 2A), an image of the proposed suitability analysis (Fig. S4) was provided to guide the selection of relevant criteria to be used to determine site significance and rank geoheritage criteria. In step one of the app, relevant values were selected (Fig. 2A). Subsequently, selected values and their associated criteria (Table S2) were appended to the lists in Survey123 as step two (Fig. 2B). The suitability of each criterion was then ranked from 0 – 10 using the provided suitability approach (Fig. S4). Criteria with a score of nine or ten were then used in step 3 of the geoheritage assessment (Fig. 2C) to determine the overall significance of the site. The levels of significance used were based on those proposed by Sharples (2003) and currently used by DPIPWE (2018) on the NVA. The method of determining site significance was based on the approach used by Grove et al. (2015) where highly relevant criteria or values (a score of nine or ten) were given a rank from Sub-Regional to Global. Following the determination of site significance, relevant geoheritage criteria were then ranked from 0 – 4 (Fig. 2D) and the results were averaged to determine overall scientific, touristic, educational, and cultural value. The ranking of criteria to determine geoheritage significance has been widely adopted by many scholars (Bruschi et al. 2011; Rovere et al. 2011; Ovreiu et al. 2019).
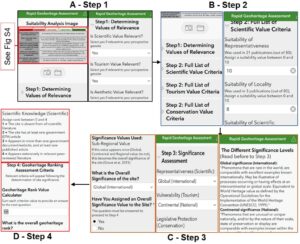
Figure 2. The four steps established for a rapid geoheritage assessment in ArcGIS Survey123. Upon opening Survey123 on a mobile device the user is presented with the Suitability Analysis Image to determine the suitability of criteria. A) The appropriate values of relevance for the site were determined. B) Criteria within each selected value (Step 1 – Geoheritage Values) were ranked from 0 to 10 based on the suitability analysis image. C) All criteria with a rank of nine or higher were selected for the significance assessment in Step 3. Each criterion was assigned a significant value and then an overall significance value was subsequently determined. D) Criteria were ranked from 0 to 4 based and then an overall geoheritage rank value was determined.
Consolidation Five: Calculation of Geodiversity
The geodiversity assessment approach used in this study was developed based on the Serrano and Ruiz-Flano (2007) geodiversity index formula, a widely implemented approach by other scholars (Pellitero et al. 2011; Manosso and de Nobrega 2016; Chelariu and Hapciuc 2017; Kaskela and Kotilainen 2017; Ozsahin 2017; Perotti et al. 2019).
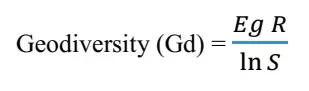
The geodiversity index formula proposed by Serrano and Ruiz-Flano (2007) is as follows:
Geodiversity (Gd) =
(1)
where Eg = Count of different geodiversity elements, R = roughness coefficient and S = surface area of site of interest (km2)
The Serrano and Ruiz-Flano geodiversity index was implemented at each study site (Serrano et al. 2009). This approach was deemed suitable as it facilitated the geodiversity assessment of territories containing various characteristics. This approach also facilitated the comparison of geodiversity between territories and different geographical areas. The parameter Eg was determined by counting the points captured by the feature class Geodiversity Index Point in the ArcGIS QuickCapture software. The parameter Eg was determined by counting the physical elements as lithology, geological structures, geomorphology, morphostructures, erosional landforms, hydrological, pedological and the presence of micro-landforms of interest. Repetitions of physical elements were not counted. To calculate R, digital elevation models (DEMs) in raster format (.tif) were extracted from the website ELVIS-Elevation and Depth – Foundation Spatial Data <https://elevation.fsdf.org.au/>. A polygon was drawn around each area of interest (Figs. S1, S2, S3) on the website, and 1 meter DEMs were subsequently downloaded and imported into ArcMap software. The raster DEMs were converted to slope values using the inbuilt Slope (3D Analyst) tool. The dominant slope was determined by using the average of the slopes calculated in ArcMap, the average slope was then used to determine a roughness value (Table 2). Surface area (S) was determined by using the calculate geometry tool in ArcMap. The output Gd values from Survey123 for each boundary were then categorized into respective geodiversity classes (Table 2). The R value is used as a proxy of the surface roughness of the area at each site. The null hypothesis is that when the surface is rougher there is higher variability of landscape elements, and hence geodiversity increases. The determination of roughness values from a DEM was associated with the first inventorying step for each site, the literature review.
Table 2. Designation of specific roughness values based on dominant slopes and categorization of geodiversity based on the output
Roughness values (R) | 1 | 2 | 3 | 4 | 5 |
Slopes (o) | 0 – 5 | 6 – 15 | 16 – 25 | 26 – 50 | >50 |
Geodiversity (Gd) | Very Low | Low | Medium | High | Very High |
Values | <15 | 15 – 25 | 25 – 35 | 35 – 45 | > 45 |
Consolidation Six: Geodiversity Assessment Using QuickCapture and Survey123
In ArcGIS Online, relevant point feature layers were initially created for subsequent importing into AcrGIS QuickCapture. The point features were entitled ‘Geodiversity index point (ER)’, Geological structures’, ‘Erosion/accumulation landforms’, ‘Landform’, ‘Soil and stratigraphy’, ‘Pedological’ and Hydrological (Fig. S6A-B). To facilitate ‘rapid’ capturing of data in the field a description attribute was the only field required to be populated. However, to ensure that descriptions remained consistent across each captured feature, a hint was provided underneath each field. For example, a description of type, classification, represented ages, color, grain size and flow characteristics was required for each geological structure point (Fig. S6C). In Survey123 the geodiversity assessment data was configured to request data based on the number of geoconservation or validation boundaries (Fig. S6 D-F). For example, a site with one validation and one geoconservation boundary would require an R1, Er1 and S1 value to be populated for the geoconservation boundary (Fig. S6E), and one R1, Er1 and S1 value for the validation boundary (Fig. S6F). Further, a site with two geoconservation boundaries required the population of an R2, Er2 and S2 value; these values would increase depending on the number of boundaries. Furthermore, the calculation of geodiversity was automated in the Survey123 field app by using the calculate tool in the XLS Form function in the preliminary stages of constructing the app. At this point, using Survey 123 and QuickCapture the inventorying, geoheritage assessment and geodiversity assessment were amalgamated and streamlined into one ‘toolkit’.
Results
Site Reconnaissance
The photograph at the Don Heads Basalt Landform site shows the Don Heads Tertiary basalt headland and cliff (443899E, 5443552N) (Table 3). The photograph at the Mersey Bluff Pseudo Petroglyph site shows exposed dolerite atop the Mersey Bluff headland (445806E, 5443308N), where some of the pseudo-petroglyphs are situated (Table 3). The photograph at the Penguin Megabreccia (423025E, 5448032N) site shows an outcropping platform of Beecraft Megabreccia, and various other rock types in a sedimentary matrix representative of a deposit close to the foot of a Cambrian escarpment (Bradbury 1994) (Table 3).
Table 3. Photographs of three coastal study sites from each site reconnaissance
Geodiversity Assessment Data
Site 1 showed the highest geodiversity compared to other sites, with a value of 43.7 (Table 4) (Fig. 3). Given the high ER, S and R value in the validation boundary at Site 1, there is evidence to suggest that the two existing geoconservation boundaries (G1-2) could be amended on the TGD (Fig. S1). Further, the value of geoheritage at Site 1 ranks the highest for scientific and educational value, followed by tourism and conservation (Fig. S10). Site 2 has the lowest geodiversity compared to the other coastal sites, with a value of 1.22 (Fig. 3). The validation boundaries at site 2 are quite dissimilar to the existing G1 boundary. Interestingly, V1 has the highest ER count at the site, and therefore, there is evidence to suggest V1 and G1 could both be reflected in the TGD (Table 4)(Fig. S2). A further assessment of geoheritage suggests that V1 could be added to the TGD for educational, cultural, tourism or conservation value (Fig. S10). The geodiversity within the geoconservation boundary at Site 3 was also quite high, with a value of 40.5 (Fig. 3). The validation boundaries at Site 3 are also like the existing G1 boundary, given the similarity between values of R, ER and S. However, the geodiversity within the validation boundaries are considerably less overall, having attained medium to low geodiversity (Table 4)(Fig. S3). Site 3 ranked the highest in aesthetic value compared to other sites, and lowest in conservation value. The scientific value at Site 3 is equal to the scientific value at Site 1 (Fig. S10).
Table 4. The calculation of geodiversity within individual site boundaries from acquired field data using the Serrano and Ruiz-Flano (2007) geodiversity index formula and automated in the Survey 123 mobile application. Digital elevation models and slopes to calculate roughness (R) were facilitated by ELVIS data (ICSM, 2020).
Site boundary | (R) | (ER) | (S) | (Gd) | Geodiversity category |
Site 1 (Coastal): Don Heads Basalt Landform (State significance) | |||||
G1 | 6.257 | 12 | 0.1791 | 43.7 | High geodiversity |
G2 | 6.247 | 6 | 0.0590 | 13.2 | Medium geodiversity |
V1 | 6.247 | 10 | 0.0903 | 26 | Medium geodiversity |
Site 2 (Coastal): Mersey Bluff Pseudo Petroglyphs (District significance) | |||||
G1 | 4.450 | 5 | 0.0480 | 7.33 | Low geodiversity |
V1 | 4.400 | 11 | 0.00302 | 8.34 | Low geodiversity |
V2 | 3.810 | 2 | 0.00847 | 1.59 | Very low geodiversity |
V3 | 3.390 | 2 | 0.00390 | 1.22 | Very low geodiversity |
Site 3 (Coastal): Penguin Megabreccia (Global significance) | |||||
G1 | 7.246 | 12 | 0.117 | 40.53 | High geodiversity |
V1 | 3.523 | 7 | 0.02 | 6.30 | Low geodiversity |
V2 | 7.244 | 8 | 0.09 | 24.1 | Medium geodiversity |
V3 | 8.191 | 5 | 0.052 | 13.85 | Medium geodiversity |
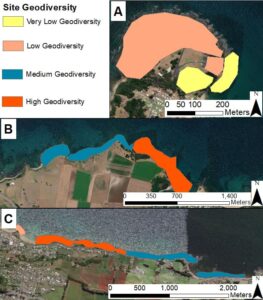
Figure 3. The calculated geodiversity value within geoconservation and validation boundaries. A) Mersey Bluff Pseudo Petroglyph geoconservation site. B) Don Heads Basalt Landform geoconservation site. C) Penguin Megabreccia geoconservation site.
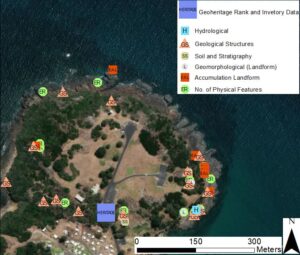
Figure 4. Example of all data captured from ArcGIS QuickCapture and Survey123 compiled into the one map, uploaded to ArcGIS Online, with geoheritage attributes associated and joined with a standalone heritage point (© ESRI background aerial imagery).
ArcGIS QuickCapture facilitated capturing the spatial location of geological features, geormorphological landforms, hydrological elements, soil, stratigraphy, number of physical features and erosion and accumulation landforms (Fig. S8). The geological features were diverse and consisted broadly of elements such as tessellated pavement, foredune basalt outcropping, xenolith, joints, cliffs, and stacks (Table 5). Hydrological elements consisted of leaching aquiferous water, land overflow and rocky pools. Erosional landforms were mostly the result of weathering from the Bass Strait such as undercutting of basalt, or honeycomb weathering from the influence of salt. Accumulation landforms were uncommon, however, were mostly observed in deposition zones where both xenolith and sand were deposited. Soil was also uncommon and was observed predominantly at the base of foredunes. Further, stratigraphy was more common than soil and was observed in areas of the coast where there appeared to have been successive volcanic events resulting in a distinctive layering of basalt rocky shores (Table 5).
A range of geological features are spread out across about 2 km of coastline at Site 1 (Fig. S8) and G1, G2 and V1 contain a variety of geological features. The G1 and G2 boundary are predominantly made up of erosional and accumulation landform features, geomorphological and generic geological structures (Table 5). Conversely, V1 is predominantly hydrological and geomorphological features. Site 2 (Fig. S7) is interspersed with a range of geological elements, but few hydrological elements. The site is predominantly made up of geological structures, with some erosional landforms closer to where the basalt meets the ocean (Table 5). Site 3 (Fig. S7) extends over about 4 km, is interspersed with all geological feature types assessed. The entirety of the study site, even outside G1 maintains a relatively high number of individual geological features. Both erosional ad hydrological landforms and features were predominant across the whole site (Table 5).
Table 5. A summary of geological data types captured at each geoconservation site from within the established geological data classifications used to capture geodiversity in ArcGIS QuickCapture.
Geological data classification | Geological data type description |
Don Heads Basalt Landform | |
Geological structures | Weathering basalt, xenolith, basalt plateau, columnar joints, basalt stacks and separate flow phenomena |
Geomorphological (landform) | Basalt plateau, cliff, tessellated pavement, headland, and stacks |
Erosional landform | cliff undercutting, basalt plateau coastal erosion and honeycomb weathering |
Accumulation landform | Xenolith and sand |
Soil and stratigraphy | Heavily weathered basalt, underlying dune soils, small rock fragments, and foredune soil |
Hydrological | Pool of seawater and leaching aquiferous waters under foredune |
Mersey Bluff Pseudo Petroglyphs | |
Geological structures | Inland dolerite rock outcrops, pseudo petroglyphs, dolerite cliffs, jointing and fracturing |
Geomorphological (landform) | Coastal plateaus, headland, and cliff |
Erosional landform | Doleritic undercutting from ocean |
Accumulation landform | Xenolith and sand |
Soil and stratigraphy | Overlying coastal headland soil from extensive dolerite weathering |
Hydrological | Pool of seawater on plateau |
Penguin Megabreccia | |
Geological structures | Quartzwacke turbidite, dolomite, basalt, trachyte, trachybasalt and trachyandesite |
Geomorphological (landform) | Coastal headland, plateau, and stacks |
Erosional landform | Coastal erosion from influence of Bass Strait, and some honeycomb weathering |
Accumulation landform | Xenolith and sand |
Soil and stratigraphy | Some rare volcaniclastic sediments |
Hydrological | Rock pools |
Each point feature captured in the field stored attribute information relevant to the geodiversity elements at the site. To demonstrate (Fig. S9), a geological structure point feature stored a photograph attachment, description, rock type, rock classification and represented ages attributes. The above attributes were captured for every point feature captured within each of the geoconservation sites. Furthermore, this data would readily merge and align with existing databases, namely Oracle used in the NVA (Connect to Oracle from ArcGIS, https://enterprise.arcgis.com/en/server/latest/manage-data/windows/connect-oracle.htm). Further, the extensive attribute information captured in Survey123 (Tables S3, S4) could be imported into GIS software and spatially joined to individual geological feature classes (Fig. S9). Or an overarching geoheritage feature class point containing geoheritage value attribute information could be uploaded to and added at all existing geoconservation sites (Fig. 4).
Geodiversity and Geoheritage Inventorying Toolkit Compared to NVA Data
Output data from ArcGIS QuickCapture and Survey123 was compiled and uploaded to ArcGIS Online (Fig. 4). The data uploaded to ArcGIS Online contained geodiversity data and associated attributes from ArcGIS QuickCapture for each of the three sites (Fig. 4). Further, geoheritage and inventorying data and associated attributes from Survey 123 (Table S4) (Fig. 4) were easily accessible and were subsequently joined with captured spatial geodiversity points (Fig. 4). By using ArcGIS QuickCapture, considerably more information was accessible about individual geological elements and geodiversity at each of the sites (Fig. 4), compared to what is currently shown on the NVA, a geoconservation boundary with no point features indicating location of geodiversity elements and associated attributes (Fig. S11A-C). However, the NVA did include some data showing a photograph of a geodiversity feature of interest, with some associated attributes (Fig. S11B). The NVA also included information about potential threats, management, condition, conservation, physical, bedrock and geosite values (Fig. S12). However, all values displayed on the NVA were qualitative in nature with no ranking values for geoheritage or inventories (Figs. S11, S12). Conversely, through the digital coalescence of all mobile applications, a suitable qualitative and quantitative inventorying and geoheritage assessment was implemented and spatially aligned at each geoconservation site (Figs. 3, S9, S10, S13). This data could be exported and subsequently merged with the NVA database, and subsequently displayed on TheLIST.
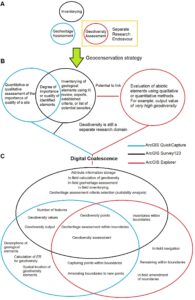
Figure 5. A conceptual model indicating how the digital coalescence of three ArcGIS mobile apps consolidates quantitative geodiversity assessment with geoconservation strategies. A) Geodiversity and geoheritage assessment and inventorying are distinctively separate steps. B) Inventorying and geoheritage assessment in the geoconservation strategy are currently separate research endeavors from quantitative geodiversity assessment.
Discussion
Geoconservation Toolkit Concept
Geoheritage inventorying and assessment are early steps in geoconservation strategies used to facilitate geoconservation outcomes, and geodiversity assessment is currently a separate research endeavour altogether (Fig. 5A) (Brilha 2015). Each step in the geoconservation strategy has varying objectives, methods and techniques (Fig. 5B); however, the overarching objective of geoconservation strategies is to conserve geodiversity within geosites (Henriques et al. 2011), yet the assessment of geodiversity remains separate (Fig. 5B). Through digital coalescence (Fig. 5C), geoconservation outcomes were consolidated by closing the gap between geoconservation strategies and geodiversity assessment. Digital coalescence also facilitated the streamlining of methods and techniques between individual geoconservation strategy steps (Fig. 5C).
ArcGIS QuickCapture facilitated the quantitative calculation of geodiversity, and in acquiring the spatial location and descriptions of abiotic elements (Fig. 5C). ArcGIS QuickCapture was used to determine the ER value in the Serrano and Ruiz-Flano (2007) geodiversity index formula (Table 4), denoted in the app as ‘geodiversity index point (ER)’ (Fig. S6A). The interface within ArcGIS QuickCapture (Fig. S6) provided a simple push-button approach to capture the spatial location of geological structures, erosional and accumulation landforms, soil and stratigraphy and hydrological elements (Table 5)(Figs. S7, S8) and facilitated in-field descriptions of individual geological elements (Figs. S6C, S9). ArcGIS Explorer facilitated in-field navigation and amendments to boundaries (Fig. 5C). There were no distinctive boundary delineations in-field for each geoconservation site, and so ArcGIS Explorer provided real-time positioning information to remain within the validation and geoconservation boundaries (Figs S1, S2, S3) while collecting geological data (Fig. 4). Therefore, the combined use of ArcGIS QuickCapture and Explorer enabled efficient and accurate capturing of geological features and descriptions while remaining within established boundary delineations (Fig. 5C).
ArcGIS Survey123 facilitated in-field calculation of geodiversity and geoheritage value, inventorying, geoheritage criteria selection and attribute information storage (Fig. 5C). When the parameters of the Serrano and Ruiz-Flano (2007) formula (ER, R and S) were populated in Survey123, an output value for geodiversity was automatically calculated in-field (Table 4). With the coalescence of ArcGIS QuickCapture and Survey123, geodiversity was readily determined in-field. Survey123 also facilitated the streamlining of the two geoconservation strategy steps inventorying (Fig. S5A-C) and geoheritage assessment (Fig. 2) into one workable tool. Survey123 also provided a streamlined and systematic approach to determining suitable criteria to implement at each geoconservation site (Table S2)(Fig. S4). Further, selected criteria from within Survey123 were then used to assess each geoconservation site, another approach streamlined and facilitated by the Survey123 app (Fig. 2). The geoheritage value of each geoconservation site was automatically calculated in-field (Fig. S10). The combined use of ArcGIS QuickCapture and ArcGIS Survey123 facilitated storing attribute information about the number of features, geodiversity values and quantitative geodiversity assessment outputs (Fig. 5C). Therefore, through digital coalescence (Fig. 5C), the disparities in and the separation between geoconservation strategy steps were streamlined into one workable tool (Figs. 2, S5, S6), geodiversity assessment was consolidated with geoconservation strategies (Table 4)(Fig. S13) and detailed in-field capturing of geoheritage and inventory values were facilitated (Fig. 4).
Consolidated Geoconservation Outcomes
The inspiration for the proposal of a unified ‘toolkit’ in geoconservation stems from current trends in biodiversity assessment. There is an intrinsic relationship between biodiversity and geodiversity, yet the first is more widely disseminated in the literature (Santos et al. 2017). Biodiversity assessment indices are now being transformed and used in geodiversity assessment methods (Pellitero et al. 2015). Therefore, it is not unreasonable to surmise that biological conservation protocols can be translated into geoconservation strategies, and by extension benefit geoconservation outcomes. For example, in the biological sciences, species richness is assumed to be an indicator of conservation value (Meir et al. 2004). Therefore, ecologists have put considerable effort into determining and monitoring species richness to conserve biodiversity, since conserving locations with high species richness is an efficient method to conserve biodiversity (Fleishman et al. 2006), in some scenarios. It is recognized now that areas of high geodiversity harbor higher biodiversity (Zarnetske et al. 2019). By extension, areas of high geodiversity are likely locations with many geoheritage and inventorying values (Tables 4, S4). Conversely, areas of low geodiversity probably have fewer geoheritage or inventory values (Tables 4, S4).
The quantitative assessment of geodiversity is the evaluation of abiotic elements using quantitative methods such as the Serrano and Ruiz-Flano (2007) index. These methods produce output numerical values indicating the ‘diversity’ of geological elements (Table 4). Therefore, like species richness in biological conservation, knowing a geodiversity value through geodiversity assessment will provide a multitude of benefits to geoconservation (Fig. 5). The current approach used by scholars in geoconservation strategies is to subjectively rank geodiversity based on the number of geological phenomena counted; for example, Pereira et al. (2015) used a ranking approach from 0 to 4 to allocate a geodiversity value for the Iberian Massif Landscape in Portugal. A value of four was allocated when a geosite contained three or more types of geological features with scientific relevance, while zero was allocated when only one type of geological feature was present. Therefore, more dimensions of quantitative geodiversity assessment may complement geological diversity criterion with a systematically determined geodiversity value (Table 4).
Site 1 showed the highest geodiversity (Table 4)(Fig. 3) and using QuickCapture, more points were captured at the site (Fig. S9). Preceding inventorying steps (Fig. S5B) suggest the site is an excellent example of basalt flow phenomena (Eastoe 1979). A succeeding geoheritage assessment step (Fig. 2) revealed that the site is of high conservation value relative to the Penguin Megabreccia geoconservation site (Fig. S10). All boundaries at this site were high in individual geological structures, erosional and accumulation landforms, and geomorphological elements (Table 4)(Fig. S13). The high scientific and conservation value of this site could probably be linked to its high geodiversity (Table 4)(Fig. S10). Therefore, a viable focus of subsequent research would be to determine whether a correlation exists between the level of geodiversity and specific geoheritage assessment criteria such as scientific, potential threats, condition, or conservation value. To demonstrate the benefit of establishing a correlation between geodiversity and geoheritage values, consider for example a site deemed rare, vulnerable and in bad condition with low geodiversity and how it should perhaps be given priority conservation given the relatively low number of abiotic elements. Conversely, a vulnerable site with high geodiversity is potentially less urgent. Subsequent geoscientific research is needed to further validate how to interpret geodiversity values in geoconservation strategies. Experts might agree that a geodiversity value in a geoconservation strategy is a proxy for rarity or scientific value at a site (Table 4, S4). To demonstrate, Site 1 and Site 3 were higher in geodiversity than Site 2, with Site 2 exhibiting no scientific value (Table 4)(Fig. S10).
There are other potential benefits the inclusion of geodiversity assessment in geoconservation strategies may have on geoconservation outcomes. High geodiversity may indicate the need to include broad inventorying criteria and the need to regularly update data contained within the inventories given the higher complexity at the site (Tables 4, S4)(Figs. 3, S13). Low geodiveristy might indicate the need to utilize fewer comprehensive inventories with relatively simple criteria that are required (Tables 4, S4). High geodiversity may also indicate the need to include highly varied geoheritage criteria with a specific focus on scientific values (Table 4)(Figs. 5, S10, S13). Conversely, low geodiversity may require more specific and less complicated geoheritage assessment criteria such as education value given the potentially lower interpretation potential at the site (Table 4)(Figs. 5, S10, S13). Therefore, the inclusion of quantitative geodiversity assessment in geoconservation strategies may serve as proxies for geoheritage assessment criteria, comprehensiveness of inventories and facilitation of successive geoconservation strategy steps (Fig. 5). With this study providing preliminary data in support of an established link between geodiversity and inventorying and geoheritage values (Table 4)(Figs. S9, S10, S13), subsequent research could determine whether mathematically proven links exist between the concepts using statistical approaches. Preliminary data suggest the following benefits to geoconservation outcomes (Fig. 5):
- Predicting sites with rapidly and dynamically changing inventories: areas with high geodiversity are probably more likely to require regular inventorying to continually monitor the many features present at each site (Table 4)(Figs. S10, S13).
- Identifying sites of high scientific value: sites with high geodiversity are potentially high in scientific value (Table 4)(Fig. S10)
- Predicting the ‘extinction’ of rare abiotic features: sites with low geodiversity, rare and vulnerable features, deserve priority conservation since the geology in that local area is limited (Table 4)(Fig. S10)
- Low interpretation potential: sites with high geodiversity probably have lower interpretation potential and therefore probably have lower educational value (Table 4) (Fig. S10)
- High accessibility: low geodiversity might indicate reasonably high accessibility across the research site given potentially lower roughness of the terrain (see Serrano and Ruiz-Flano 2007 formula) (Table 4).
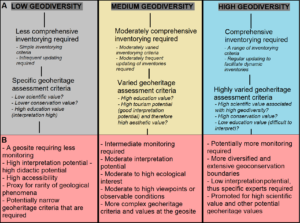
Figure 6. A conceptual model highlighting the benefits to geoconservation outcomes of including geodiversity in geoconservation strategies. A) An overview of how acquiring a specific geodiversity value may consolidate processes in the inventorying and geoheritage assessment of geosites. B) An overview of how acquiring a geodiversity value may consolidate all geoconservation outcomes.
Enhancing Geoconservation by Facilitating Comprehensive and Dynamic Inventories,Inventories are dynamic and best be regularly updated. With the rapid rate at which scientific knowledge advances, current geosites may also lose allocated values overtime, or new phenomena may promote the gain in geosite status (Brilha 2015). For example, geodiversity sites continually evolve such as changing river channel shapes, or climate change impacts (Prosser et al. 2010). The geoconservation toolkit developed in this study provided fast, efficient, and facilitated geoheritage and geodiversity inventorying (Table S4)(Figs. 2, S9, S13). The streamlining of strategy steps facilitated by the geoconservation toolkit provided an expedited, methodical, and streamlined approach to re-assess and inventory existing geoconservation sites (Table S4) (Figs. S6, S8, S10, S11, S12). The implementation of the proposed geoconservation toolkit helped to facilitate overcoming the challenges faced by scholars, industry professionals and conservationists in maintaining and managing dynamically changing inventories of geosites (Figs. S10, S12).
In some countries, geoheritage management is hindered by limited updating of comprehensive inventories (de Lima et al. 2010). Consider the TGD, where some geoconservation sites are updated every few years, with Site 1 (Fig. S1) receiving its last condition or conservation assessment in March of 2014 (Fig. S12), a timeframe of six years for active processes and other factors such as new knowledge in the discipline to render the site’s current record incorrect. The geoconservation toolkit supported more comprehensive inventorying (Table S4)(Figs. 2, S1, S10, S13) by facilitating the rapid capturing of spatial location (Fig. 4) and attribute information of geodiversity data (Fig. 4). Conservation efforts in the biological sciences can be constrained by the absence of the spatial location of biological data (dos Santos et al. 2019; Parks and Mulligan 2010). Acquiring spatial data of geological elements will benefit the management of existing geosites by facilitating the rapid monitoring and updating of inventories (Table S4)(Fig. 4) established steps in the geoconservation strategy (Brilha 2015). To demonstrate, acquiring the spatial location of geodiversity features has benefited the field of geotourism by providing tourists with the capacity to visualise, locate, interpret, and record geological phenomena more readily (Dias et al. 2004).
Effective geoheritage management is constrained by the implementation of inadequate geoheritage and inventorying criteria (de Lima et al. 2010). Geoheritage management is further hindered by the many highly subjective and conflicting criteria (White and Wakelin-King 2014). Some scholars have implemented inventories that have produced incorrect criteria, with some ranking subjective criteria such as accessibility at a site deemed to have high scientific relevance (Joyce 2010). The suitability analysis included in the geoconservation toolkit will provide the basis to objectively determine the most relevant geoheritage and inventorying criteria to implement at existing, or proposed geosites (Table S2)(Fig. S4). It is expected this approach will eliminate the selection of unsuitable criteria in ensuing site assessments (Table S2).
Current Research, Limitations, and Future Directions
The geoconservation toolkit proposed in this study marks the conception of a novel approach working to close the gap between quantitative assessment and geoconservation strategies. ArcGIS mobile apps and the TGD were used to demonstrate the viability of the proposed toolkit to geoconservation outcomes. It is anticipated that this paper is the first of many expanding on objectives to consolidate and streamline geoconservation outcomes using digital tools. Subsequent research could consult geoscientific app developers (Williams and McHenry 2020) to develop an accompaniment or replacement third-party app to the ArcGIS apps, which is designed specifically for the consolidation of geoconservation outcomes. There are several current limitations to using ArcGIS apps to facilitate ongoing consolidation of geoconservation outcomes:
- ArcGIS Online is not a freeware application and a subscription with ESRI is required to activate the online features associated with this tool
- ArcGIS Survey123, QuickCapture and Explorer are directly linked to ArcGIS Online accounts and a subscription is also required to use these apps
- The ArcGIS tools have not been developed to meet the needs of the geoscientific community and hence, there may be some limitations to the software itself in its ability to meet individual requirements. For example, no ArcGIS mobile application facilitates the automated calculation of a ‘roughness index’ without prior intervention using other software such as ArcMap and ELVIS
- These applications although user-friendly, require some GIS expertise to initiate and merge with existing databases. Utilizing these applications may be difficult for those with a limited GIS software knowledge base
- The geoconservation toolkit in this study uses three ArcGIS mobile applications, posing a challenge having to simultaneously manage up to three separate apps.
This study has amalgamated quantitative geodiversity assessment with the assessment and inventorying of geoheritage. Subsequent research should endeavor to amalgamate latter processes in the geoconservation strategy into a mobile app; conservation, interpretation, and promotion (Brilha 2005). Filocamo et al. (2020) has suggested future directions for the implementation of mobile GIS applications in facilitating geoconservation outcomes (Table 64). To emphasize the current limitations and benefits of using ArcGIS Online mobile apps in the geoconservation toolkit, the findings from using the ArcGIS mobile apps with the recommendations from Filocamo et al. (2020) were compared.
Table 6. Filocamo et al. (2020) made a series of recommendations of what mobile GIS applications should include when used in the field of geoconservation. To demonstrate the viability of our ‘geoconservation toolkit’ concept we compared our findings from implementing the apps.
Recommendations by Filocamo et al. (2020) | Findings using ArcGIS QuickCapture, Survey123 and Explorer |
Should be of easy and linear use
| ArcGIS applications are easy and linear in use once setup. However, setting up the applications requires some expertise in GIT, or in understanding computer interfaces. There are many ArcGIS mobile applications available and selecting which apps to use is a challenge for users with limited GIS knowledge. Therefore, subsequent research should endeavour to standardise or determine which ArcGIS apps are most beneficial in geoconservation research.
|
The starting home page should be from an interactive map
| Given all ArcGIS mobile apps are founded on GIS technology, they are the most applicable for research requiring use from interactive maps. The ArcGIS Explorer app used in this study provides the user with an interactive map in the field.
|
All contents should be accessible following a simple drop-down menu
| ArcGIS mobile apps like Survey123 provide simple drop-down menu functionalities. The menu setup in ArcGIS QuickCapture is relatively simple to use only requiring the push of a labelled button to activate geo-location services.
|
All site locations and stops, and position of users, should be captures on an interactive map
| Both ArcGIS QuickCapture and ArcGIS Explorer provided users with interactive map functionality.
|
The application should have cross-platform capabilities and usable on any Android or iOS device
| ArcGIS mobile applications are available for all Android devices, including tablets and laptops. However, the apps are not freeware and a subscription to ArcGIS Online is required to use them to their full functionality.
|
The application should be fast and efficient (low loading waiting times), with low storage capacity requirements and readily updatable and expandable.
| ArcGIS applications with adequate satellite connectivity are fast and efficient to use in the field.
|
Scholars have previously referred to the benefit of mobile applications for geosite interpretation and promotion (Barisic 2011; Cayla et al. 2014; Dias et al. 2004; Frey and Hinkelmann 2009; Martin et al. 2014), and potential benefits are demonstrated of combining quantitative geodiversity assessment with geoheritage and inventorying protocols to geoconservation outcomes (Crisp et al. 2020). This study augments the work of Crisp et al. (2020) by developing a geoconservation toolkit approach where the gap between quantitative geodiversity assessment, geoheritage and inventorying has been closed. This study could also complement current research investigating the use of modified mobile apps to facilitate qualitative field assessments in geoconservation and geotourism (Williams and McHenry 2020; Filocamo et al. 2020; Pica et al. 2018). Given that this study has demonstrated the viability of using digital applications to bridge the gap between geodiversity assessment and geoconservation strategies, subsequent research may benefit from exploring whether digital applications could be used to bridge the gap between geodiversity and biodiversity assessment, with many scholars still treating them as separate entities in the literature (dos Santos et al., 2020; Matthews, 2014; Crisp et al. 2020).
Conclusion
A geoconservation toolkit is presented using the ArcGIS mobile apps QuickCapture, Survey123 and Explorer to consolidate geoconservation outcomes. The geoconservation toolkit closed the theoretical gap between geodiversity assessment and geoconservation strategies and attenuated the discrepancies in geoconservation strategy protocols. ArcGIS QuickCapture facilitated challenges in managing dynamically changing inventories by providing a fast and streamlined approach to the capturing of geodiversity information and locations. ArcGIS Survey123 facilitated the amalgamation of steps in geodiversity and geoheritage assessment and inventorying and ArcGIS Survey123 facilitated the introduction of a suitability analysis tool to objectively manage and select existing geoheritage and inventorying criteria. This study has shown that amalgamating geodiversity assessment with geoconservation strategies may help to predict sites with rapidly and dynamically changing inventories, facilitate the identification of high scientific value sites and help to predict the extinction of locally rare and vulnerable abiotic features. The geoconservation toolkit in this study facilitated an expedited and streamlined approach to geoheritage and geodiversity inventorying of spatial and attribute information of geological data. The acquisition of location data for individual geological phenomena will benefit policymakers, conservationists, and scientists in the management of existing geosites by facilitating updates to dynamically changing inventories and by facilitating successive steps in the geoconservation strategy such as monitoring.
References
Akhmetov B and Aitimov M (2015). Data Collection and Analysis Using the Mobile Application for Environmental Monitoring. Procedia Computer Science 56(1):532-537
Arts K, van der Wal R & Adams WM (2015) Digital technology and the conservation of nature.
Ambio 44(4): 661–673. August T, Harvey M, Lightfoot P, et al. (2015) Emerging Technologies for Biological Recording. Biological Journal of the Linnean Society. 115(3): 731 749.
Barisic M (2011). Solutions for tourism and nature discovery. In proceeding of International Symposium on Geosite Management, Evian.
Bollati I, Fossati M, Zanoletti E, et al. (2016). A methodological proposal for the assessment of cliffs equipped for climbing as a component of geoheritage and tools for Earth Science education: the case of the Verbano-Cusio-Ossola (Western Italian Alps). Journal of the Virtual Explorer. 49: 1.
Bradbury J (1994). Penguin Megabreccia. Available at: https://www.naturalvaluesatlas.tas.gov.au/#Geo sitePage:2424 (accessed 6 May 2020). Brilha J (2005). The Geological Heritage and the Nature Conservation on its Geological feature. Viseu: Palimage Editors.
Brilha J (2015) Inventory and Quantitative Assessment of Geosites and Geodiversity Sites: a Review. The European Association for Conservation of Geologi cal Heritage. 139.doi: 10.1007/s12371-014-0139-3.
Brocx M and Semeniuk V (2009). Coastal Geoheritage: Encompassing Physical, Chemical, and Biological Processes, Shoreline Landforms and other Geological Features in the Coastal Zone. Royal Society of Western Australia 92: 243–260.
Brocx M and Semeniuk V (2010). Coastal geoheritage: a hierarchical approach to classifying coastal types as a basis for identifying geodiversity and sites of significance in Western Australia. Journal of the Royal Society of Western Australia 93: 81–113.
Bruschi V, Cendrero A and Cuesta Albertos J (2011). A statistical approach to the validation and optimisation of geoheritage assessment procedures. Geohe itage 3: 131–49.
Cayla N, Hoblea F and Guasquet D (2012). Place de la géomorphologie dans l’offre géotouristique de l’arc alpin : du réel au virtuel. In Raising the Profile of Geomorphological Heritage through Iconography, Inventory and Promotion. University Paris Sor bonne (pp. 65–71).
Cayla N, Hoblea F and Reynard E (2014). New Digital Technologies Applied to the Management of Geo heritage. Geoheritage. 6: 89–90.
Ceballos G, Ehrlich PR, Barnosky AD, et al. (2015). Accelerated Modern Human-Induced Species Loss es: Entering the Sixth Mass Extinction. Science Advances 1(5). DOI: 10.1126/sciadv.1400253
Ceballos G, Ehrlich PR and Dirzo R (2017). Biological Annihilation Via the Ongoing Sixth Mass Extinction Signaled by Vertebrate Population Losses and Declines. PNAS PLUS.
Chelariu C and Hapciuc O-E (2017). Geodiversity assessment of Moldova catchment in the mountain area. Lucrările Seminarului Geografic” Dimitrie Cantemir” 45: 5–14.
Comfort M and Eberhard R (2011). The Tasmanian Geoconservation Database: A tool for promoting the conservation and sustainable management of geodiversity. In Proceedings of the Linnean Society of New South Wales (pp. 27–36), New South Wale: RMIT.
Davidovic N and Stoimenov L (2011). Improving quality of geo-data in electric utility companies using mobile GIS. In XLVI International Scientific Conference on Information, Communication and Energy Systems and Technologies, Nis, Serbia: ICEST.
de Lima FF, Brilha JB and Salamuni E (2010). Inventorying Geological heritage in Large Territories: A Methodological Proposal Applied to Brazil. Geo heritage. 2:91-92 Dias E, Rhin C, Haller R, et al. (2004). Adding value and improving processes using location-based ser vices in protected areas. In E-Environment: Progress and Challenge (Eds), The WebPark Experience (pp. 291–302). Mexico: Instituto Politécnico Nacional Mexico.
Díaz-Martínez E (2011) Typology of heritage: where does geoheritage fit in. In Forum GeoReg. Pro gramme and Abstracts.
dos Santos DS, Mansur KL, de Arruda ER, et al. (2019). Geodiversity Mapping and Relationship with Vegetation: A Regional-Scale Application in SE Brazil. Geoheritage. 11(2): 399–415. doi: 10.1007/s12371 018-0295-y.
dos Santos FM, Corte Bacci DC, Saad AR, et al. (2020). Geodiversity Index Weighted by Multivariate Statistical Analysis. Applied Geomatics. 12: 361–370 DPIPWE (2016). Tasmanian Geoconservation Data base. Available at: https://dpipwe.tas.gov.au/con servation/geoconservation/tasmanian-geoconserva tion-database (accessed 5 September 2020).
DPIPWE (2018). Natural Values Atlas - Geodiversity. Available at: https://www.naturalvaluesatlas.tas.gov. au/#GeodiversityHomePage (accessed 25 May 2020). DPIPWE (2019). Tasmanian Geoconservation Data base. Available at: https://dpipwe.tas.gov.au/con servation/geoconservation/tasmanian-geoconserva tion-database (accessed 21 February 2019). Eastoe C (1979). Geological Monuments in Tasmania. Geol. Soc. Aust. (Tasm. Div.).
Fan G, Chen F, Li Y, et al. (2019) Development and Testing of a New Ground Measurement Tool to As sist in Forest GIS Surveys. Forest 10(643).
Filocamo F, Di Paola G, Mastrobuono L, et al. (2020). MoGeo, a mobile application to promote geotourism in molise region (southern Italy). Resources 31(9): 1–20.
Fleishman E, Noss R and Noon B (2006). Utility and limitations of species richness metrics for conservation planning. Ecological Indicators 6: 543–553. DOI: 10.1016/j.ecolind.2005.07.005.
Forte JP, Brilha J, Pereira DI, et al. (2018). Kernel Density Applied to the Quantitative Assessment of Geodiversity. Geoheritage. 10(2): 205–217. DOI: 10.1007/s12371-018-0282-3.
Frey M and Hinkelmann K (2009). Application of in novative technology QR-code for popularisation of Earth heritage topics at the World heritage site Messel Pit, Germany. 6th European Congress on Regional Geoscientific Cartography and Information Systems (pp. 250–253). München: Landesamt für Vermessung und Geoinformation.
Gallerini G, Susini S, Bruciatelli L, et al. (2011). Geomatics and GeoTourism: San Bartolo Natural Park Case Study (Pesaro, Italy). GeoActa 3: 167–178.
Ghiraldi L, Coratza P, Marchetti M, et al. (2010). GIS and Geomatics for the Evaluation and Exploitation of Piemonte Geomorphosites. In Mapping Geoheritage. Lausanne: Institut de Geographie (pp. 97–113).
Gray M (2013). Geodiversity: Valuing and Conserving Abiotic Nature. 2nd ed. Chichester UK: Wi ley-Blackwell. Grove J, Stout J, Rutherford I, et al. (2015). Identifying and Classifying Sites and Processes of Fluvial Geo morphic Significance in the Tasmanian Wilderness World Heritage Area: a Proposed Approach. 15/5, Nature Conservation Report. Hobart, Tasmania: Department of Primary Industries, Parks, Water & Environment.
Henriques M, Pena dos RR, Brilha J, et al. (2011). Geo conservation as an emerging Geoscience. Geoheri tage. 3: 117–128. Houshold I and Sharples C (2008). Geodiversity in the wilderness: a brief history of geoconservation in Tasmania. Geological Society of London. 300: 257–272. ICSM (2020). ELVIS - Elevation and Depth - Foun dation Spatial Data. Available at: https://elevation. fsdf.org.au/ (accessed 5 October 2020).
Iscan F and Guler E (2021). Developing a mobile GIS application related to the collection of land data in soil mapping studies. International Journal of Engineering and Geosciences. 6(1): 27–39.
Jolma A, Ames D, Horning N, et al. (2008). Free and Open Source Geospatial Tools for Environmental Modeling and Management. In Developments in Integrated Environmental Assessment (pp. 163 180). Elsevier.
Jordan J, Moran C and Godwyll J (2019). Does Tourism Really Cause Stress? A Natural Experiment Utilizing ArcGIS Survey123. Current Issues in Tourism. 24(1): 1-15 Joyce E (2010). Australia’s geoheritage: history of study, a new inventory of geosites and applications to geotourism and geoparks. Geoheritage. 2: 39–56.
Kaskela AM and Kotilainen AT (2017). Seabed geo diversity in a glaciated shelf area, the Baltic Sea. Geomorphology. 295: 419–435. DOI: 10.1016/j. geomorph.2017.07.014.
Kiernan K (1996). The Conservation of Glacial Land forms. Forest Practices Unit. Kubalikova L (2013). Geomorphosite assessment for geotourism purposes. Czech Journal of Tourism. 2(2): 80–104. DOI: 10.2478/cjot-2013-0005.
Leakey R and Lewin R (1996). The Sixth Extinction: Patterns of Life and the Future of Humankind. 1st ed. New York: Anchor Books. Lindsay I (2014). Tablet-Based Mobile GIS Approach es to Archaeological Data Collection in Armenia. Purdue University. Available at: https://docs.lib. purdue.edu/purduegisday/2014/Presentations/2/ (accessed 11 December 2020).
Lindsay I and Kong N (2020). Using the ArcGIS col lector mobile app for settlement survey data collection in Armenia. Advances in Archaeological Practice. 8(4): 322–336. doi: https://doi.org/10.1017/ aap.2020.26.
Linkov I, Varghese S, Jamil T, et al. (2004). Multi-Criteria Decision Analysis: A Framework for Structuring Remedial Decisions at Contaminated Sites. Comparative Risk Assessment and Environmental Decision on Making 38.
Manosso FC and de Nobrega MT (2016). Calculation of Geodiversity from Landscape Units of the Cadeado Range Region in Parana, Brazil. Geoheritage. 8(3): 189–199. DOI: 10.1007/s12371-015-0152-1.
Martin S, Reynard E, Pellitero Ondicol R, et al. (2014). Multi-Scale Web Mapping for Geoheritage Visualisation and Promotion. Geoheritage. 6: 141–148. Matthews T (2014). Integrating Geodiversitiy and Bio diversity Conservation: Theoretical Foundations and Conservation Recommendations in a Europe an Union Context. Geoheritage. 6: 57–70. DOI: https://doi.org/10. 1007/s12371-013-0092-6.
Meir E, Andelman S and Possingham H (2004). Does conservation-planning matter in a dynamic and un certain world? Ecological Letters. 7: 615–622.
Moore D, Betts P and Hall M (2015). Fragmeneted Tasmania: the transition from Rodinia to Gonwana. Australian Journal of Earth Sciences. 62(1): 1–35.
Nowak MM, Dziób K, Ludwisiak Lukasz, et al. (2020). Mobile GIS applications for environmental field surveys: A state of the art. Global Ecology and Conservation. Elsevier: e01089.
Ozsahin E (2017). Geodiversity assessment in the Ganos (Isiklar) Mount (NW Turkey). Environmental Earth Sciences. 76(7): 271. DOI: 10.1007/s12665 017-6591-z.
Pál M and Albert G (2019). Digital Cartography for Geoheritage: Turning an Analogue Geotourist Map Into Digital. In: International Cartographic Association, Japan:.International Cartographic Association.
Parks K and Mulligan M (2010). On the relationship between a resource based measure of geodiversity and broad scale biodiversity patterns. Biodivers Conserv 19: 2751–2766. Pattern and Process: Towards a Regional Approach to National Estate Assessment of Geodiversity (1997). Landform Classification for Geoconservation. Technical Series 2. Australian Heritage Commission & Environment Forest Taskforce, Environment Australia, Canberra.
Payne JL, Bush AM, Heim NA, et al. (2016). Ecological Selectivity of the Emerging Mass Extinction in the Oceans. Science. 353: 1284–1286. Pellitero R, Gonzalez-Amuchastegui M, Purificacion R, et al. (2011). Geodiversity and Geomorphosite Assessment Applied to a Natural Protected Area: the Ebro and Rudron Gorges Natural Park (Spain). Geoheritage. 3: 163–174.DOI: 10.1007/s12371-010-0022-9.
Pellitero R, Manosso FC and Serrano E (2015). Mid- and Large-Scale Geodiversity Calculation in Fuentes Carrionas (NW Spain) and Serra do Cadeado (Parana, Brazil): Methodology and Application for Land Management. Geografiska Annaler Series a-Physical Geography. 97(2): 219–235. DOI: 10.1111/geoa.12057.
Pereira D, Pereira P, Brilha J, et al. (2015). The Iberian Massif landscape and fluvial network in Portugal: a geoheritage inventory based on the scientific value. Proceed ings of the Geologists’ Association. 126: 252–265.
Perotti L, Carraro G, Giardino M, et al. (2019). Geo diversity Evaluation and Water Resources in the Sesia Val Grande UNESCO Geopark (Italy). Water. 11(10): 2102.
Pettorelli N, Safi K and Turner W (2014). Satellite Re mote Sensing, Biodiversity Research and Conservation of the Future. Philosophical Transactions of the Royal Society. 369: 20130190
Pica A, Reynard E, Grangier L, et al. (2018). GeoGu ides, Urban Geotourism Offer Powered by Mobile Application Technology. Geoheritage. 10: 311–326. Plomley B (1993). The Tasmanian Aborigines. Launceston, Tasmania: The Plomley Foundation. Prosser C (2013).
Our rich and varied geoconservation portfolio: The foundation for the future. In Proceed ings of the Geologists’ Association. Prosser C, Burek C, Evans D, et al. (2010). Conserving geodiversity sites in a changing climate: management challenges and responses. Geoheritage. 2: 123–136. doi: https://doi.org/10.1007/s12371-010-0016-7.
Quilty PG, Hill PJ, Exon NF, et al. (2014). Creta ceous-Neogene evolution of Tasmania. In Geolog ical Evolution of Tasmania (pp.409-509). Geological Society of Australia Special Publication.
Rovere A, Vacchi M, Parravicini V, et al. (2011). Brin ging Geoheritage Underwater: Definitions, Methods, and Application in Two Mediterranean Marine Areas. Environmental Earth Sciences. 64: 133–142.
Sanchez J and Brilha J (2017). Terrestrial impact struc tures as geoheritage: an assessment method of their scientific value and its application to Brazil. Anais da Academia Brasileira de Ciências. 89(2): 825–834.
Santos DS, Mansur KL, Goncalves JB, et al. (2017). Quantitative assessment of geodiversity and urban growth impacts in Armacao dos Buzios, Rio de Janeiro, Brazil. Applied Geography. 85: 184–195. doi: 10.1016/j.apgeog.2017.03.009.
Seijmonsbergen A, De Jong Mat G and De Graaff Leo W (2009). A Method for the Identification and As sessment of Significance of Geomorphosites in Vorarlberg (Austria), supported by Geographical Information Systems. Memorie Descrittive Della Carta Geoligica d’Italia.87: 163–172.
Serrano E and Ruiz-Flano P (2007). Geodiversity. A theoretical and applied concept. Geographica Hel vetica. 62: 140–146. Serrano E, Ruiz-Flaño P and Arroyo P (2009). Geodiver sity assessment in a rural landscape: Tiermes-Cara cena area (Soria, Spain). Memorie Descrittive Della Carta Geoligica d’Italia. 87: 173–180.
Seymour DB and Vicary MJ (2010). A Review of Cambrian Megabreccias in the Penguin - Ulverstone area, Central Northern Tasmania. Mineral Resourc es Tasmania. Sharples C (1993). A Methodology for the Identification of Significant Landforms and Geological Sites for Geoconservation Purposes. Technical Report. Forestry Commission Tasmania, Hobart.
Sharples C (2003). A Review of the Geoconservation values of the Tasmanian Wilderness World Heritage Area. Department of Primary Industries Parks Water and Environment.
Soms J (2017). Assessment of Geodiversity as Tool for Environmental Management of Protected Nature areas in South-Eastern Latvia. In Proceedings of the 11th International Scientific and Practical Conference (Volume I, p. 277).
Stevanovic A (2015). Methodological guidelines for geoheritage site assessment: a proposal for Serbia. Natural History Museum in Belgrade. 76: 105–113. doi: 10.2298/GABP1576105M.
Suma A and de Cosmo P (2011). GeoDiv Interface: An Open Source Tool for Management and Promotion of the Geodiversity of Sierra de Grazalema Natural Park (Andalusia, Spain). GeoJournal of Tourism and Geosites. 8(2): 309–318.
White S and Wakelin-King G (2014). Earth Sciences Comparative Matrix: A Comparative Method for Geoheritage Assessment. Geographical Research. 52(2): 168–181. DOI: 10.1111/1745-5871.12062.
Williams M and McHenry M (2020). The increasing need for geographical information technology (GIT) tools in geoconservation and geotourism. Geoconservation Research. 3(1): 17–32.
Yongxin D (2007). New Trends in Digital Terrain Analysis: Landform Definition, Representation, and Classification. Progress in Physical Geography. 31(4): 405–419.
Zangmo GT, Kagou AD, Nkouathio DG, et al. (2017). The volcanic geoheritage of the Mount Bamenda calderas (Cameroon line): assessment for geotouristic and geo educational purposes. Geoheritage. 9(3): 255–278.
Zarnetske P, Read Q, Record S, et al. (2019). Towards connecting biodiversity and geodiversity across scales with satellite remote sensing. Global Ecolo gy and Biogeography. doi: https://doi.org/10.1111/ geb.12887