Introduction
Forests are one of the most important land types and they play a key role in maintaining ecological balance, changing the appearance of the earth and biodiversity (Kayet et al. 2020; Clark 1990). Vegetation cover is a key factor in ecosystem health and environmental and land resources planning (Choubin et al. 2019). Since the forest is a complex and dynamic ecosystem whose components are interconnected and in balance, its equilibrium or regulatory power can be weakened or disappear when this ecosystem is affected by one or more destructive factors, depending on its nature and intensity. Many factors contribute to the destruction of forests and pastures, and fire is one of the most important (Fischer et al. 2016). Wildfires are environmental disasters that threaten human safety, infrastructure, and biodiversity (Tien Bui et al. 2017). Fires also have significant economic and social consequences at regional and local levels, affecting lives and structures (Eskandari & Chuvieco 2015). The effects of global warming on temperature, precipitation, and soil moisture mean that the number and area of fires worldwide are expected to continue to increase (Argañaraz et al. 2015; Westerling 2016).
Iran, with its 14 million hectares of forest land located in a dry tropical high-pressure belt, has the weather necessary for fires to occur in forests and pastures. According to statistics published by the Forests Range and Watershed Management Organization, 15,000 fires occur in Iran every year, so 0.06 % of the country's forests are destroyed by this phenomenon every year (Ardakani 2009). Therefore, fire hazard assessment is very important to reduce the negative impacts of fire and improve the preparedness of fire managers and rural areas that are more exposed to fire (Eastaugh & Hasenauer 2014).
In recent decades, much research has been conducted on the factors that cause and exacerbate fires, as well as the relationship between these factors in creating fire hazard maps and identifying areas at risk. For example, global climate change has led to an increase in the number of fires as precipitation has decreased significantly and temperatures have increased. Evidence of decreasing forest resilience to fire due to climate change has been studied extensively (Allen et al. 2010; Rother & Veblen 2016; Stevens-Rumann et al. 2018). Other factors may exacerbate forest fires, such as a long dry season and human activities (Argañaraz et al. 2015). In this context, by modeling weather conditions, Abatzoglou & Williams (2016) found that increases in fire activity in the western United States and Northern mountains have increased due to both temperatures and widespread drought, especially since 2000. In many parts of the world, wildfires are increasing at an alarming rate. After identifying the effective factors, it was necessary to study the relationships between these factors concerning the occurrence of fires or the increase of these disasters.
Several methods have been proposed and tested by researchers to map fire-prone areas in forests. The first modeling of fire hazards began in the 1980s (Nami et al. 2018). Ivanilova (1985) introduced a model based on probability concepts and partial derivatives for fire modeling, and Chuvieco & Congalton (1989) used a regression model to investigate the correlation between past fires and ecological and topographical factors on the Spanish Mediterranean coast. Jaafari et al. (2019) used a new comparative analysis of four hybrid artificial intelligence models for the spatially explicit prediction of wildfire probabilities. Other fire hazard mapping methods include artificial neural networks, Dong modeling, and fuzzy hierarchical analysis (Satir et al. 2016; Eskandari & Miesel 2017; Güngöroğlu 2017). In general, these approaches can be classified into three main groups: physics-based techniques, statistical techniques, and machine learning techniques. Physics-based techniques, which combine equations from fluid mechanics, biomass combustion, and heat transfer mechanisms, are required to identify fire-prone areas. The major drawback of these approaches is the difficulty in measuring the inherent error rate (Bar Massada et al. 2011). Another disadvantage of the physics-based method is the need for accurate information. For example, data on tree location and size, fuel mass, soil moisture, etc. must be collected over large areas, which is difficult (Pimont et al. 2016). Therefore, these methods may not be applicable in data-poor areas. Machine learning methods, such as artificial neural networks, support vector machines, and decision trees, are very time-consuming and depend on the high computing capacity. Moreover, these methods may not be practical for areas with limited resources and urgent need for action. Therefore, statistical methods for modeling wildfire susceptibility are more suitable for large study areas, especially when combined with GIS technology (Teodoro et al. 2015).
The statistical method most commonly used in landslide modeling, and which will be tested in this study, is the frequency ratio model. For instance, Shahabi et al. (2015) carried out a remote sensing and geographic information system-based study to map areas susceptible to landslides using three statistical models. The basic principle of the frequency ratio model is based on the observed relationships between the distribution of the spatial event and its culprit and calculates the spatial correlation between the location of the fires and the culprits (Lee & Pradhan 2007). In other words, the frequency ratio model is used to evaluate relationships between location-dependent and independent variables (Oh et al. 2011). Few studies use a frequency ratio model to construct a fire hazard map. In one study, Pradan and coworkers modeled fire-prone areas in the Kuala Lumpur region of northern Malaysia using hotspots from previous fire accidents (2000-2005) and the frequency ratio method. In other studies, Pourtaghi et al. (2015) used entropy index and frequency ratio for the forests of Minoodasht in the eastern part of Iran's Golestan Province, Arca et al. (2020) for the forests of Carbuk in Turkey used multicriteria decision analysis and frequency ratio, Kayet et al. (2020) for the forest area of Malgat in the central regions of India used the frequency ratio model and hierarchical analysis process, and Tshering et al. (2020) for the forests in the Himalayan kingdom of Bhutan used the AHP and frequency ratio model to generate hazard maps.
In some studies, researchers have used ground surveys such as GPS to map the area of historic fires. This can affect the accuracy of the model and the final fire hazard map because in many cases the disaster occurred a long time ago, and creating a map years later will not be free of error. It also does not account for smaller fires that started out of sight of people in inaccessible areas and died out naturally. Statistical methods and frequency ratio models are highly dependent on inputs of the exact number and range of historical fires. The researchers then used point-based data of historical fires provided by the U.S. space agency using the Nova and Modis satellites to solve the problem. However, since the data are only available as points, they determine the fire locations and the time of their occurrence, but not the boundary of fire occurrence. The purpose of this paper is to assess and evaluate the results of wildfire susceptibility map obtained by combination of remote sensing and frequency ratio model for Andika region. We have tried to determine the exact extent of fires in the Andika region of the Zagros Mountains in Iran and assess the correlation between the past wildfires and controlling factors.
Materials and Methods
Study Area
The city of Andika, with an area of 2391 km2, is in the northeast of the Iranian province of Khuzestan and almost in the center of the Zagros Mountains between 31°43'N and 32°39'N and 49°52'E and 49°53'E, with elevations ranging from 150–3743 m. About 70% of the elevations of the Andika region include the hills and about 30% of the plains and plateaus between the mountains (Figure 1). Andika region is bordered by Chaharmahal Bakhtiari province to the north and northeast, Dezful city to the northwest, Lali city to the west, MasjedSoleiman city to the south, and Izeh city to the southwest and has 155 thousand hectares of rich forest area. Generally, the vegetation of this area is classified into three different groups, including oaks trees in the mountainous part, very dense jazz trees and shrubs in the Shimbar sanctuary, and fragrant shrubs with high density in part of the southern plains. this area contains 246 plant species, belonging to 179 genera and 57 families. most species belong to the Asteraceae with 30, Fabaceae with 23, Iamiaceae with 22, Apiaceae and Caryophyllaceae each with 11 species. According to the results of the 2016 Population and Housing Census of the Statistics Center of Iran, 47,000 people live in this city, whose traditional life is based on the nomadic social system and has a rural and nomadic structure. The forests of Anadika region have witnessed numerous and large fires in the past years. according to the Khuzestan Environmental Protection Department, only in the first half of 2019, twenty fires occurred in the forests and pastures of this region. The damage caused by one of these fires, which occurred in the Deli forests of the Shimbar protected area, is estimated to be more than 200 hectares of pastures and forests in this area (Khabaronlione 2020).
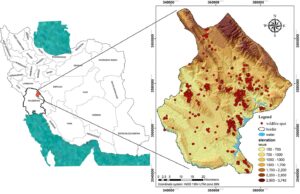
Figure 1. Location of Andika region and VIIRS fire spots (2013-2020).
Data Collection
To identify instances of past fires, a point file containing 549 fire locations from the Nova satellite's VIIRS sensor, covering the study area from 2013 to 2020, was first downloaded from the website NASA (Figure 1). Of these 549 points, 146 final fires were used as the main data of previous fires in the area after combining the points related to a single fire, and Lands8 / OLI images were obtained from the USGS website to extract the fire area of each case by the NBR index (Table 1). Finally, the number of fires was divided into 70 to 30 as training data and evaluation data. To construct a fire hazard map, it is necessary to examine the factors that influence the occurrence of fires and their effects on the occurrence of fires that have occurred in the past.
The occurrence of fires in any area depends on a variety of factors, and an analysis of these primary factors is inevitable in the preparation of fire hazard maps. In Andika, the primary factors for fire occurrence are as follows (Table 2).
Table 1. Satellite images used in fire hazard mapping.
| Satellite data |
|
|
| Acquisition time | Path & row | Spatial resolution (m) | bands |
|
|
| Landsat8/OLI1
|
|
|
| 25 August 2020 | 165/37 165/38 | 30 | Blue (0.450–0.515) Green (0.525–0.600) Red (0.630–0.680) |
|
|
|
|
|
| 7 July to 9 October 2013 6 June to 12 October 2014 25 June to 13 September 2015 8 April to 18 November 2016 27 April to 5 November 2017 1 June to 21 September 2018 19 May to 26 October 2019 21 May to 28 October 2020 | 165/37 165/38 | 30 | NIR (0.845-0.885) SWIR 2 (2.11-2.29) |
|
| |
|
|
|
|
|
| |||||
|
|
|
|
|
| |||||
|
|
|
|
|
|
1https://earthexplorer.usgs.gov/.
Table 2. Data used in fire hazard mapping.
Data layers | Data format | Data source | scale |
|
|
Forest fire locations | point | Fire Information for Resource Management System (NASA) 1 | 1:25,000
|
|
|
Topographic map | Raster | Satellite image | 30 * 30 m |
|
|
land cover | Raster | Satellite image | 30 * 30 m |
|
|
settlement | Point & Line | GPS surveying | - |
|
|
Meteorological data | Excel data | Iranian meteorological Organization (IRIMO) | - |
|
|
1https://firms.modaps.eosdis.nasa.gov/download/.
Topography: Topographic data is among the most important factors in fire occurrence and the importance of elevation, slope, and slope data in fire occurrence has been discussed in various sources (Kayet et al. 2020; Renard et al. 2012). Elevation is an important physio-graphic variable related to temperature, humidity, and wind and is one of the most important and effective factors correlating with fire phenomena and the determination of fire hazard in the study area. As altitude increases, the temperature and density of oxygen decrease, and due to the shallow depth of the soil and wind intensity, the amount of fuel is less (Şen & Habib 2000). It has also been reported that fires at higher altitudes are less intense due to higher rainfall (Chuvieco & Congalton 1989; Adab et al. 2011). It is important to consider the criterion of slope as steep slopes may increase the rate of fire spread. On the other hand, in the northern hemisphere, slopes in the south and southeast are more exposed to the sun, resulting in higher temperatures, higher wind speeds, faster drying of vegetation, and thus an increased risk of fire. For this study, a digital elevation file (aster Gdem) with a pixel size of 30 m was downloaded from the United States Geological Survey (USGS) website. Using the aster Gdem file, slope and slope angle data were generated in ArcGIS 10.5 software. Elevation data were divided into five classes with 700 m intervals to be used in susceptibility analyses, (1) 100-800, (2) 800-1500, (3) 1500-2200, (4) 2200-2900, (5) 2900-3800 m. For slope map Based on topographic changes of the area, four categories (1) 0–10%, (2) 10–20%, (3) 20–50%, (4) > 50% were considered. For slope aspect map categorization, nine directions were used: flat, north, northeast, east, southeast, south, southwest, west, northwest, and north.
Meteorology: One of the most important criteria in fire hazard assessment is annual rainfall because in areas with more rainfall, fuel moisture is higher and ignition and emission rates are lower (Vadrevu et al. 2009). The amount of precipitation also affects the density of vegetation and the evaporation of plant moisture in the dry season. The average annual rainfall in Andika ranges from 422–947 mm. Temperature is one of the most important factors determining the climate of the region. As temperature increases, the vegetation and surrounding air dry out, resulting in an increased rate of ignition and faster spread of fire. Therefore, temperature can be considered as one of the main factors for fire occurrence. Mean annual maps of precipitation and temperature of the Andika region were prepared using ten-year data from 33 synoptic stations in the region and using the kriging interpolation method in ArcGIS 10.5 software (Table 3). The map of the mean annual temperature in the region based on changes in temperature was classified into three categories: (1) 25 degrees Celsius. Five categories of (1) 900 mm were considered to classify the map of average annual rainfall of the region.
Table 3. Synoptic stations.
station | mean precipitation | mean temperature | longitude | latitude |
Ahvaz agriculture | 171.85 | 26.36083333 | 48.73188975 | 31.54626355 |
Ahvaz | 213.8181818 | 26.22045455 | 48.66591535 | 31.30723224 |
Aligudarz | 392.9464286 | 13.0452381 | 49.69620633 | 33.40499112 |
Ardal | 451.46 | 15.76333333 | 50.66245652 | 31.99772681 |
Azna | 215.4727273 | 14.04166667 | 49.45170243 | 33.44994761 |
Daran | 333.7304348 | 10.99456522 | 50.41116637 | 32.98758003 |
Dehdez | 549.56 | 19.81833333 | 50.2945989 | 31.7011103 |
Dezful | 388.3938776 | 24.35187075 | 48.42358412 | 32.3830777 |
Dorud | 620.1266667 | 16.82666667 | 49.0628794 | 33.49590076 |
Farokhshahr | 264 | 13.26388889 | 50.98103876 | 32.27045972 |
Farsan | 446.42 | 14.11833333 | 50.56430242 | 32.26079708 |
Fereydoun shahr | 542 | 11.4 | 50.1241035 | 32.94011444 |
Golpayegan | 252.6956522 | 15.55652174 | 50.27081631 | 33.45723581 |
Gotvand | 273.5333333 | 27.07638889 | 48.80956059 | 32.24347813 |
Hoseinie | 371.48 | 27.28 | 48.2468174 | 32.6763651 |
Iman abad | 429.45 | 17.12916667 | 48.60586947 | 33.38570981 |
Izeh | 634.8 | 23.36628788 | 49.8700857 | 31.82396216 |
Khansar | 379.7333333 | 13.22962963 | 50.31727331 | 33.28119902 |
Khoram abad | 496.9918033 | 17.31967213 | 48.33953246 | 33.4645161 |
Kouhrang | 1351.182143 | 9.898214286 | 50.13616006 | 32.46139222 |
Lali | 393.1125 | 26.73229167 | 49.0943433 | 32.3295438 |
Likak | 460.7333333 | 25.80277778 | 50.09311944 | 30.91392778 |
Lordegan | 551.53 | 16.37125 | 50.82614939 | 31.51700118 |
Masjedsoleyman | 427.9827586 | 25.69396552 | 49.30016309 | 31.9497354 |
Omidieh | 248.75 | 25.63972222 | 49.53922287 | 30.83580608 |
Ramhormoz | 297.0444444 | 27.57345679 | 49.59929677 | 31.2775627 |
Saman | 358.1333333 | 13.82569444 | 50.91069077 | 32.44850122 |
Sepid dasht | 632.42 | 21.80666667 | 48.88439712 | 33.21728399 |
Sofla dezful | 323.9666667 | 24.51234568 | 48.41582379 | 32.35121228 |
Shahr kord | 323.0842105 | 12.22997076 | 50.8563515 | 32.32786675 |
Shol abad | 780.8333333 | 16.36388889 | 49.19106156 | 33.18491053 |
Shush | 211 | 27.26 | 48.25432741 | 32.19578409 |
Shushtar | 295.35 | 27.92 | 48.84978482 | 32.05195236 |
Land Cover: Land cover can be considered a very important factor in the development and progression of fire. Vegetation is the main combustible fuel and one of the main sides of the fire triangle. Moreover, dense and dry vegetation is more flammable than low-dense vegetation. Therefore, the importance of the various aspects of this factor in the occurrence of fire hazards has been studied and considered in all fire hazard studies. To produce the land cover map of the Andika region, the Landsat 8 2020 satellite image was obtained from the USGS website. After performing radiometric and atmospheric corrections, the mentioned image bands (RGB: 432) and supervised classification method were used to construct the vegetation map of the region in five categories of forests, shrublands, low-density pastures, grasslands, and water.
Human Factors: Proximity to residences is directly related to fire accidents caused by human presence and other fire factors (Jiang 2011). Forests near villages experience intentional and unintentional fires all over the world. In recent years, the number of intentional fires has increased due to population growth and increasing demand for agricultural products, and expansion of residential areas. Proximity to roads is another factor that influences the occurrence of fires, and is directly related to contamination by combustible materials such as oil and tire waste from cars and passengers (Gigović et al. 2018). in this study, maps of rural areas, residences, and roads in the area were obtained by GPS. Proximity to rural areas and residences in 500-m sections and six categories (1) 500, (2) 1000, (3) 1500, (4) 2000, (5) 2500, (6) 3000 m were created based on population distribution and topography of the area in ArcGIS software. Six categories of road proximity with sections of (1) 200, (2) 400, (3) 600, (4) 800, (5) 1000 and (6) > 1000 m were considered.
The map of the eight factors and their classes used in this study, including elevation, slope, slope aspect, land cover, average annual temperature, average annual precipitation, proximity to roads, and proximity to villages, is shown in Figure 2.
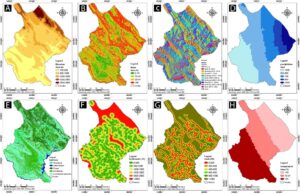
Figure 2. A) Elevation classes; B) Slope classes; C) Slope aspect classes; D) Precipitation classes; E) Land cover classes; F) settlement proximity classes; G) roads proximity classes; H) temperature classes.
Method
In this study, ENVI 5.3, ARCGIS 10.5, and Excel software were used to create a fire map of the study area. The method involves several steps, which are shown as a flowchart )Fig. 3). In the first stage, after identifying the important criteria, spatial and statistical data were converted into rasters with a pixel size of 30 m. Next, a map of fires in the last eight years was created by comparing Landsat 8 data before and after fires and using the NBR index. Next, a map of the frequency ratio of each criterion class and the weighting of each criterion was created using records of previous fires from the NBR index. Finally, the resulting fire hazard map was evaluated once with evaluation data and once with training data using the area under the curve method.
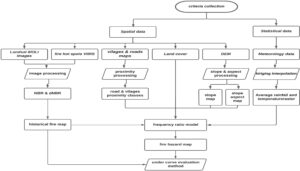
Figure 3. Flowchart of used methodology in fire hazard mapping.
NBR index
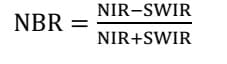
In this study, the Normal Burn Ratio (NBR) index and a combination of near-infrared (NIR) and shortwave infrared (SWIR) data from Landsat 8 satellite imagery were used to create a map of past fires in the study area. NBR is an index developed to detect burned areas in large fires. In most cases, this method reliably separates burned areas from unburned areas and optimally identifies areas affected by fire (Takayama 2018). Healthy vegetation shows very high reflectance in the near-infrared and low reflectance in the shortwave infrared. On the other hand, recently burned regions show low reflectance in the near-infrared and high reflectance in the shortwave infrared (Fig. 4). In other words, the difference between the spectral response of healthy vegetation and burned areas peaks in the near and short infrared.
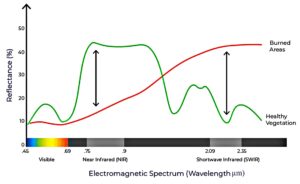
Figure 4. Exploiting spectral response curves.
The NBR index was calculated according to Equation (1) (Key & Benson 2005), for the images taken before and after each fire incident. The NBR index uses the ratio between near-infrared and short-infrared bands to represent spectral differences, a high NBR value in the results indicates healthy vegetation, while a low value indicates vacant land and recently burned areas. Non-burned areas are usually assigned a value close to zero.
 (1)
(1)
After calculating the NBR index for the images before and after each firing, Equation (2) (dNBR or ∆NBR) was used to determine the difference between the pre- and post-fire results.
![]() (2)
(2)
In this formula, the pre-fire NBR raster is the NBR index created from the pre-fire area, and the post-fire NBR raster is the NBR index of the post-fire area. Higher dNBR values indicate more severe damage, while areas with negative dNBR values may indicate vegetation regrowth after the fire. To better extract the results and amplitude of fire, the obtained dNBR map was classified using Table 4, and areas with high dNBR (high fire intensity) were extracted as burned areas from the results.
Table 4. Burn severity levels obtained by calculating dNBR.
Fire intensity | dNBR range |
|
Unburned | - 0.500 to + 0.99 |
|
Low intensity | + 0.1 to + 0.27 |
|
Moderate intensity | + 0.27 to + 0.66 |
|
High intensity | > +0.66 |
|
Frequency Ratio Model
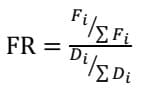
In this study, the frequency ratio method was used to evaluate the importance of each criterion and its associated classes. The frequency ratio is a statistical method based on observed relationships between the spatial distribution of the fire event and its causes. This model calculates the spatial relationship between the location of fire incidents and the factors in the study area (Pradhan et al. 2007). In other words, it is the ratio of the burned area that occurred in a particular class to the ratio of the area of that class to the study area. If the value is greater than one, it means that the class has a higher correlation, and if this value is less than one, it means that there is a lower correlation (Lee & Pradhan 2007). The frequency ratio of each criterion class was calculated using Equation (3). here, Fi is the burned area of a class for a factor; ∑Fi shows the total burned area of all classes; Di is the area of the class; ∑Di shows the total area of all classes. In other words, first, the percentage of occurrence of fires in the classes of each specific criterion is presented, and then the frequency of fires in each class is evaluated according to the size of the class relative to the size of the entire area.
(3)
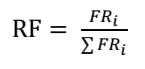
The results of the frequency ratio of the classes of each criterion do not have a specific numerical range, and to calculate the importance of each criterion and compare them, all the results must be normalized in a specific range. Therefore, the frequency ratio of the classes of each criterion in a range of probability values [0, 1] was normalized as relative frequency (RF) using Equation (4). Here, FRi is the frequency ratio of each class of a criterion; ∑FRi is the sum of the frequency ratios of all classes of that criterion.
(4)
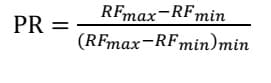
After normalizing the frequency ratio of the criterion classes, RF still has an error and considers all factors and criteria as equally weighted. To solve this problem and find the correlation between fire occurrence criteria, a prediction rate (PR) or weight was calculated to evaluate each fire occurrence criterion. The prediction rate (PR) was calculated based on the difference between the maximum and minimum relative frequencies obtained from the classes of each specific criterion and the minimum value of the differences between all criteria using Equation (5)
 (5)
(5)
After calculating FR, RF, and PR, to obtain the final fire hazard map, the criteria maps were reclassified using Equation (6) according to the relevant relative frequency values and then weighted and combined with the corresponding prediction rate (PR). In the resulting raster map, pixels represent the sum of relative frequencies, and the value of pixels indicates the risk of fire occurrence in that area. In other words, pixels with higher values have a higher risk of fire occurrence.
![]() (6)
(6)
Evaluation of Fire Hazard Map
The resulting hazard map was evaluated and validated using the area under the curve (AUC) method, useful in evaluating the predictive power of the model (Yilmaz 2009). To calculate the AUC, the values of the wildfire frequency ratio index of the frequency ratio models were reclassified and inverted into one hundred classes with a uniform interval of 1%. Second, the fire incident areas were extracted using the training and evaluation data. Third, for each index value, the fire area, cumulative fire area, and fourth, AUC values were calculated using the trapezoidal area formula. Fifth, the AUC values of each index were summed to obtain the total AUC. The quantitative AUC value qualitatively measures the predictive accuracy and performance of the models (Lee & Pradhan 2007). A higher AUC value indicates that the model is more sensitive and accurate in prediction. The AUC value in fire hazard studies can be classified and interpreted into quantitative-qualitative levels of prediction accuracy, which are sorted as follows: 90–100%, excellent; 80–90%, very good; 70–80%, good; 60–70%, average; and 50–60%, poor.
Results
NBR Index
The high spatial resolution maps of past fires are shown in Figure 5 as areas of moderate to severe fire. Errors were removed from the new results using field visits and satellite images.
Figure 5. Generate the fire map of 20. July 2019 using the NBR index: A) Landsat 8/OLI pre-wildfire image (RGB); B) Landsat 8/OLI post-wildfire image (RGB); C) pre-fire NBR index; D) post-fire NBR index; E) dNBR result; F) fire map from dNBR classification, where (α) represents burned areas and (β) represents faults that identify areas of clouds and waters as moderately burned areas.
Statistical results of historical fires show that most fires occurred in summer and early autumn, which may be related to the drying of vegetation and the reduction of humidity in the region, as well as the increase of temperature in the region. After subtracting the errors due to cloud cover and water-covered areas on the ground surface that was incorrectly indicated as burned areas, the results in Table 5 show that about 2.9% of the burned area occurred during the period from July to October 2013. In addition, 1.3% of the area of fires in the period from June to September 2014, 1.9% of the area of fires in the period from July and August 2015, 10.18% of fires in the period from April to October 2016, 12.16% of the area of fires in the period from May to October 2017, 1.52% of the area of fires in the period from June to October 2018, 1.28% of the area of fires in the period from June to October 2019, and 41.82% of the area of fires occurred in the period from May to October 2020. The annual results of the fires clearly show an increase in the area of fires, and the burned area of pastures and forests in the Andika region has increased from 483 hectares in 2013 to about 6800 hectares in 2020. The map of past fires from 2013 to 2020 derived from the results of the NBR index of fires is shown in Figure 6.
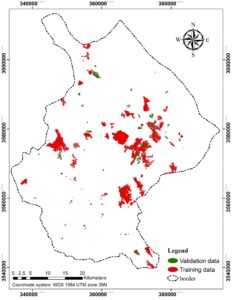
Figure 6. Map of historical fires resulting from the NBR index for the study area (2013-2020)
Frequency Ratio Model Fire Hazard Map
The results of the frequency ratio model and the spatial relationship between wildfires, factors, and their classes are shown in Table 5. The calculations showed that the land cover factor had the highest influence on fire hazard with a probability of 2.98 and the slope factor had the lowest influence with a probability of one. The results of the slope classes show that the slope class above 50% has a higher frequency ratio (1.33). In the study area, it was observed that as the slope gradient increases, the frequency ratio also increases. In terms of slope aspect, the results of the calculations from this study show that fires in the region occur frequently on slopes facing east (1.35), northeast (1.34), and north (1.23). While the frequency of fires in the flat lands (0.32) is the lowest, and the following slopes to the south (0.672) and southwest (0.677) also have the lowest frequency.
The relationship between fires and elevation data shows that elevations between 800 and 1500 m and also 1500 to 2200 m have a frequency ratio greater than 1, indicating a high probability of fires in these classes. Elevations above 2200 m in the Andika region are generally covered with snow throughout the year, which greatly reduces the risk of fire.
The results of proximity to roads showed that the frequency ratio of fires increases with distance, and classes of 1000 m (0.206) and above 1000 m (0.309) of the study area roads have a higher frequency ratio in the occurrence of fires. The results of village proximity also show that as the distance from villages increases, the frequency of fires increases, and classes 2500 m (2.56), 2000 m (1.76), and 1500 m (1.2) have the highest probability of fire occurrence with a frequency ratio of more than one.
The evaluation of the annual average temperature showed that temperatures between 19 and 25 degrees Celsius (1.69) are strongly correlated with the occurrence of fires, and temperatures higher or lower than this class have a lower correlation with the occurrence of fires. Regarding the average annual precipitation, the results show a high correlation between the precipitation class of 700 mm (1.81) and the occurrence of fires, and the precipitation class above 900 mm (0.043) also had the lowest frequency relationship of fires. A lower frequency of fires was observed in the precipitation classes below 700 mm and above 900 mm. Finally, regarding the results on land use and land cover, it can be deduced that the highest frequency of fires is related to the grassland class (2.69), which is due to the risk of ignition and spread of fires in the dry season, followed by the forest class.
After performing calculations related to the frequency ratio and normalizing them, as well as the probability of occurrence of each criterion, the map of each criterion was reclassified according to the relative frequency values concerning itself and weighted by the prediction rate of each criterion (Fig. 7). The criterion layers were combined to create a fire danger map for the area. The fire danger map that resulted from combining the RF maps of the criteria were classified into four Sensitivity categories: Low Risk, Medium Risk, High Risk, and very high-risk using the equal distance method (Fig. 7). The results show that 3.79% of the study area is located in a very high fire risk area, 34.69% in a high-risk area, 41.48% in a medium risk area, and finally, 20.01% of the area in a low-risk area. High and very high-risk areas are located in the central areas in a strip from the northwest to the southeast of the region. This area includes the protected areas of Shimbar and the Shalal and Kotok Mountains. In addition, 76.37% of the historical fires are in the high and very high-risk areas of the resulting hazard map. In the other hazard classes, about 20% of the past fires are in the moderate risk zone and 3.4% are in the low-risk zone. The statistical results of past fires show that most fires occurred in the summer and early fall.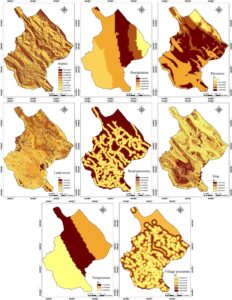
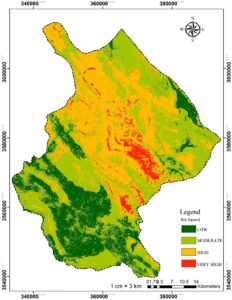
Figure 7. Fire hazard map obtained by NBR index and frequency ratio model: A) Criteria layersreclassified by related RF values; B) fire hazard map produced by NBR index and frequency ratio model.
Table 5. Spatial correlation between fire incident factors and past fires using frequency ratio model.
Criterion | classes | Fire area(he) | Fire (%) | Class area(he) | Area (%) | FR | RF | PR |
Elevation | 100-800 | 2170.38 | 14.382 | 79439.46 | 33.528 | 0.428 | 0.126 | 2.778 |
800-1500 | 9601.57 | 63.627 | 99482.59 | 41.988 | 1.515 | 0.445 | ||
1500-2200 | 3308.77 | 21.926 | 35726.85 | 15.079 | 1.454 | 0.427 | ||
2200-2900 | 3.86 | 0.026 | 15505.54 | 6.544 | 0.004 | 0.001 | ||
2900-3800 | 0 | 0 | 6778.91 | 2.861 | 0 | 0 | ||
Slop | 0-10% | 652.61 | 4.325 | 33057.9 | 13.952 | 0.31 | 0.09 | 1.864 |
10 _20% | 1621.79 | 10.747 | 42007.12 | 17.729 | 0.606 | 0.177 | ||
20_50% | 7230.15 | 47.912 | 96233.04 | 40.616 | 1.18 | 0.344 | ||
> 50% | 5579.66 | 36.975 | 65618.31 | 27.695 | 1.335 | 0.389 | ||
Slop aspect | Flat | 3.72 | 0.025 | 1806.39 | 0.762 | 0.032 | 0.004 | 1 |
North | 1870.74 | 12.397 | 23749.56 | 10.024 | 1.237 | 0.15 | ||
North-east | 2890.86 | 19.157 | 33725.61 | 14.234 | 1.346 | 0.163 | ||
East | 2635 | 17.461 | 30496.95 | 12.872 | 1.357 | 0.164 | ||
South-east | 1472.84 | 9.76 | 23944.77 | 10.106 | 0.966 | 0.117 | ||
South | 1370.66 | 9.083 | 31990.41 | 13.502 | 0.673 | 0.081 | ||
South-west | 1866.08 | 12.366 | 43235.37 | 18.248 | 0.678 | 0.082 | ||
West | 1723.26 | 11.42 | 29279.43 | 12.358 | 0.924 | 0.112 | ||
North-west | 1251.18 | 8.291 | 18705.87 | 7.895 | 1.05 | 0.127 | ||
precipitation | < 500 | 3013.99 | 19.973 | 59128.16 | 24.956 | 0.8 | 0.175 | 2.419 |
600 | 4931.72 | 32.681 | 92593.28 | 39.08 | 0.836 | 0.183 | ||
700 | 5593.83 | 37.069 | 48337.27 | 20.401 | 1.817 | 0.397 | ||
800 | 1503.3 | 9.962 | 21942.12 | 9.261 | 1.076 | 0.235 | ||
> 900 | 41.72 | 0.276 | 14935.21 | 6.304 | 0.044 | 0.01 | ||
Temperature | < 19 | 2978.07 | 19.735 | 67706.05 | 28.576 | 0.691 | 0.227 | 2.105 |
19-25 | 8133.86 | 53.901 | 75409.43 | 31.827 | 1.694 | 0.555 | ||
> 25 | 3972.82 | 26.327 | 93818.15 | 39.597 | 0.665 | 0.218 |
Table 5. continue.
Criterion | classes | Fire area(he) | Fire (%) | Class area(he) | Area (%) | FR | RF | PR |
Land cover | Forest | 4399.99 | 29.157 | 46377.75 | 19.574 | 1.49 | 0.264 | 2.982 |
shrublands | 3248.27 | 21.525 | 58458.37 | 24.673 | 0.872 | 0.155 | ||
Low-density pastures | 4017.18 | 26.621 | 108717.9 | 45.885 | 0.58 | 0.103 | ||
grassland | 3395.79 | 22.503 | 19788.64 | 8.352 | 2.694 | 0.478 | ||
Water bodies | 0 | 0 | 3591.03 | 1.516 | 0 | 0 | ||
Village proximity | 500 m | 1232.24 | 8.166 | 43116.11 | 18.198 | 0.449 | 0.059 | 1.74 |
1000 m | 3010.77 | 19.952 | 69877.59 | 29.492 | 0.676 | 0.089 | ||
1500 m | 3688.64 | 24.444 | 48147.56 | 20.321 | 1.203 | 0.159 | ||
2000 m | 2907.48 | 19.267 | 25810.92 | 10.894 | 1.769 | 0.233 | ||
2500 m | 2030.63 | 13.456 | 12423.2 | 5.243 | 2.566 | 0.338 | ||
3000m | 2214.97 | 14.678 | 37558.27 | 15.852 | 0.926 | 0.122 | ||
Road proximity | 200 m | 1248.68 | 8.275 | 42851.82 | 18.086 | 0.458 | 0.088 | 1.384 |
400 m | 1208.16 | 8.006 | 35638 | 15.041 | 0.532 | 0.102 | ||
600 m | 1283.63 | 8.506 | 29837.79 | 12.593 | 0.675 | 0.13 | ||
800 m | 1351.02 | 8.953 | 24735.51 | 10.44 | 0.858 | 0.164 | ||
1000 m | 1374.97 | 9.112 | 20043.55 | 8.46 | 1.077 | 0.207 | ||
> 1000 m | 8618.28 | 57.111 | 83826.99 | 35.38 | 1.614 | 0.31 |
Evaluation of NBR and Frequency Ratio Fire Hazard Map
The resulting hazard map was evaluated and validated using the area under the curve method. The quantitative AUC value qualitatively measures the predictive accuracy and performance of the models (Lee & Pradhan 2007). Figure 8 shows the results of fire hazard map evaluation by the area under the curve method using training and evaluation data. In the present study, the AUC results for the created fire hazard map were 71.1% using evaluation data and 74.48% using training data, which is good and acceptable. Also, the small difference between the evaluation results of the map using the evaluation and training data indicates unbiased results.
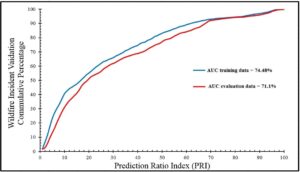
Figure 8. Fire hazard map evaluation using the AUC method.
Discussion
In this study, a fire risk map was created using the NBR remote sensing technique and the frequency ratio model. To assess the risk and create a fire hazard map for the area, eight criteria were considered, elevation, precipitation, temperature, slope, slope aspect, proximity to villages, proximity to roads, and land cover. The results of past fires and frequency model ratio model showed that in the study area, land cover, elevation, and annual precipitation have the greatest influence on fire occurrence. In other studies, different criteria were identified as most important, which may relate to different climatic and ecological conditions. For example, Pourtaghi et al. (2015) using a frequency ratio model showed that for the forests of Minoodasht, land cover, soil, and the annual temperature had the most important influence on the occurrence of fires.
In the AUC assessment of the fire hazard map, we found an accuracy of 71.1% when using evaluation data and 74% when using training data, which can be considered a desirable and acceptable prediction because the small difference between the assessment results of the evaluation and training data indicates an unbiased risk map. Also, the fact that most of the fires in the past are located in a high and very high-risk area (76.37%) indicates a very high correlation between the map produced by this model and the fires that occurred in the past. The evaluation of the frequency ratio model in this study and the results of the studies of Pourtaghi et al. (2015; 79.85%) and Arca et al. (2020; 76.42%) compared to the results of the hierarchical method in the study of Tshering et al. (2020; 63%) indicate the higher efficiency of the frequency ratio model.
Fire is a function of various physical, climatic, biological, economic, and social variations, and an accident at a particular location may not be directly related to other locations with the same intensity. The relative frequency values for each operating class in the frequency ratio model indicate the extent to which the factor and the operating group are related to fire occurrence. For example, in this study and in the results of Pourtaghi et al. (2015), the frequency of fires increases with increasing distance from the roads, while in the results of Tshering et al. (2020) and Arka et al. (2020), the closer distances have higher fire probability. Also, Jaafari et al. (2019) found the class with the farthest distance has a greater weight. Here, and in the results of Pourtaghi et al. (2015), it was observed that as the slope gradient increases, the frequency of fires increases, while Pradhan et al. (2007) found that lower slope gradients have higher fire frequency and for slope gradients above 36 degrees, the fire frequency decreases to zero. Or in the case of average annual precipitation, the results show a high correlation between precipitation class with 700 mm (1.81) and fires, and in the precipitation class above 900 mm (0.043), there was the lowest frequency of fires. In other words, lower frequency is observed in precipitation less than 700 and more than 900 mm, while Jaafari et al. (2019) noted that more rainfall has more weight. Pourtaghi et al. (2015) found that as precipitation increases, the frequency of fires also increases. Increased precipitation due to the direct effect on vegetation density increases fires, but on the other hand, precipitation above 900 mm in the Andika region is located in the highlands of the region and is mostly in the form of snow, so the frequency ratio of past fires in these areas is lower. Such ambiguities can be easily identified and removed by calculating the frequency ratio. However, this is not possible in other hazard mapping models because other models, such as multicriteria decision-making with AHP, are not based on historical fire data, unlike the frequency ratio model. In such models, to model fire hazards, we need qualified multidisciplinary experts who have access to the relevant concepts. Therefore, when qualified experts are not available and historical fire data are not available, other models can be used as an alternative method. Where satellite data are available, remote sensing and NBR indexing techniques can be used to identify past fires without the need for on-site presence and ground mapping, and to generate the fire hazard map using the frequency ratio model.
The NBR index is a very powerful tool for creating a fire hazard map by examining pre-and post-fire satellite imagery. However, one of the challenges of using this method is to be able to access pre-fire and post-fire images at short time intervals. On the other hand, the high sensitivity of the pixels of this method to areas with water and clouds may cause these areas to be classified as high fire intensity areas. To solve this problem, it is necessary to provide images with minimal cloud cover and correct possible errors in the results. However, the NBR index can be considered very effective as it can provide accurate information about past fires, especially in areas with a lack of data.
Geoconservation Implications
All landforms are archives of the life history of our planet. The simultaneous and sudden loss of large numbers of plants, animals, and other organisms will inevitably affect the way species interact with each other and the ability of ecosystems to recover. Results of the fire hazard map showed that the areas with very high fire hazard are located from the northwest to the southeast of the region along the Zagros mountains. These areas mostly have steep slopes (>50%). Also, the results of NBR index for past fires showed that 36.97% of the area of past fires occurred in slopes between 20% to 50 % and 47.91% in areas with slopes greater than 50%. wildfire. Destroying the vegetation on steep slope lands not only causes extensive damage to the geoheritage, but also causes the escalation and occurrence of other hazards. With the destruction of the vegetation, the surface water system may become more destructive as the magnitude and frequency of storms and rainfall increase, leading to flood, greater erosion and increased sediment transport. Although erosion may reveal new exposures but may also destroy some features and change the landforms and increase landslide risk.
Conclusion
As seen in the results of this research, the degree of influence of different factors involved in causing fires in each region can be different. The combination of remote sensing to investigate past hazards and the relative frequency statistical method to prepare a fire hazard map can be considered an efficient and reliable method. Conducting such research plays an important role in assessing and evaluating the sensitivity of natural and forested areas and making proper management decisions for fire suppression, especially in areas with data deficiency and field strength. Therefore, the map obtained from this research helps in fire suppression in the study area, prevention of fires, and finally their rapid extinction. Based on this research and its results, appropriate firefighting equipment can be deployed in an area with high and very high fire risks before the fire season starts.
Conflict of Interest
The authors report there are no competing interests to declare.