Introduction
Overview
Biodiversity is disappearing at unprecedented and increasing rates (Leakey and Lewin 1996; Payne et al. 2016; Ceballos et al. 2017, 2020; Wu and Liang 2018; Krehenwinkel et al. 2019), and avoidance needs increased ambition (Martin et al. 2016) and development of new approaches to conceptualize and practice conservation (Knight et al. 2019). Scholars from various biomes of marine (Daru and le Roux 2016; Giakoumi et al. 2018; Pendleton et al. 2018), terrestrial forest (Nagel et al. 2017; Burivalova et al. 2019), and intertidal (Ellison et al. 2017; Jia et al. 2018; Worthington et al. 2020) have highlighted many methodological challenges in achieving effective conservation outcomes. For example, geoconservation outcomes are hindered by highly subjective criteria, varying assessment objectives, disparities in geoconservation strategy steps, and the inadequate capturing and representation of geological data (Crisp et al. 2022). Further, exclusivity of geodiversity assessment and biodiversity assessment within conservation strategies also limits effective outcomes (Toivanen et al. 2019; Crisp et al. 2020). For example, biodiversity assessments are constitutive in facilitating conservation actions and priorities (Steele and Pires 2011; Pollock et al. 2020; Pauchard et al. 2018), and assessment outcomes from geodiversity assessments can add statistical power to biodiversity models such as prediction of species distribution and abundance (Hjort et al. 2012; Bailey et al. 2017, 2018; Tukiainen et al. 2017, 2019), and act as a surrogate in the absence of species data (Anderson et al. 2015). Yet, geodiversity and biodiversity are continually treated as separate entities in conservation literature (Matthews 2014).
Geodiversity
Geodiversity is “the natural range of geological, geomorphological, soil and hydrological features” (Gray 2013). Geodiversity assessment is the evaluation of abiotic diversity using qualitative or quantitative methods (Forte et al. 2018). Qualitative assessments commonly use a subjective ranking approach (Fassoulas et al. 2012), while quantitative assessments use the Serrano and Ruiz-Flano (2007) geodiversity index, statistical, GIS or remote sensing tools ( Pellitero et al. 2015; Stepisnik and Trenchovska 2016; Naparus-Aljancic et al. 2017; Seijmonsbergen et al. 2017; Ferrer-Valero et al. 2019). Geodiversity assessment is still in a state of methodological development and consolidation, with the exclusion of ‘geodiversity’ from nature conservation processes, absence of a consensus on optimal approaches to quantify geodiversity, spatial and temporal aspects of geodiversity, and exclusivity of abiotic and biotic components in conservation literature suggested as contributing factors to its lagging state (Boothroyd and McHenry 2019; Zakharovskyi and Németh 2021). Given the intrinsic relationship and functional value to biodiversity that geodiversity provides, improving the development state of geodiversity assessment is vital in ensuing conservation planning and outcomes (Anderson et al. 2015; Santos et al. 2017; Soms 2017; Crisp et al. 2020). Fortunately, there have been recent novel and more simplified approaches to geodiversity assessment. For example, Zakharovskyi and Németh (2021) have developed a new quantitative-qualitative method for the ‘rapid’ assessment of geodiversity using publicly accessible software such as QGIS and GRASS, complementing widely disseminated quantitative approaches such as the Serrano and Ruiz-Flano (2007) geodiversity index. However, amidst the numerous methods available in the literature, there remains no consensus or agreement on optimal approaches moving forward (Zakharovskyi and Németh 2021); hence, future directions in geodiversity assessment development should encourage reaching agreement on standardized approaches, with Crisp et al. (2020) recommending a technical working group approach.
Biodiversity
Biodiversity is the variety of genes, species, and ecosystems (Pomerantz et al. 2018), and biodiversity assessment is the evaluation of biodiversity (Steele and Pires 2011; Klingbeil and Willig 2015) using methods such as the Shannon-Wiener index (Wang et al. 2019), remote sensing (Mohapatra et al. 2019), molecular techniques (Krehenwinkel et al. 2019), bioindicators (Tichit et al. 2010), bioacoustics (Gasc et al. 2015) and presence-absence surveys (Eyre and Leifert 2012); some of these biodiversity assessments require significant resources, cost and time to implement (Miller 2007). Therefore, some methods have been developed to expedite and improve biodiversity assessments for conservation outcomes ( Faith and Walker 1996; Howard et al. 2000; Van Gemerden et al. 2005; Giordani et al. 2009; Butchart et al. 2010; Mace et al. 2012; Calvignac-Spencer et al. 2013; Trivedi et al. 2018; Bakker et al. 2019) using surrogacy approaches such as indirectly counting higher taxa (Gaston and Williams 1993; Balmford et al. 1996a, 1996b; Lee 1997; Balmford et al. 2000; Bertrand et al. 2006), grouping individuals by similarity or recognizable taxonomic units (Ward and Larivière 2004; Ward & Stanley, 2004), eDNA metabarcoding (Pomerantz et al. 2018; Krehenwinkel et al. 2019; McClenaghan et al. 2020), and geodiversity as a surrogate of biodiversity (Parks and Mulligan 2010; Hjort et al. 2012). Further, recent developments in mobile GIS technologies (Akhmetov and Aitimov 2015; Iscan and Guler 2020; Nowak et al. 2020) have been suggested as a potential approach to expediate and improve biodiversity assessments and conservation strategies.
Geoconservation
Geoconservation is an action conserving geodiversity for its intrinsic, ecological and geoheritage assessment value (Sharples 2002; Prosser 2013). Geoheritage is the importance or quality (Diaz-Martinez 2011; Pellitero et al. 2015) of a geoconservation site, and geoheritage assessment is an approach to determine whether geodiversity exhibits scientific, educational, cultural or aesthetic value. A geoconservation site is an area deemed significant based on geoheritage and geoconservation value (Seijmonsbergen et al. 2009). The geoconservation strategy comprises several successive steps to identify, manage and list geoconservation sites: inventorying, assessment using a range of methodological approaches such as geoheritage assessment ranking techniques, conservation, interpretation, and promotion (Brilha 2005; Brilha 2016).
Geoconservation is still in its infancy (Brocx and Semeniuk 2007; Crofts 2019), hindered by subjectivities in geoheritage assessment criteria (White and Wakelin-King 2014), conceptual weaknesses in geodiversity (Serrano and Ruiz-Flano 2007; Soms 2017; Crisp et al. 2020), and the separation of the geoconservation strategy from geodiversity assessment (Brilha 2016). Geoconservation is further limited by the separation of the concepts of geodiversity and biodiversity (Crisp et al. 2022). Novel and robust approaches could facilitate the mainstreaming of geoconservation within nature conservation strategies and conservation literature (Gordon et al. 2017), while biodiversity needs standardized (Klingbeil and Willig 2015) and improved methods to expedite the inventorying and descriptions of species (Grosjean et al. 2015). Biodiversity is widely disseminated in conservation literature (Pereira et al. 2013), while geoconservation is still lagging and underrepresented (Brocx and Semeniuk 2007; Crisp et al. 2020). Review shows that a consolidated approach bridging these noted concepts and methods with geoconservation strategies could complement nature conservation outcomes (Gordon et al. 2017; Crisp et al. 2022).
Combined Geodiversity and Biodiversity Assessment and Consolidated Conservation Outcomes
Research combining geodiversity and biodiversity assessment offers strong practical applications in conservation biology (Toivanen et al. 2019), and by extension in geoconservation outcomes (Crisp et al. 2022). Yet, many scholars still treat each as separate entities in conservation literature (Matthews 2014). The relationship between geodiversity and biodiversity, using remote sensing (Read et al. 2019; Zarnetske et al. 2019; Record et al. 2020) and statistical modeling (Parks and Mulligan 2010; Tukiainen et al. 2017; Read et al. 2019; Zarnetske et al. 2019; Ren et al. 2021) can link geodiversity and biodiversity. For example, Read et al. (2019) used multivariate linear mixed models with spatial random effects to determine which geodiversity predictors account for variation in bird and tree diversity across the USA, and found that elevation variability was the greatest predictor of biodiversity with a consistently positive relationship. However, despite recent contributions, exploring the relationship between geodiversity and biodiversity (Parks and Mulligan 2010; Bétard 2013; Seijmonsbergen et al. 2015; Najwer et al. 2016; Tukiainen et al. 2017; Toivanen et al. 2019; Zarnetske et al. 2019; Read et al. 2020; Record et al. 2020; Kienle et al. 2021; Ren et al. 2021), less work has been done on combining assessment approaches (Crisp et al. 2020; Crisp et al. 2022). In the geodiversity assessment literature, only 12% of studies considered biodiversity in their methodological intentions, and none were linked to geoconservation strategies (Crisp et al. 2020). Geodiversity assessment and geoconservation strategies are recognized as separate research endeavors (Brilha 2016).
An approach combining geodiversity and biodiversity assessment could complement other holistic and widely disseminated endeavors (O’Hagan 2020) such as ecosystem-based management (EBM) (Delacámara et al. 2020). EBM is a management strategy encouraging multiple stakeholders to integrate all ecosystem components, including ecosystem services (ES) into conservation management and decision-making (Monaco et al. 2021). However, the component of geodiversity assessment is often overlooked in ecosystem-based literature (Gray et al. 2013; Fox et al. 2020), with biodiversity being favored (Pereira et al. 2013; Santos et al. 2017). Yet, ecosystems are not only defined by their biological components, but through the interaction of geodiversity and biodiversity (Antonelli et al. 2018). Geodiversity underpins biodiversity (Parks and Mulligan 2010) such as species richness (Hjort et al. 2012; Bailey et al. 2017), and biodiversity underpins ecosystem services and functioning (Edwards et al. 2014). Yet, much of the EBM literature still excludes geodiversity; hence, geodiversity and biodiversity should be treated as equals in holistic policies and ecosystem management endeavors (Gray 2018), with ES within EBM approaches benefiting from an enhanced understanding of the interactions between biotic and abiotic nature (Fox et al. 2020). It seems evident that combining geodiversity and biodiversity assessment could offer many consolidated benefits to EBM outcomes (Toivanen et al. 2019; Crisp et al. 2022).
Efforts to combine geodiversity and biodiversity assessment with conservation strategies such as geoconservation could further complement EBM approaches. Management and conservation processes can be hindered when singular variables or objectives are considered, and consolidated methods or EBM processes are needed to address such challenges (Tallis et al. 2010; O’Hagan 2020; Piet et al. 2020; Crisp et al. 2022). Given the many facets of EBM approaches such as ecological, biological, social and political elements (O’Higgins et al. 2020), standardized methodologies in EBM processes are now encouraged to unify and improve conservation outcomes (Piet et al. 2020). Coastal EBM can be difficult to implement and achieve given the numerous interrelated factors in these systems such as social, economic, and ecological elements; hence, EBM methods accounting for all entities there encouraged (Wongthong and Harvey 2014; Lee and Hsieh 2016; Tan et al. 2018). Further, time-constraints, cost, and complexity can hinder implementation of multiple facets in EBM approaches (Tallis et al. 2010). Therefore, combined geodiversity and biodiversity assessment could help conservationists better cover ecological and biological aspects in EBM processes, while consolidation with conservation strategies such as geoconservation could assist in accounting for other social, economic, and humanistic elements. A unified approach combining geodiversity and biodiversity assessment with conservation strategies could provide a time and cost-efficient approach (Crisp et al. 2022) to complement EBM processes in conservation endeavors.
Objective
This study tests an approach to combine geodiversity and biodiversity assessment with geoconservation strategies (hereafter, ‘consolidation approach’) at three Tasmanian coastal geoconservation sites. In this study we:
- Applied the consolidation approach using ArcGIS mobile digital applications, Survey123 and FieldMaps
- Applied the consolidation approach to assess geodiversity and biodiversity, determine the harbouring capacity of geodiversity for biodiversity, in conjunction with the implementation of a geoconservation strategy
- Considered the effectiveness of the consolidated approach in the conservation and management of vulnerable environments.
Materials and Methods
Study Sites
Coastal environments – the unique and narrow interface between ocean and land (Ramesh et al. 2015) – are complex and mutable environments comprising numerous geological and geomorphological characteristics across diverse temporal and spatial scales (Carapuço et al. 2016). Coastal environments also support sensitive ecosystems and high biodiversity (Muller-Karger et al. 2018), and are home to many endangered species (Ramesh et al. 2015). Coastal environments also support extensive ecosystem services such as fisheries, agricultural lands, and coastal protection (Ramesh et al. 2015) and geosystem services such as habitat provision, cultural, geotourism, aesthetic, and educational values. Further, much of the world’s human population and tourism depends on coastal environments (Gray 2011); hence, they are arguably one of the most sensitive social-ecological systems on earth (Cummins et al. 2014). Therefore, a novel cost-effective and time-efficient consolidated approach was implemented at three Tasmanian coastal geoconservation sites. Tasmanian geoconservation sites have varied shapes and sizes of boundaries (Figs S1–S3), so a traditional transect and quadrat approach could lead to values being missed or unintentionally overlooked, hence, a randomized observation-based approach previously used in Crisp et al. (2022) was used to count species richness and geodiversity elements. To ensure that the entire area of a geoconservation boundary was sampled, in-field navigation was facilitated by the ArcGIS application, FieldMaps. This app displayed a real-time location in the field of the user relative to the geoconservation boundaries (Fig. 2E–F).
Three North-West Tasmanian Coastal Geoconservation Sites
The Don Heads Basalt Landform (Site 1) (Fig. 4A), Penguin Megabreccia (Site 2) (Fig. 4B), and Mersey Bluff Pseudo-Petroglyph (Site 3) (Fig. 4C) geoconservation sites allowed demonstration of how ArcGIS digital applications can be used to expedite, improve, and streamline geodiversity assessment with geoconservation strategies (Williams and McHenry 2020; Crisp et al. 2022). This study further used these sites to trial the consolidation approach (Fig. 1). Each site was selected based on variations in geological type, geographic significance, proximity to urban areas, and geoconservation values (Table 1). Further details regarding these sites can be found in Crisp et al. (2022).
Table 1. Dominant geological type, age, geoheritage significance and relevant values from case study coastal geoconservation sites considered in this study.
Site name | Dominant geology | Period/Age | Site significance | Relevant geoheritage values |
Don Heads | Basalt | Paleogene | State | Scientific, educational, and tourism |
Penguin Megabreccia | Oonah formation | Neoproterozoic | International | Scientific and conservation |
Mersey Bluff | Tasmanian Dolerite | Jurassic | District | Cultural and tourism |
Data Collection
In the Serrano and Ruiz-Flano (2007) geodiversity index, variations in geodiversity elements are counted at each site and subsequently used to determine a geodiversity value; hence, geodiversity value in this study represents the number of geodiversity elements present. This study adopted a similar approach to determine biodiversity, where variations in morphological characteristics were observed within each geoconservation boundary to determine a species richness value; species richness being the total number or count of species in an area (Ahrendsen et al. 2016). Species richness was chosen for this study as it is the most common and intuitive representation of biodiversity (Kery and Plattner 2007; Ahrendsen et al. 2016; Chao and Chiu 2016) and is commonly adopted in conservation processes and priorities (Hellmann and Fowler 1999; Chao and Chiu 2016). Vegetation species were counted by morphological differences such as size, leaf attachment, form, leaf shape, flower color and odor (Wiltshire and Jordan 2009). Bird species were distinguished by morphological characteristics of plumage, size, beak shape and size, feet and call or song acoustics (Menkhorst 2017). Vertebrate species were counted by characteristic differences in scats such as size, shape, content, and texture (Triggs 2004; Wiltshire and Burrell 2018).
Ground-dwelling invertebrates were sampled by establishing ten dry pitfall traps at each of the three sites using the DPW (2013) standard operating procedure of trap size of 10 cm width and 15 cm depth with leaf litter placed at the base, with time being the only variation. This study left the traps for 24 hours to ensure expedition of biodiversity data collection, given that high time requirements currently hinder effective biodiversity monitoring and rapid species richness counts (Miller 2007). There remains no standardized approach in design and duration of pitfall traps, with valid reasons for allowing variations in methodologies (Brown and Matthews 2016). Invertebrate species were identified by morphological differences such as shape, size, symmetry, locomotion, segmentation, number of legs, antenna length, and color (Kotpal 2012).
Consolidation Approach
Three steps contribute to the determination of an overall assessment outcome (Fig. 1): (1) assessment index, (2) assessment ranking tool, and (3) assessment outcome criteria. The first step required assessing species richness, geodiversity, and the sum of visible interactions between geodiversity and biodiversity (see Equation 1).
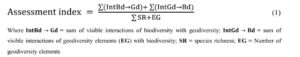
The assessment index comprises the variable, visible interactions, defined as one or more elements of geodiversity or biodiversity visibly attached or affected by one another (Fig S6). The index variable, Int BdàGd, was calculated by counting the number of visible interactions of biodiversity (SR) with geodiversity (EG) (Fig. S6A, D). For example, the count for (IntBd→àGd) in Fig. S6 was 4, since there are four different species interacting with geodiversity elements. Conversely, the index variable, IntGdà→Bd, was calculated by counting the number of visible interactions of geodiversity elements (EG) with biodiversity (SR). For example, in figure S6 the count would be five; first interaction between Astrofestuca sp. biodiversity, rock fragments and sand (Fig. S6A), second interaction between coastal vegetation and a megabreccia rocky shore platform (Fig. S6C), third interaction between seagrass and basalt platform, and fourth interaction between seagrass and hydrological elements (Fig. S6D). The same occurrence of Gdà→Bd was not counted twice, hence Fig. S6B with the interaction between rock fragments and seaweed was not counted as the Astrofestuca sp. already interacts with rock fragments. In the Gray (2013) definition of geodiversity, geological elements include (rocks, minerals, and fossils), while geomorphological elements include (landforms, topography, and physical processes). Geomorphological features were excluded from (GdàBd) due to the scale discrepancy between geomorphology and geodiversity elements. Counts of individual species within one site allowed a count of interactions with individual geodiversity elements and not the landscape upon which all elements sit. Further, soil and hydrological features are consistent abiotic mediums supporting biodiversity globally (Crisp et al. 2022), therefore, abiotic factors such as sunlight, air, soil, and water were attributed a combined value of ‘1’; hence, in the absence of individual geological elements, the value for (GdàBd) should always be ‘1’.
Step two required ranking five criteria (Table S5):
- Degree of geodiversity at the site: Ranked based on values from geodiversity index (Serrano and Ruiz-Flano 2007)
- Degree of biodiversity at the site: A subjective ‘count’ approach was used to determine a rank for species richness. For example, number of morphological characteristics, number of visible interactions, and density of species were considered in determining a suitable rank. Therefore, a site exhibiting very high density of species, high visible interactions and diverse morphological characteristics received a subjective ranking of ‘5’, contrariwise, a value of ‘1’ would be allocated at sites exhibiting sparse density of species, infinitesimal visible interactions, and few morphological differences.
- Interaction value: Ranked based on outcomes from assessment index; a value greater than 0.8 received a rank of 5.
- Degree to which local geodiversity underpins biodiversity: Determined based on visible interactions (Fig S6) between geodiversity and biodiversity. Therefore, sites where many species exhibited a link with geodiversity received a rank of 5.
- Balance of geodiversity and biodiversity: Ranked based on the outcomes from the geodiversity assessment and species richness. For example, a site with very high geodiversity and very high species richness received a rank of 5, and a site with very high geodiversity and very low biodiversity received a rank of 1. A low value would suggest no intrinsic link between geodiversity and biodiversity at the site (Santucci, 2005), and therefore no interaction value.
The third step required ranking 16 conservation criteria (Table S6) recommended by Asaad et al. (2017) to identify areas for biodiversity conservation. Many of the criteria such as species of conservation concern, history stage of biodiversity, and uniqueness and rarity of habitat were performed using an inventory of literature and knowledge of the site (Crisp et al. 2022). Other criteria such as degree to which species interact with geodiversity, vulnerability of species to geoconservation degradation, ecological integrity and others were based on subjectivity and judgement from the data acquired in-field. The criteria used in the third step were influenced by the first two stages. For example, sites exhibiting high overall assessment outcomes were assessed with all criteria (Table S6), criteria C10 to C16 were used for sites with moderate assessment outcomes, and the third step was omitted from sites exhibiting no overall assessment outcome.
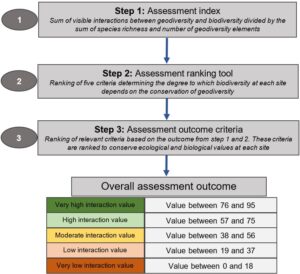
Figure 1. Consolidation approach encompassing the three steps used to determine an overall assessment outcome at each of the geoconservation sites.
ArcGIS Digital Applications
ArcGIS Survey123 was previously used to develop and implement a geoconservation toolkit approach (Crisp et al. 2022). In this study, ArcGIS Survey123 (Figs 2A, D, 3) provided the user interface and in-field app to implement all stages of the consolidation toolkit framework. ArcGIS FieldMaps provided the in-field app to capture the spatial location (Figs. 2E, F, 5) and relevant attributes (Fig. 5) (Tables S2, S3) of geodiversity and biodiversity points. The Survey123 app was separated into two stages, the first (Fig. 2A, D) involved the first two stages (Fig. 1), while the second (Fig. 2) involved implementing a geoconservation strategy and the third stage (Fig. 1). To overcome subjectivities in the consolidation approach such as visual valuation of geodiveristy and biodiversity in-field, the systematic structure provided by each ArcGIS digital application facilitated an objective, guided, and representative approach to consolidated site assessment and field valuation.
Survey123 First Stage: Assessment Index and Ranking Tool
Given the uniqueness of this approach to previous studies, the survey was designed and implemented in ArcGIS Survey123 with the title ‘Omnidiversity Toolkit’ (Fig. 2A), and steps within the consolidation approach (Fig. 1) were titled ‘Omnidiversity Assessment’ (Fig. 2A). In Survey123, the user is prompted to enter the name of the research site (Fig. 2A). Relevant geodiversity data are subsequently collected (Fig. 2B), and when populated a geodiversity index value is automatically calculated (Serrano and Ruiz-Flano 2007). Biodiversity data such as species richness and visible interactions with geodiversity (Fig. 2C) are then collected to determine an assessment index value (Fig. 2C). The app then prompts the user to complete the assessment ranking tool (Fig. 2D) allowing automatic calculation of assessment ranking values.
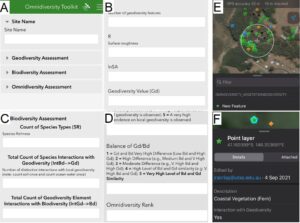
Figure 2. The user interface of Survey123 (A – D) and FieldMaps (E and F) to assess geodiversity, species richness and to automatically populate the first two steps of the consolidation approach. A) Separate tabs for geodiversity, biodiversity, and consolidation approach. B) Geodiversity assessment screen. C) Quantification of species richness and interaction with geodiversity screen. D) Screen to determine assessment ranking value. E Screen to capture spatial location of geodiversity and biodiversity points. F Population of attributes of captured spatial information screen.
Survey123 Second Stage: Assessment Outcome Criteria
Steps 1 to 4 in the second stage of the app (Fig. 3B) required completion of the Brilha (2016) geoconservation strategy. Further explanation of each geoconservation strategy step (Fig. 3B) for each of the coastal geoconservation sites is described in Crisp et al. (2022). In the inventory stage of the geoconservation strategy, the novel term omnidiversity site complements geosite and geodiversity site (Fig. 3A) described in Brilha (2016) and refers to instances where steps 1 to 2 (Figs. 1, 2A, D) rank from high to very high. Sites less than high were deemed geodiversity sites or geosites using the traditional Brilha (2016) approach.
At omnidiversity sites, the app prompts the user to implement both the geoconservation strategy (Brilha 2016) and consolidation approach (Fig. 1). At geodiversity sites or geosites, the application only prompts the user to implement the traditional geoconservation strategy (Brilha 2016). The assessment index and assessment ranking tool from the first two steps (Fig. 3C) determines the assessment outcome criteria use in the application (Fig. 3D). For example, a moderate overall assessment outcome includes ranking of C10 to C16 (Tables 2, S6), while high overall assessment outcome included all sixteen criteria (Tables 2, S6). Assessment outcome criteria (Table S6) change as geoconservation sites not exhibiting high interaction value between geodiversity and biodiversity do not require additional measures to conserve biodiversity. Further, the geoconservation strategy also influences assessment outcome criteria (Figs. 1, 3D). For example, if scientific value is assessed as relevant at a site, C10: vulnerability of species if scientific values absent, will be included. When values are not relevant, corresponding criteria are excluded. The application subsequently calculates the overall assessment outcome based on Equation 2.
![]()
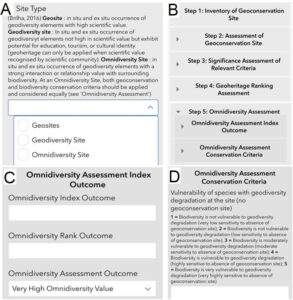
Figure 3. The user interface of the omnidiversity approach adapted in Survey 123. A) Step one of the geoconservation strategy prompting population of site type. B) The five separate steps to implement each stage of the geoconservation strategy and consolidation assessment criteria. C) Interface for assessment index, assessment ranking tool, and overall assessment outcome. D) Interface for assessment outcome criteria to determine final value for overall assessment outcome at the site.
Results
Site Reconnaissance
Site 1 (444000E, 5443389N) features the Tertiary basalt headland, basalt stack, and base of a cliff (Table 1) (Fig. 4A). Site 2 (423192E, 5447997N) features Beecraft megabreccia and sedimentary matrix deposits representative of a deposit close to the foot of a Cambrian escarpment (Bradbury 1994; Crisp et al. 2022) (Table 1) (Fig. 4B). Site 3 (446044E, 5443419N) features the exposed dolerite at the northern headland of the site (Table 1) (Fig. 4C).
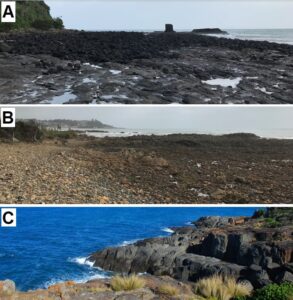
Figure 4. Imagery captured from each of the three coastal geoconservation sites during a site survey. A) Northwest facing view of Don Heads Basalt Landform geoconservation site (444000E, 5443389N). B) West-facing view of Penguin Megabreccia geoconservation site (423192E, 5447997N). C) East facing view of Mersey Bluff Pseudo-Petroglyphs geoconservation site (446044E, 5443419N).
Consolidation Approach Outcomes
Site 1 (Fig. 4A) showed the highest geodiversity (43.7) and species richness (141) compared to other sites (Table 2). Site 1 also exhibited extensive interactions between geodiversity and biodiversity (120), and a high overall assessment outcome (Table 2). Conversely, Site 3 (Fig. 4C) showed the lowest geodiversity (7.3) and species richness (89) and exhibited few interactions (28); therefore, the site ranked with a low assessment outcome and was not deemed an omnidiversity site (Table 2). Site 2 (Fig. 4B) featured the second-most abundant species richness (107) and geodiversity (40.5), exhibiting fewer interactions (76) compared to Site 1, therefore, the site was deemed a moderate omnidiversity site (Table 2).
Both Site 1 and 2 showed similarities in biodiversity conservation criteria, with both sites ranking at 1 for C6 and C5 (Tables 2, S6). However, Site 1 ranked higher for C1 given the presence of sensitive species such as the little penguin, Eudyptula minor. The biodiversity at both Site 1 and 2 exhibited high sensitivity to geodiversity degradation (Tables 2, S6). Overall, the biodiversity at Site 1 exhibited a very high dependence on geodiversity, while Site 2 exhibited a moderate dependence (Tables 2, S6). Site 1 was highly representative of the interaction between geodiversity and biodiversity, while Site 2 had only some features representative of the interaction between geodiversity and biodiversity (Tables 2, S6).
Table 2. The data acquired from the implementation of the consolidation approach at each of the geoconservation sites.
Omnidiversity Index and Ranking Assessment | ||||
Parameters | Don Heads Basalt Landform | Penguin Megabreccia | Mersey Bluff Pseudo-Petroglyphs | |
Geodiversity Assessment | Eg (number of geodiversity elements) | 12 | 12 | 5 |
R (roughness index) | 6.3 | 7.3 | 4.5 | |
lnSA (surface area km2) | 0.179 | 0.117 | 0.048 | |
Gd (geodiversity value) | 43.7 | 40.5 | 7.3 | |
Biodiversity Assessment | SR (species richness) | 141 | 107 | 89 |
Bd – Gd (interaction value between biodiversity and geodiversity) | 112 | 71 | 25 | |
Gd – Bd (interaction value between geodiversity and biodiversity) | 8 | 5 | 3 | |
Consolidation Toolkit Outcomes | Assessment index value | 0.851 | 0.710 | 0.298 |
Degree of Geodiversity | 4 | 4 | 1 | |
Degree of Biodiversity | 5 | 3 | 3 | |
Interaction value | 4 | 4 | 2 | |
Gd underpinning Bd | 5 | 3 | 2 | |
Balance of Gd/Bd | 5 | 3 | 2 | |
Sum of assessment ranking criteria | 23 | 17 | 9 | |
Outcome of index and ranking values | Very High Od | High Od | Low Od | |
Omnidiversity Conservation Criteria Assessment | ||||
Assessment Outcome Criteria | C1 | 2 | 1 | N/A |
C2 | 5 | 3 | N/A | |
C3 | 3 | 3 | N/A | |
C4 | 5 | 3 | N/A | |
C5 | 3 | 3 | N/A | |
C6 | 1 | 1 | N/A | |
C7 | 4 | 3 | N/A | |
C8 | 5 | 4 | N/A | |
C9 | 4 | 4 | N/A | |
C10 (M) | 4 | 4 | N/A | |
C11 (M) | 3 | N/A | N/A | |
C12 (M) | 3 | N/A | N/A | |
C13 (M) | 3 | 3 | N/A | |
C14 (M) | N/A | 3 | N/A | |
C15 (M) | 4 | N/A | N/A | |
C16 (M) | N/A | 3 | N/A | |
Odcriteria | 49 | 38 | N/A | |
Overall assessment outcome value | 61.27 | 39.05 | N/A | |
Overall assessment outcome category | High Omnidiversity | Moderate Omnidiversity | Failed omnidiversity site | |
Acquisition of Biodiversity and Geodiversity Data using Digital Applications
Biodiversity and geodiversity data collected using the mobile apps were viewed as a final map in ArcGIS Online (Fig. 5). The data uploaded to ArcGIS Online from Survey123 and FieldMaps also contains associated attribute information (Fig. 7). For example, the captured consolidation toolkit framework data points from Survey123 contain attribute information about assessment index, assessment ranking tool, conservation criteria and the geoconservation strategy (Figs. 5, 6). The data (Table 2) complements existing Tasmanian databases such as the Natural Values Atlas through the provision of attribute information about geoheritage value, geodiversity, biodiversity and now a consolidation approach, often lacking from many existing databases (Crisp et al. 2022). This captured geoheritage and attribute information can be spatially aligned at each geoconservation site (Figs. 5, 6), and subsequently merged with existing databases such as the Natural Values Atlas and The Land Information System Tasmania (Crisp et al. 2022).
Corresponding with high geodiversity (Table 2), Site 1 contains a range of geological features across ~2 km of coastline (Fig. S4). The site is predominantly made up of erosional and accumulation landforms, followed by geomorphological and generic geological structures (Fig. S4) (Table S7). The high species richness mostly includes coastal vegetation and invertebrate species (Table S7). Site 2 also contains a range of geological features over ~4 km of coastline (Fig. 4B), with erosional landforms and hydrological features (Fig. S5) (Table S7). The species richness at Site 2 comprises mostly of coastal vegetation and invertebrate point features (Table S7). Site 3 includes geomorphological, soil and stratigraphic features (Fig. 5) (Table S7) but contains few hydrological features (Fig. 5) (Table S7). The species richness at Site 3 includes coastal vegetation species, followed by an equal distribution of vertebrate and invertebrate species (Table S7).
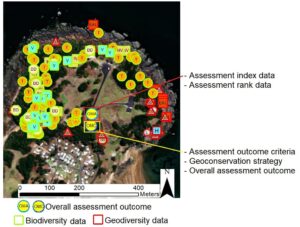
Figure 5. Example of all data captured from ArcGIS Survey123 and FieldMaps compiled into one map at Mersey Bluff Pseudo-Petroglyphs geoconservation site, uploaded to ArcGIS Online, with geodiversity, biodiversity and consolidation approach included (© ESRI background aerial imagery).
Spatially located biodiversity and geodiversity point features also stored relevant attribute information. In this case, a geodiversity point stored a photograph, description of the geological elements, and whether this feature exhibited any interaction with local biodiversity (Fig. 6). This attribute information, in conjunction with the spatially located point feature, would then upload to ArcGIS Online and could subsequently be merged with other relevant databases such as the Tasmanian Geoconservation Database (Crisp et al. 2022). The consolidation approach data points captured in-field using Survey123 (Fig. 5) also stored the survey results (Tables 2, S4, S5, S5) as attribute information.
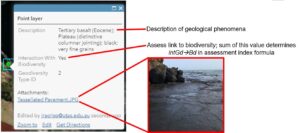
Figure 6. Example of the associated attributes of each biodiversity or geodiversity points captured in-field displayed using ArcGIS Online.
Discussion
This study trialed a novel approach to combine geodiversity and biodiversity assessment with geoconservation strategies at three Tasmanian coastal geoconservation sites using ArcGIS FieldMaps and Survey123.
ArcGIS Digital Applications
ArcGIS Survey123 and FieldMaps were used to facilitate the consolidation approach demonstrating a viable way to spatially acquire geodiversity and biodiversity data with efficiency (Figs. 5, S4, S5). They enhanced capture of attribute information and information access (Fig. 6), streamlined combined geodiversity and biodiversity assessment (Fig. 2), and consolidated geodiversity and biodiversity assessment with geoconservation strategies in-field (Figs. 2, 3; Tables 2, S1, S5, S6). The ArcGIS digital applications provided the software capabilities to consolidate disparate concepts and methods in-field (Figs. 2, 3; Table 2) and reduced the cost and time required to acquire spatial information and attributes regarding geodiversity, biodiversity and geoconservation values (Figs. 2, 3; Tables 2, S1, S4). Approaches that reduce cost and time in conservation processes could greatly benefit conservation outcomes for biodiversity, geodiversity, and EBM approaches (Whittaker et al. 2005; Tallis et al. 2010; Hjort et al. 2012; Crisp et al. 2022).
Unification and Facilitation of Geoconservation Strategy
The consolidation approach facilitated geoconservation outcomes through unification of disparate geoconservation strategy steps (Brilha 2016) into a streamlined method (Fig. 3). Survey123 facilitated a unified approach to inventory the geoconservation sites (Figs. 3A, 4) and facilitated addition of a novel omnidiversity site step. There is still disagreement in the literature about the nature of the intrinsic relationship between geodiversity and biodiversity. For example, some scholars state that high species richnesses are likely to be observed in areas with high geodiversity such as topographic heterogeneity (Rahbek and Graves 2001; Kreft and Jetz 2007; Buckley and Jetz 2008; Zarnetske et al. 2019), while others state exceptions to this. For example, in south-western Australia high floral diversity is observed in areas exhibiting lower geodiversity (Crisp et al. 2001; Boothroyd and McHenry 2019). Therefore, omnidiversity site was developed to facilitate scholars in distinguishing sites where relationships of varying nature occur between geodiversity and biodiversity. In this study, the omnidiversity site step successfully distinguished varying relationships between geodiversity and biodiversity; Site 1 with high geodiversity and high species richness, Site 2 with high geodiversity and moderate biodiversity, and Site 3 with lower geodiversity and lower biodiversity (Table 2). Currently, geoconservation strategies conserve geosites for their scientific value, while geodiversity sites are conserved for educational, tourism or cultural values (Brilha 2016). Inventory steps do not currently conserve geodiversity for their capacity to harbor or facilitate biodiversity (Crisp et al. 2022). Yet, geodiversity and biodiversity are intrinsically linked, and understanding of the nature of the interaction between both elements complements EBM approaches (Fox et al. 2020) and enhances conservation outcomes (Toivanen et al. 2019). Therefore, early steps required determination of whether the site was a geosite, geodiversity site or an omnidiversity site (Fig. 3A). The digital applications also facilitated succeeding steps in the geoconservation strategy such as geoheritage assessment, interpretation, and promotion (Brilha 2005; Brilha 2016). Survey123 facilitated the selection of suitable geoheritage conservation criteria to implement at each site (Fig. 4B; Table S1), providing an approach to overcome the miscellany of conflicting criteria currently used in geoheritage assessment (Crisp et al. 2022). The spatial representation, automatic uploading of data to the ArcGIS Online database, visual representation of captured data in-field while using applications, and the structured and unified approach to collect attribute information facilitated enhanced interpretation and promotion (Figs. 5, 6, S4, S5; Table 2).
Consolidated Conservation Outcomes
Sites 1 and 2 exhibited high species richness and a high interaction value between the elements of geodiversity and biodiversity (Table 2). In the absence of a consolidated approach and using a traditional geoconservation strategy, the elements of geodiversity at these two sites would have been conserved only for their scientific and other added values. Scientific value criteria in geoheritage infrequently consider biotic value, with most methods adopt subjective approaches to rank biodiversity (Crisp et al. 2022). A traditional geoconservation strategy at Site 1 would have resulted in conserving geodiversity without recognizing that its biodiversity exhibited a very high dependence on local geodiversity (Tables 2, S6). Ecological integrity and ecosystem function depend on geodiversity conservation (Tables 2, S6), and there are species of conservation concern inhabiting unique and rare habitats such as the Little Penguin, Eudyptula minor (Tables 2, S6). Therefore, evidence suggests that the consolidation approach added new dimensions to geoconservation planning and management (Anderson et al. 2015; Santos et al. 2017). Biodiversity and geodiversity being intrinsically linked (Santucci 2005), the degradation of geodiversity would result in direct impacts to concomitant biodiversity.
Site 2 exhibited extensive geological history, representativeness, close proximity to urban areas, and a range of rare and special geological features (Tables S1, S4). Close proximity (< 1 km) from urban areas (Crisp et al. 2022) and the high interaction value (Table 2) between geodiversity and biodiversity would suggest vulnerabilities to continued urban expansion (Tables 2, S6). The megabreccia of international significance meant that site biodiversity was linked to the high-ranking geohistorical importance at the site. In a Tasmanian context, the geological features are rare (Bradbury 1994; Seymour and Vicary 2010; Moore et al. 2015; Crisp et al. 2022) (Tables S1, S4), hence, the high interaction value (Table 2) between geodiversity and biodiversity would suggest potentially rare interactions and dependencies between both elements at the site. Therefore, the consolidation approach also ranked the extent to which ecological integrity and vulnerability of species depends on the conservation of geodiversity as high (Tables 2, S6).
The consolidated approach showed by contrast that Site 3 is not an omnidiversity site given the low interaction value between the moderate species richness and geodiversity (Table S5). Therefore, the geodiversity site was determined to be eligible for geoconservation value and protection based on cultural values (Fig. 4A; Table S4), with doleritic rock carvings linked to Tasmanian Aboriginal history and the presence of the oldest Aboriginal operated museum in Australia, Tiagarra (Crisp et al. 2022). The consolidated approach suggests that biodiversity at the site is less sensitive to geodiversity degradation (Tables 2, S5). Lower species richness and interaction value (Table 2) could be attributed to the proximity of degraded zones from anthropogenic influences, with roads, footpaths, carparks, and buildings situated close to surrounding biodiversity and geodiversity (Figs. 5, S2).
Improved Assessment and Management of Vulnerable Environments
Site 3 accentuates the benefits and applicability of the consolidation approach (Figs. 2, 3) (Table 2) in environmental assessments. Low species richness at the site could be attributed to the proximity of multiple anthropogenic influences such as the absence of fencing to separate vulnerable geology from visitors (Crisp et al. 2022). Based on the Environment Protection and Biodiversity Conservation Act (EPBC) 1999 in Australia, the anthropogenic influences at Site 3 would have required an environmental assessment prior to construction plans and implementation; however, geodiversity and geoheritage value were likely not considered given that the EPBC Act does not include standardized criteria and methods on geoheritage and geodiversity (Brocx and Semeniuk 2007; Brocx 2020). Therefore, evidence suggests that consolidated approaches in conservation processes (Figs. 2, 3; Table 2) could greatly benefit environmental assessments.
The consolidation approach provided information about geodiversity and biodiversity and the degree to which these interacted (Tables 2, S5, S6), in conjunction with various relevant conservation criteria (Tables S1, S4). Site 1 showed that surrounding elements of geodiversity were highly vulnerable and sensitive to degradation using relevant geoheritage assessment criteria (Tables S1, S4), and the corresponding significant interaction value (Table 2) suggested vulnerabilities of biodiversity to changes or degradation in geodiversity (Tables 2, S5, S6). Holistic benefits to assessment and management of vulnerable environments are evident when adopting the consolidation approach.
Many interrelated factors in coastal zone management hinder its implementation given time-constraints, cost, and complexity of methods (Tallis et al. 2010). EBM has become the most dominant approach used in environmental management and conservation, yet the holistic and multi-faceted nature of EBM presents some challenges in its implementation (O’Higgins et al. 2020). The consolidation approach provides a viable contribution to complement EBM processes, with streamlined geodiversity and biodiversity assessment including interaction values (Figs. 2, 3; Table 2), and consolidated geoconservation and biological conservation outcomes (Fig. 3; Tables 2, S1, S6). Development of a tool combining geodiversity and biodiversity assessment in geoconservation strategies is needed (Brocx and Semeniuk 2007) to complement current holistic approaches in conservation such as EBM. Geodiversity is often excluded from EBM literature (Gray 2018), yet ecosystems are better defined in conservation literature through understanding of the interaction between geodiversity and biodiversity (Parks and Mulligan 2010). Geodiversity and biodiversity should be treated equally in EBM conservation processes (Gray,2018; Fox et al. 2020; Crisp et al. 2022), with their consolidation offering strong practical applications in conservation literature (Toivanen et al. 2019).
Omnidiversity – a Novel Approach to Consolidated Conservation Outcomes
Omnidiversity is a new term introduced to describe the novel consolidation approach developed and trialed in this study. Omnidiversity, is an approach to bridge the gap between geodiversity and biodiversity assessment, defined as “A consolidated approach to assess geodiversity and biodiversity, determine the harboring capacity or interaction value of geodiversity for biodiversity, and the assessment of relevant conservation criteria in vulnerable environments and ecosystems”. It complements other conservation endeavours such as EBM approaches (Tallis et al. 2010; Gordon and Barron 2012; Gray et al. 2013), natural diversity (Santos et al. 2017), ecological diversity (Comer et al. 2015) and conserving nature’s stage (CNS) (Hjort et al. 2015; Lawler et al. 2015). Natural diversity is a related term and describes the combination of biological and physical elements in nature (Santos 2017) and is synonymous with the term, ecological diversity (Comer et al. 2015). Unlike ‘geodiversity assessment’, ‘biodiversity assessment’ or ‘ecosystem assessment’, no publications have contributed to ‘natural diversity assessment’ (Crisp et al. 2020), despite natural diversity in conservation literature potentially providing better indications of conservation value (Santana, 2019). Further, ecosystem ‘assessments’ and EBM under-represent and undervalue the contribution of geodiversity (Gray et al. 2013). Omnidiversity provides the first concept and approach consolidating geodiversity and biodiversity assessment with conservation strategies such as geoconservation (Fig. 7). The CNS approach is a strategy protecting biodiversity by conserving and maintaining geodiversity (Beier et al. 2015), therefore, omnidiversity could provide CNS scholars with a new approach to complement the CNS strategy.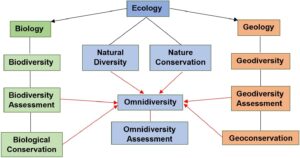
Figure 7. Interconnectedness and relationship of existing terms biodiversity, geodiversity, natural diversity, and conservation to the novel omnidiversity and omnidiversity assessment terms.
Current Research, Limitations, and Future Directions in Omnidiversity Approach
The consolidation approach supported in this study (Figs. 3, 4; Tables 2, S1, S5, S6) provides the novel approach of omnidiversity in the effective assessment and management of vulnerable environments. Subsequent research is required to further explore the applicability of omnidiversity in other conservation research endeavors such as CNS and EBM. This study was limited to coastal environments, and further study could consider other vulnerable environments such as karst systems (Dixon and Duhig 1996; Shi et al. 2019). Cliff environments provide biodiversity with protection from predators, and plant biodiversity a surface to attach at higher elevations, and cliffs often facilitate high densities for seabird congregations (Hjort et al. 2015; Larson et al. 2000). Talus scree provide habitat for small mammal, reptile, amphibian and other invertebrate species (Hjort et al. 2015; Ruužička et al. 2012), and considerable biodiversity inhabits the hydrological and nutrient regime that develops in rock pools (Hjort et al. 2015).
Subsequent research could assess interactions of the assessment index (Fig. 1) using statistical models and relationships with associated conservation values. Statistical models exploring the relationship between geodiversity and biodiversity assessment are limited by disparities in geodiversity and biodiversity index parameters (Seijmonsbergen et al. 2015). Consolidated geodiversity, species richness, and interaction value assessment parameters would benefit and improve statistical power in models exploring the relationship between geodiversity and biodiversity (Hjort et al. 2012; Bailey et al. 2017, 2018; Tukiainen et al. 2017), and subsequent research could explore potential benefits of omnidiversity to modelling in geodiversity and biodiversity assessment.
Species richness was determined using a count-method. Therefore, the current approach likely underestimated species presence at each site (Gibson 2011; Gotelli and Colwell 2011; Madalozzo et al. 2017), exacerbated by the absence of an account of seasonal or temporal fluctuations of biodiversity (Shimadzu et al. 2013), and the absence of traditional field-based approaches such as transects and quadrats (Geml et al. 2009; O’Hara et al. 2010; Gibson 2011; Malik et al. 2019). However, data acquired still supported the objective of the study to develop and trial a novel approach and more representative species counts would only further justify the findings, evidenced by the high geodiversity and biodiversity already acquired, extensive interactions between geodiversity and biodiversity, and conservation values found (Tables 2, S4). Mobile digital applications, given their support for enhanced recording and monitoring of the presence and location of species and associated attributes (Teacher et al. 2013; Chandler et al. 2017; Luna et al. 2018) facilitated the alternative count-method to other traditional biodiversity assessment approaches. For example, opportunistic sampling using digital tools is widely used by volunteers such as citizen scientists (Luna et al. 2018; Kelling et al. 2019; Callaghan et al. 2020; Henckel et al. 2020; Nowak et al. 2020) to monitor species, and recently geodiversity (Williams and McHenry 2021; Crisp et al. 2022); review shows omnidiversity, as it stands (Figs. 3, 4; Tables 2, S1, S5, S6), is a promising tool to consolidate and enhance current geodiversity inventorying and biodiversity monitoring approaches. Therefore, subsequent methodological developments may include implementation of jackknives or bootstrap estimators to account for species underestimation (Hellmann and Fowler 1999; Oertli et al. 2005), account for seasonal variation of species, inclusion of traditional field-based methods, and other conservation strategies.
ArcGIS Online is a subscription service requiring fees to activate all mobile GIS application features, and ArcGIS tools have not been developed to meet the specific needs of both the geoscientific and biological community (Crisp et al. 2022). Such software limitations of the omnidiversity approach could be resolved by developing a third-party digital application to better encapsulate software needs, universal availability and interaction with EBM and other conservation applications in biological and nature conservation.
Conclusions
This study introduced and trialed a novel omnidiversity approach at three Tasmanian coastal geoconservation sites using the ArcGIS mobile digital applications Survey123 and FieldMaps. Omnidiversity provided a time and cost-effective method to simultaneously assess geodiversity and biodiversity, determine the harboring capacity of geodiversity for biodiversity, and facilitated effective implementation of a geoconservation strategy through unification of disparate steps into one streamlined approach. Previously, the geodiversity at omnidiversity sites was conserved only for its geoheritage importance. With implementation of omnidiversity at omnidiversity sites, geoheritage importance, harboring capacity of geodiversity, and the vulnerability of biodiversity to changes in geodiversity were effectively identified using a unified approach. This study demonstrated that omnidiversity would facilitate effective assessment and management of other vulnerable environments, and review indicated potential to benefit other holistic approaches such as ecosystem-based management and conserving nature’s stage. With the intrinsic relationship between geodiversity and biodiversity, the exclusion of geodiversity from contemporary EBM processes, and the need for time and cost-efficient approaches, omnidiversity is demonstrated as a viable contribution to facilitate conservation outcomes. However, this novel concept needs further methodological development and augmentation with other conservation strategies such as biological and nature conservation. Subsequent research could also develop an optimized third-party digital application to provide greater versatility for integration with other holistic approaches such as ecosystem-based management, and subjectivities in conservation criteria could be alleviated using statistical validation and optimization techniques.
Declaration of conflicting interests
We the authors declare no conflict of interest for this research.