Introduction
Geodiversity, also called geological diversity, encompasses a range of phenomena related to the earth's surface, from minerals, fossils, and soil to landform erosion, sedimentary structures, dynamics, and tectonic features. It has left a mark on the ground. The heterogeneity of the earth's surface is caused by a great variety of geological phenomena. Geodiversity has been widely discussed, and Kozlowski (2004) compared geodiversity and biodiversity, considering these two as pivotal parts of sustainable development and presented some goals for the future of land conservation. In recent years, geodiversity studies have also provided the basis for the development of geo-heritage studies. Gordon and Barron (2011) conducted a study on geodiversity in Scotland that evaluated its contribution in providing services to society. Ruban (2016, 2021) presented excellent work on the geological heritage of Egypt and Poland.
New technology was applied to the evaluation of landforms. Liu et al. (2006) assessed land sustainability based on the Geographic Information System in the Qinling Mountains of China using satellite imagery and field observations combining hydrology, climatic, topography, soil, and land cover, and proposed land suitability for optimal use. Zwolinski (2008) provided a new method for mapping the geodiversity of landforms in the Carpathian Mountains, in which he used GIS to prepare a geodiversity map by overlaying maps of energy, fragmentation, and landform conservation.
Luo et al. (2012) used geomorphometric analysis of soil properties to classify the geomorphological landforms of regions in China, showing that these improved the performance of land surface identification because geological criteria alone cannot provide an accurate classification. They also stated that uncertainty in identifying landforms can be controlled by high-resolution spectral analysis of satellite images. Giardino et al. (2013) investigated the impact of human stress on geodiversity in the Susa Valley Mountains of the Alps. They aimed to improve knowledge of geodiversity management with robust understanding of natural hazards to lower local vulnerability to disasters and support sustainable development.
Najwer and Zwolinski (2014) presented a new method for evaluating the components of the natural environment in response to the definition of geodiversity, identifying a number of "geomorphic criteria” such as topography, relative elevation convergence index, landform energy, geology, and hydrographic principles. These are evaluated using the MEC multiple criteria evaluation method to produce a final map of geodiversity landforms. They concluded that the two valleys of Ilgraben and Drbrance in the mountains of Switzerland and Poland could be considered geological sites of natural importance.
Sepehr (2014) stated the laws of stability governing non-equilibrium conditions in geosystems based on Lyapunov theory and nonlinear thermodynamics. He concluded that self-regulation due to energy loss in the system, spatial patterns, and chaotic behaviors in the non-equilibrium range and the dynamics of these behaviors could be used to predict the response of the geosystem to environmental disturbances. Melelli et al. (2017) examined the criteria and indicators of geodiversity, which show that landforms are broadly heterogeneous in thematic maps at any scale and visual solutions.
Soil quality is critical. Stavi et al. (2019) examined the effects of geodiversity on soil quality, concluding that soil's physical, chemical, and biological properties in heterogeneous areas are better than in homogeneous regions and areas with high geodiversity are more resistant to changing biological conditions. Gakaev et al. (2021), by ecological and geomorphological analysis of ecosystems in the mountainous part of the Chechen Republic, found that geomorphological activities have been dominant in soil formation in mountainous areas. Therefore, in many of the mentioned areas, the imbalance caused by the irrational use of land resources has increased the intensity of geomorphological processes during the last century, which is irreversible. Ghahroudi et al. (2022) evaluated the amount of geodiversity and diversity of sites upstream of Karaj Dam with the aim of environmental management. They concluded that tectonic and geomorphological geo-sites have the least resilience and the most vulnerability to destructive factors.
There has been limited research on the landforms and geodiversity of the Kopet-Dagh zone in Iran, except for the geodiversity map of Mashhad by Batajrobeh et al. (2017). The study we present here is the first step to creating a primary database for studying the geodiversity of the eastern Kopet-Dagh zone and is a practical step in protecting the most valuable and vulnerable high-risk places. Our key question is how to assess geodiversity based on the degree of sensitivity, the amount of equilibrium, and resilience of the geosystem. To answer this question, we must be familiar with the geosystem's thermodynamic structure and the concepts mentioned above. Here, we attempt to summarize the primary information extracted from study sources along with field studies by preparing basic maps based on appropriate indicators, classification, and overlaying of maps to answer this question.
Theoretical Foundations
The term 'geodiversity' was first used in 1993 as the geological equivalent of biodiversity. It has gained international acceptance and usage in recent years and warrants the status of a geological paradigm (Gary 2008). One of the best definitions of geodiversity is provided by Stanley (2000), who shows that land diversity includes various geological environments and phenomenal and active processes that form the framework of life on the Earth; he also argues that geodiversity is the link between humans, their landforms, and their cultures through the interrelation between soils, minerals, rocks, fossils, and active processes and built environments. Rollinson (2007) argued that geodiversity and its evolution reflect that the earth initially had a homogeneous and chondritic composition that gradually changed and diversified over time. Some scientists believe that the most diverse development occurred in the continental crusts and the early stages of plate tectonics, causing the formation of rocks, minerals, mountain formation, and other similar phenomena. Researchers such as Taylor and McLennan (1985), Collerson and Kamber (1999), Condie (2000), and Rollinson (2007), identified the Archean (about 2.5–3.5 billion years ago) as the beginning of continental growth. Therefore, the greatest global geological diversity is related to this time.
Since 2000, the basic topics of geodiversity have expanded and related various features such as geology, geomorphology, soil, and their relationship to natural systems (Gray 2004, 2008). The physical components of the planet, such as fossils, minerals, groundwater, glaciers, landforms, volcanoes, soils, lakes, and marine basins, are all considered part of the Earth's diversity. Geodiversity has been defined by Gray (2004), Zwolinski (2008), Serrano and Ruiz Flano (2007), and the Australian Natural Heritage Charter provides its most common concept. All these issues related to geodiversity have been accepted by all countries, and many authors have tried to expand it, including Brilha (2005, 2018), Gray et al. (2013).
Geomorphological principles show that the earth's surface is not fixed and that everything changes and evolves. Accordingly, the difference in the landforms of each environment is a function of the difference in the structure, process, and time of change, the principles of the Davis model, quoted by Yamani (2013).
Analyzing the equilibrium and resilience of landform elements based on the degree of sensitivity is important because landform sensitivity indicates the flexibility or instability of process systems in response to externally forced changes. Landforms with high internal diversity usually contain shapes and materials from very different ages and are sensitive to changes (Thomas and Allison 1993; Phillips 1999; Thomas 2012), which promotes biodiversity. At the same time, high diversity small-scale decreases rangeland vulnerability to drought and climate change and is important for projects to rehabilitate degraded land and degraded ecosystems. From the above, it can be concluded that geodiversity is highly dependent on scale. Therefore, landform sensitivity is related to its erosion pattern and identifies the part of the geosystem that is affected by stress but has low resistance due to environmental characteristics, based on repetition time intervals, size, and dynamic space/time distribution of the system. In other words, landform sensitivity is an elastic term that can be adapted to different contexts of land use change, geomorphological evolution or assessment of geo-site visit capacity (Naveh and Lieberman 1990; Thomas and Allison 1993). With the increase in the number and variety of natural hazards, the current approach has shifted from an emphasis on reducing vulnerability to a resilience-to-hazards approach. Thresholds and turbulences, while destroying the physical structure of the geosystem, are also an essential part of its dynamics (Saffari and Gholizadeh 2018).
The concept of landform sensitivity derives from dynamic geomorphology or processes that change landforms in shorter periods (such as flood, drift, flood, erosion, dissolution, and similar factors). In contrast, evolutionary geomorphology analyzes landforms through steps to remove relief. Sensitivity emphasizes the ability of landforms to withstand change too. Sensitivity analysis is also designed to measure the Earth's tolerance to change quantitatively. Since the sensitivity of the system is a function of its inherent resilience, it is not appropriate to try to understand the criteria of sensitivity or vulnerability through statistical criteria, and it is better to put such issues in an evolutionary framework and pay attention to one of the main aspects of a stable system, namely its mean resilience. Reducing the tolerance of geosystems has led to the detection and creation of unstable states and conditions, so sustainable geosystem management strategies should focus on reducing the sensitivity of geosystems and maintaining their resilience thresholds and tolerance. Resilience or elasticity is the rate at which an echo/geosystem returns to equilibrium after changing conditions and turbulence. In other words, resilience means the ability to rebuild, flexibility, adaptability with recovery, or the ability of the system to withstand turbulence, post-turbulence recovery, and adaptation and change in response to turbulence for stability (Tooth 2018; based on Alberti 2008). Resilience is the extent to which a system can withstand change before being rebuilt with a new set of structures and processes (Parivar et al. 2018). From a geomorphological point of view, resilience is defined as the ability to recover and is associated with dynamic stability before turbulence (Phillips 2011). Because the concept of resilience is used to analyze changes in response to a range of spatial and temporal scales, it depends on the fundamental capacity of an eco/geosystem in the face of environmental fluctuations and human exploitation (Folke et al. 2004).
In geomorphology, to achieve the equilibrium of landforms, the equilibrium can be considered as the balance of matter or energy in the landform or land levels concerning the balance of destructive and compressive forces per unit of time. The linear and nonlinear responses of geosystems on a time scale change the landscape in the landforms of the earth's surface. Such changes reflect the response of geosystems to achieve sustainability and therefore diversify landforms. The existence of equilibrium in the geosystem does not mean that there is no change in it, but it means that despite the existence of fluctuations, because these fluctuations are around a certain axis, it is observed as a temporary stable state in the geosystem (geosystems experience instantaneous steady-state conditions in unbalanced conditions near thresholds). The slightest change in system information changes the energy flow of the system, and the system's response to finding a new equilibrium point with high entropy creates a new perspective in the geosystem. In closed systems, there will always be a stable equilibrium (high energy and low entropy to low energy and high entropy). A geomorphic system is a range with a definite boundary, consisting of subsystems whose overall structure is cohesive and integrated. Any change in the subsystems affects the coordination of its performance. In geosystems, which are open systems (non-equilibrium thermodynamics), there is a temporary stable state due to the exchange of matter and energy with the environment, which causes its loss and reduction in the system. Due to increased input energies or decreased resilience, the geosystem is out of equilibrium to non-equilibrium, it gradually becomes unstable, and in this case, the shaping processes will cause deformation and erosion of the landform (Fig. 1). Therefore, the lower the system’s energy or its entropy, the greater the resilience, and the greater the resilience, the longer it will take for the face of the earth to change.
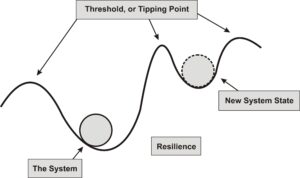
Figure 1. Equilibrium and non-equilibrium curves. The sphere represents the geosystem, and the valley indicates the state of the geosystem over time. The sphere’s position and the basin’s shape are constantly changing due to external conditions. Theoretically, the sphere tends to slide down the valley towards the equilibrium regime, and if the sphere moves beyond the edge of the valley, called the threshold, it will change the geosystem regime.
Study Area
Kopet-Dagh is a mountainous region in which late Alpine tectonic stages significantly shaped its present-day appearance. The study area is a long strip in the north of Khorasan Razavi Province, with an area of 19241.92 km2, it has a geographical position of 59º 36 '56 "to 61º 14' 58" east longitude and 35 º 14 '05 "to 37º 07' 58" north latitude. The average annual rainfall is about 100 to 400 mm, and its height varies from a minimum of 251 m to a maximum of 2623 m (based on the statistical data of Khorasan Razavi synoptic stations), which includes parts of the cities of Mashhad, Sarakhs, Kalat, Torbat-e Jam, Torbat-e Heydarieh, and Fariman. Extreme changes in temperature, heavy seasonal rains, and intense monsoon winds are among the important climatic factors that play an active role in the degree of sensitivity and erosion in different regions of the eastern Kopet-Dagh zone, especially its dry and semi-arid parts.
The geomorphology is young, and topography is directly related to geological structures: typically, anticlines make highs and synclines make mid-mountain plains. The carbonate formations of the Mozduran (Late Jurassic), Tirgan (Early Cretaceous), and Kalat (Late Cretaceous) are the shaping units of the region. The plains of Sarakhs-Gorgan, Mashhad-Quchan, and Shirvan-Bojnourd are among the fallen areas of Kopet-Dagh (Aghanabati 2004). These heights extend northwest-southeast and are geologically similar to the Zagros Mountains. The regular sedimentary sequence of different geological eras has enabled tectonic, water, and wind processes to create a great diversity in the landscape of the region. The essential features are rich water resources and continuous erosion, carbonate formation, and karst phenomena. Examples include caves, waterfalls, wind dunes, lakes, mega cross-bedding, dissolution holes, canyons, all important in terms of geodiversity studies (Fig. 2).
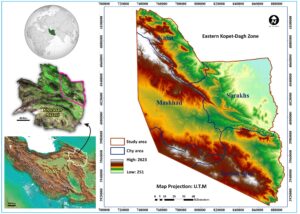
Figure 2. Location of the eastern Kopet-Dagh zone in Khorasan Razavi Province, Iran
Research Methods
The first step in data collection was to gather books, articles, reports and other sources to extract information on basic geology and geomorphology and to evaluate these in terms of geodiversity sensitivity. Maps of the eastern Kopet-Dagh area were prepared based on a series of steps.
First, a geological map of the eastern Kopet-Dagh zone was prepared showing the rock units (lithology) of different parts of the study area, using the 1:250,000 geological maps of the Geological Survey of Iran, distinguishing the four zones of Torbat-e Heydariyeh, Torbat-e Jam, Mashhad, and Sarakhs. Landsat 8 satellite images (2014) and 1:250,000 geological maps were used to prepare a geomorphological map of the study area. Fossil diversity was mapped based on more than a dozen articles. The geomorphological maps distinguished units according to the slopes of the landforms (slope less than 1%, playa; slope 1–4%, covered or compacted plain; slope 4–8%, epandage plain; slope 8–16%, bare plain or pediment; slope >15–16%, mountain area).
We produced climate maps showing temperature, precipitation, and evaporation (ETP), using era5 data, which is the fifth generation, and the latest meteorological analysis data from the ECMWF database. Era5 data provides researchers with all terrestrial and oceanic surface variables from 2000 onwards due to the high resolution (0.25 °) and ease of receiving era5 data, as well as advantages such as low error and being up to date. The data were extracted for a period of 40 years (1981–2020) from the Copernicus Center under the auspices of the ECMWF. Grads, CDO (Climate Data Operator, command line tool), and NCL (NCAR command language) software were used to perform calculations and generate map output. We calculated the drought index from the ratio of the amount of precipitation (P) and the amount of annual evapotranspiration potential (ETP) for the last 40 years.
We produced a landcover map showing the normalized vegetation index (NDVI), taken from the USGS site, using the 4th and 5th bands of the Landsat 8 satellite, OLI sensors for the years 2021–2022. The NDVI is a simple graphical index used in remote sensing analysis and measurements and assessing the presence or absence of vegetation in an area through a range of +1 to -1. A land use map in the study area was prepared based on information extracted from digital data and geographic information systems of the Natural Resources Organization of Khorasan Razavi Province. Soil data of the study area were extracted from the soil map of the country. To analyze these maps, we used Earth 7 software, Global mapper 17 Google Arc GIS 10.3. The geodiversity map preparation steps in Arc GIS are shown in Figure 3.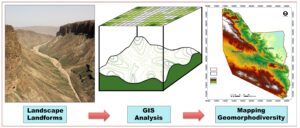
Figure 3. Map preparation steps in Arc GIS
After preparing the basic maps, the total maps were classified into three classes, namely low, medium, and high sensitivity. From the overlay of three parameters, namely land use, landcover, and soil index, the conservation map and the overlay of five parameters, lithological, the slope of geomorphological units, climate, fossil diversity, and geomorphological phenomena, sensitivity map and from the final combination of the two maps, a geodiversity map was prepared (Fig. 4).
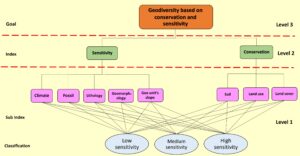
Figure 4. Diagram of geodiversity mapping steps
The three sensitivity classes are based on data in Tables 1 and 2 and Figures 5, 6, and 7. We used a comprehensive classification of ten categories for the different rocks based on mineralogical properties, chemical formula, texture, structure, and strength characteristics (Peyrowan and Shariat Jafari 2013), and we used three categories for sensitivity to erosion (high, medium and low sensitivity rocks).
Table 1. How to score and classify the sub-criteria used in the sensitivity map
Quantitative class | Qualitative class | Landform sensitivity | ||||
Climate | Fossil | Geomorphology | Lithology | Geomorphology unit’s slope
| ||
I. | Low | Cold and Mountainous | 0-4 class | Human effects (National Park- Dam- Town- Protected area- Road…) | Igneous/Metamorphic Rock-Sedimentary Rock with high resistance | Mountain S>15-16%
|
II. | Medium | Semi-desert and Temperate/Mild and Humid | 5-8 class | Aquatic/Aeolian Erosion forms (Wash basin- dune limit- Gully- Spring…) | Igneous/Metamorphic/Sedimentary Rock with mean resistance | Bare plain (Pediment) /Epandage plain S= 4-16%
|
III. | High | Warm and Dry/ Hot and Semi-dry | 9-13 class | Aven- Solution cavities- Karst valley/cave- Karen- Cluse- Debris- Land slid point- Alluvial fan- Scarpment(Fault scarp)- Canyon- Rock- Water surface- River- Scarpment- Fault- Mine | Tuff/ Sedimentary Rock with low resistance | Covered plain/ Playa S<4%
|
Table 2: How to score and classify the sub-criteria used in the protection map
Quantitative class | Qualitative class | Landform preservation | ||
soil | Land cover | Land use | ||
I. | Low | Urban- Inceptisols | +0.5…+1 | Agri- Airport- Garden- Dry farming- Fallow- Mix (Agri/Agri-Garden/Agri-dry farming/ Dry farming) |
II. | Medium | Entisols | 0.00…+0.5 | Low forest- Wood land-Very low forest- wood |
III. | High | Aridisols | -0.4…0.00 | Aquifer- Bare land- Mod forest- Rock- Water- Wetland |
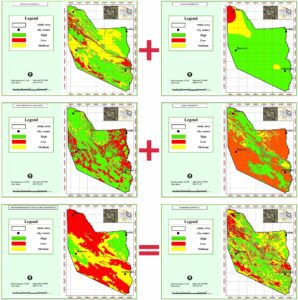
Figure 5. Overlay of the sub-criteria maps used in the preparation of the sensitivity map
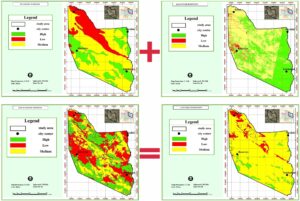
Figure 6. Overlay of the sub-criteria maps used in the preparation of conservation maps
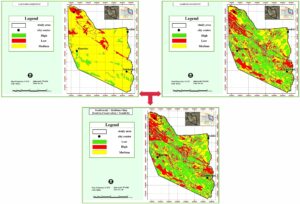
Figure 7. Integration of conservation and sensitivity criteria map and preparation of geodiversity map
Results
The overlays of the conservation and sensitivity maps in the eastern Kopet-Dagh zone indicate that about 41% of the total area (8000 km2) has a high degree of sensitivity and low geodiversity and resilience. 37% of the study (7000 km2) has high geodiversity and resilience with low sensitivity. Finally, 22% of the study area has moderate geodiversity, resilience, and sensitivity, which covers about 4000 Km2 of the total (Fig. 9).
Sensitivity findings are most affected by the frequency of sedimentary rocks compared to igneous and metamorphic rocks, especially whether they are shale, siltstone, loose sandstone and marl, and the existence of abundant Neogene deposits in the study area. We find that about 47.3% are in the high sensitivity spectrum and 41.9% in the medium sensitivity spectrum. Only 10% of the rocks are in the low sensitivity spectrum. Because the main geomorphological units of the study area are epandage plain, pediment, and mountain zones, with slopes of more than 4%, these are less sensitive to water-wind erosion than covered and compacted plains and playa, meaning that 49.7% of the study area has low sensitivity. In terms of geomorphology, 61.7% of the study area has high sensitivity. In terms of fossils, the diversity of species (except in certain sections) is not significantly dispersed in other parts of the study area, 58.8% of the total is in the low sensitivity range. The climate is also influential in determining erosion and weathering, whether physical or chemical. Because the studied area's climatic conditions are mainly hot and dry to hot and semi-dry, 84.5% of the area has high sensitivity. The heterogeneous distribution of vegetation with a density of less than 40%, mainly in the form of scattered vegetation in most places, means that 54.7% of the area has high sensitivity, 43.8% moderate sensitivity, and 1.6% low sensitivity. Land use criteria indicate that 35.9% is in the low sensitivity spectrum, 31.3% in the medium sensitivity spectrum, and 31.3% in the high sensitivity spectrum. Despite the abundance of entisols in the study area, the sensitivity status is mainly in the average range of 56.9% (Fig. 8). It should be noted that field visits confirm the above results.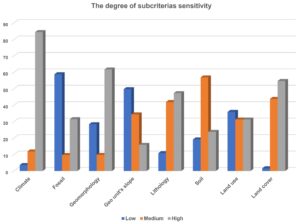
Figure 8. Sensitivity metrics for each of the sub-criteria (high sensitivity is equivalent to low geodiversity and low resilience)

Figure 9. Percentage diagram of the eastern Kopet-Dagh geodiversity (higher geodiversity and resilience indicate lower sensitivity)
Spatially, areas with low geodiversity and low resilience, and a high degree of sensitivity, are more widespread in the southern parts of the eastern Kopet-Dagh zone. Northwestern regions also have low sensitivity with high geodiversity and resilience. Therefore, it can be inferred that the amount of geodiversity and resilience generally decreases from the north of the eastern Kopet-Dagh to the south (Fig. 7). The finding by Abdullah Zadeh et al. (2021) that areas with high eco-geomorphic instability and heterogeneous spatial patterns were at the boundary of desert ecosystems is consistent with the desert threshold we find in Khorasan Razavi province.
Discussion
All open systems are in equilibrium when they reach their minimum energy and maximum entropy. The occurrence of any change in the geosystem is a sign that it has not yet reached its final equilibrium point. However, it is possible that in the case of nonequilibrium, it will achieve temporary stability (Sepehr 2014). With the above approach and based on our field visits, we describe the equilibrium state in some perspectives in the study area:
Our stratigraphical investigations of the landform in Figure 10 show an outcrop of Neyzar and Kalat formations on the flanks of Kalat-e-Naderi Canyon. These sedimentary successions were deposited in the Late Cretaceous marine environment. The next steps include exposure by Laramide epeirogenic movements and environmental changes from a marine to terrestrial system at the beginning of the Paleocene. This was followed by a new transgression in the Middle Paleocene, and dominance of marine conditions until the Oligocene, occurring in the late phases of the Alpine Orogeny, and the final upheaval and folding. The system shows a tendency to nonequilibrium with the early stages of erosional currents, leading to the formation of V-shaped valleys, caused by significant changes in geosystem inputs linked to the mountain uplift. Over time, following the negative feedback of the geosystem, landform changes occurred in the formation of rock debris and talus in the valley wall, as well as sediments in the riverbed, which shows the dynamic equilibrium of the region at present.
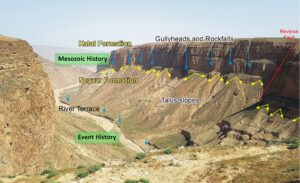
Figure 10. Geodiversity and Dynamic Equilibrium at the Landform Scale, Kalat-e Naderi Canyon (Photo by author 1401)
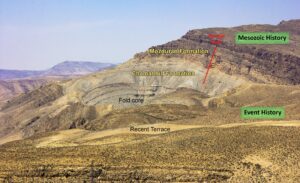
Figure 11. Geodiversity and dynamic equilibrium in an overturned and eroded anticline in the Mashhad-Kalat Road (Photo by author 1401)
Figure 11 shows a view of the Upper Jurassic Chamanbid and Mozdouran formations, exposed as an overturned fold. After final regression, tectonic movements in the terminal stages of Alpine Orogeny, and the activation of erosion cycles, the Upper Jurassic Chamanbid and Mozdouran formations were exposed as folds on the earth’s surface and eroded (Fig. 11). The result of this erosion is the formation of young unconsolidated sediments of Quaternary age that cover the area in the form of alluvial terraces. Low energy and high deposition put the geosystem in relative equilibrium. Considering that no significant changes are observed in the landform in the short term, it can be concluded that the geosystem is experiencing a temporary stable state.
The oldest part of the sedimentary succession (Fig. 12) is the Middle Jurassic Kashafrud Formation, which was formed in a basin with diverse sedimentary facies from shallow to deep sea environments. Like other areas in the Kopet-Dagh Mountains, the Pyrenean to Pasadenian phases, the last stages of the great Alpine orogenic cycle, led to the folding of older sedimentary rocks. The activation of erosional processes along with this uplift in this particular landscape has led to a very clear angular disconformity between the Kashafrud Formation and its covering beds, including young Neogene sedimentary beds. After that, the Neogene rocks were covered by younger Plio-Quaternary conglomerates through another distinct discontinuity. The predominance of erosional/gravitational processes has also caused talus formation, and water erosion created erosional subchannels around the main river channel. The decrease in energy and the increase in the depositional process relative to erosion have led to a relative equilibrium in this landform.
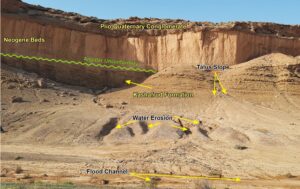
Figure 12. Geodiversity and Nonequilibrium in the Kashafrud Formation, Neogene beds, and Plio-Quaternary rocks in the south of Mozduran Pass, Mashhad-Sarakhs Road (Photo by author 1401)
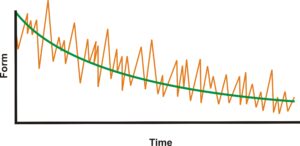
Figure 13. Dynamic equilibrium curve, according to Chorley and Kennedy (1971)
It should be noted that in all three images, although there is a change, the changes around the perimeter are a constant amount of fluctuation that decreases over time, with dynamic equilibrium shown in Figure 13. Further, the existence of high geodiversity and high resilience against the low sensitivity of the above landforms (Figs. 10–12) located in the northern part of the eastern Kopet-Dagh zone is consistent with the results of overlaying layers in these areas. In the southern part of the Eastern Zone, Kopet-Dagh landforms are more sensitive to degradation and erosion due to low geodiversity and low resilience and are at greater risk of damage.
Conclusion
Our analysis of geodiversity uses a map-based approach, combining multiple maps of key indicators such as geology, soil types, and climate, with field visits to check the reality of the compiled map-based data. We find that about 41% of the Eastern Kopet-Dagh Mountains, equivalent to 7800 km2, have a high degree of sensitivity, especially in the south where there is less geodiversity. Therefore, the resilience of the above regions to shaping processes is low. Most of the above areas are assumed to be transition areas or areas with potential to cross a threshold. In this case, replacing the destructive processes with the recovery potential causes the geosystem to experience momentary instability. This shows the need for proper management and proper use of the above areas because the most minor changes, especially human pressures that play the role of catalyst in the destruction, will increase the critical situation and expand the vulnerable regions. The presence of scattered vegetation and geological formations with high sensitivity to erosion, highlights the importance of these parameters. Every geosystem needs to reduce sensitivity in all dimensions and criteria to achieve the genuine concept of resilience; however, in an area with the extent of the eastern Kopet-Dagh zone, equilibrium or nonequilibrium may exist simultaneously, in which different parts of the geosystem respond differently to shaping strategies due to further resilience to one factor at the same time. It should be noted that despite many changes in the subsystems, the coherence and integrity of the entire geosystem has been maintained over time. This constant has formed the identity of the study area, which depends on the size and shape of the basin, the shape of the initial roughness, geological status, land cover, hydrological lattice, climate, land use, paleontology, lithology, soil, and other parameters of geodiversity over time.
References
Processes in urban Ecosystems. Springer New York, NY. 366 p.