University of Technology Mauritius, Pointe-Aux-Sables, MU
Abstract
The problem of multicollinearity among predictor variables is a frequent issue in longitudinal data analysis. In this context, this paper proposes a mixed ridge regression model via shrinkage methods to analyze such data. Furthermore, in view of obtaining more efficient estimators, we propose preliminary and Stein-type estimators using prior information for fixed-effects parameters. The model parameters are estimated via the EM algorithm. A simulation study is also presented to assess the performance of the estimators under different estimation methods. An application to the HIV data is also illustrated.
Introduction
In longitudinal data setup, repeated measures of some variables of interest are collected over a specified time period for different independent subjects or individuals. Such types of data are commonly encountered in medical research where the responses are subject to various time-dependent and time-constant effects such as pre- and post-treatment types, gender effect, baseline measures and among others (see Mamode Khan et al. [
1
], Yuan et al. [
2
], Verbeke et al. [
3
], Temesgen and Kebede [
4
], Seyoum et al. [
5
] and the references therein). It is quite natural, in the above examples, the repeated measures shall exhibit some forms of dependence that may be resulted from some serial or random effects as outlined by Zeger and Liang [
6
], Thall and Vail [
7
], Laird and Ware [
8
], Sutradhar [
9
] and Sutradhar and Jowaheer [
10
]. Thus, the main purpose of the longitudinal studies is to estimate the effects of the various parameters and determine their significance while the dependence estimate is treated as secondary. In this context, FitzMaurice and Laird [
11
] and Sutradhar et al. [
12
] have proposed various likelihood-based and pseudo-likelihood-based estimation procedures to estimate the regression effects but the efficiency of the estimators in these approaches may be questionable, in particular, under multi-collinearity among the predictor variables as considered by Eliot et al. [
13
], Hossain et al. [
14
] and Saleh et al. [
15
].
Since longitudinal data mostly arise from clinical studies, the expert knowledge about the parameters has vital impact on the output and is thus an important component in the estimation of model parameters. The preliminary test and shrinkage techniques are mostly used mechanisms in which a prior knowledge can be included in the estimation stage (see papers by Ali and Saleh [
16
], Ahmed and Fallahpour [
17
] ,Roozbeh and Arashi [
18
] and Yuzbasi and Ahmed [
19
], Yuzbasi et al. [
20
] and Asar [
21
] and the references therein). In this paper, we develop the preliminary test and shrinkage estimation methods for the analysis of longitudinal data in ridge regression context, where some parameters are subject to certain/uncertain restrictions. By this, we improve the estimation technique, in both the mean squared error (MSE) and mean prediction error (MPE) senses.
We begin with the linear mixed effects (LM) model given by
yi=xiβ+ziTbi+εi,
where
i=1,…,n
represents individual,
yi=(yi1,yi2,…,yini)T
is a vector of
ni
observations for individual
i
, and
xi
is the corresponding
ni×p
design matrix of fixed-effect covariates. We further assume
bi∼Nq(0,D)
is person-specific random effects,
zi
the corresponding random effects design matrix and
εi∼Nn(0,σ2Ini×ni)
. Let
Y,X
and
Z
be appropriately defined matrices representing the concatenation of the corresponding variables over all individuals
i
. Then, the LM model in matrix notation has form
μ=EY|b=Xβ+ZbE(y1|b)E(y2|b)⋮E(yn|b)=x1x2⋮xnβ1β2⋮βp+z1T0⋯00z2T⋯0⋮⋮⋱⋮00⋯znTb1b2⋮bn,
where
μ
:
N×1
,
X
:
N×p
,
β
:
p×1
,
Z
:
N×nq
and
b
:
nq×1
. Here,
N=∑i=1nni
.
The log-likelihood function of
Y
based on this model is given by
l(Y)∝-12∑i=1nlog|Vi|-12(Y-Xβ)TV-1(Y-Xβ),
where
V=Var(Y)=ZDZT+σ2I
and
Vi
is the variance component corresponding to individual
i
. Maximizing (
3
) with respect to the fixed-effects parameter vector,
β
, in the non-penalized setting is equivalent to minimizing the least squares objective function that gives the estimate of
β
as
β^M=(XTV-1X)-1XTV-1Y
Consider a situation in which the multi-collinearity problem is present. The ridge regression approach designed specifically to handle correlated predictors involves introducing a shrinkage penalty
k
to the least squares equation, and subsequently solving for the value of
β
such that
β^MR=argminβ∈Rp{(Y-Xβ)TV-1(Y-Xβ)+kβTβ}=(XTV-1X+kI)-1XTV-1Y
The structure of the paper is therefore organized as follows: In “
Shrinkage approach
” section, the novel estimation approach based on shrinkage method is proposed which also includes some computational aspects and the EM algorithm. “
Simulation study
” section provides the Monte Carlo simulation experiments followed by the section on the application of the new techniques to the HIV data, and a comparative study is also presented. The conclusion is presented in final section.
Shrinkage approach
In this section, we consider the mixed ridge (MR) model (
2
) and develop preliminary test and Stein-type estimation of the fixed-effects parameter
β
when it is a priori suspected that
β=β0
. Usually,
β
comes from different sources: (1) a fact known from theoretical or experimental considerations, (2) hypothesis that may have to be tested or (3) an artificially imposed condition to reduce redundancy in the description of the model. Here, we interpret as expert knowledge.
Incorporating expert knowledge
In the statistical literature, preliminary test estimation of parameters was introduced by Bancroft [
22
] to estimate the parameters of a model when it is suspected that some “uncertain prior information” (UPI) on the parameter of interest is available. The method involves a statistical test of the UPI based on an appropriate statistic and a decision on whether the model-based sample estimate or the prior information-based estimate of the model parameters should be taken.
In our case, if we suspect
β
to be
β0,
then
β0
is termed as the restricted estimator (RE) that must be incorporated in the analysis. Otherwise,
β^MR
is used. In practice, the prior information that
β=β0
is
uncertain
. The doubt on this prior information can be removed by testing the following hypothesis:
H0:β=β0versusHA:β≠β0
As a result of this test, we choose
β0
or not based on the rejection or acceptance of
H0
. Accordingly, we develop the estimator
β^MRPT=β^MRifRH0β0ifAH0
called the preliminary test MR (PTMR) estimator. Using indicator function, this estimator can be rewritten as
β^MRPT=β^MRI{RH0}+β0I{AH0}=β^MR-β^MRI{AH0}+β0I{AH0}=β^MR-(β^MR-β0)I{AH0}=β^MR-(β^MR-β0)I(Ln<Ln(α))
where
IA
is the indicator function of the set
A
,
L
is the Wald statistic given by
L=(β^-β0)T(XTV-1X)(β^-β0)
and
Ln(α)
is the upper
α
level critical value of the
χ
-distribution with
p
d.f.
The PTMR estimator is highly dependent on the level of significance
α
and has discrete nature which is simplified to one of the extremes
β^MR
and
β0
, according to the output of test. In this respect, making use of a continuous and
α
-free estimator may make more sense.
Stein-type estimation was introduced by Stein [
23
] and James and Stein [
24
] in the statistical literature. It combines UPI on the parameters of interest and the sample observation from the statistical model. In the context of LM model, using the same approach as in Saleh [
15
], the Stein-type estimator of
β
has form
β^MRS=β^MR-c(β^MR-β0)Ln-1,c=(p-2)(N-p)p(N-p+2)
Unlike the PTMR estimator, the Stein-type estimator is a smooth function and independent of the level of significance
α
.
Notice that the forms of
β^MRS
and
β^MRPT
are similar where Eq. (
5
) obtained from Eq. (
4
) by replacing
I(Ln<Ln(α))
by
cLn-1
to make it independent of
α
.
Computational aspects
Consider the setting in which the variance parameters
θ=(D,σ2)
are unknown. Eliot et al. [
13
] proposed an extension of the expectation–maximization (EM) algorithm described by Laird and Ware [
8
] that includes an additional step for estimation of the ridge component. We refine their procedure to evaluate shrinkage estimators as well.
Further, for the ease of computations, we use the estimate of Hoerl and Kenard [
25
] for the ridge parameter as the initial value. It is given by
k^0=σ^2α^max2,
where
α^max=max(α^1,…,α^p)
in which
α^=ΓTβ^
and
Γ
is the orthogonal eigenvector is spectral decomposition of
XTX
, i.e.,
XTX=ΓΛΓT
,
Λ=diag(λ1,…,λp)
, where
λi
is the
i
th eigenvalue of
XTX
. In what follows, we propose the refined EM algorithm.
Simulation study
A Monte Carlo simulation study is conducted to evaluate the performance of the proposed PTMR and shrinkage estimators compared to the MR estimator of Eliot et al. [
13
]. In our simulation scheme, we fix
ni=4
measurements for each subject
i
and generate data according to the model of (
2
) where
β=(0.0,0.1,0.2,0.4,0.8)
,
bijk∼N(0,0.6)
and
εijk∼N(0,1)
. To generate multicollinear data, using the “EnvStats” package in
R
, each predictor variable is assumed to arise from
N
(5, 1), and the correlation
ρ
between predictor variables is taken from the set
0.0,0.2,0.5,0.7,0.9
. Initial values of the variance components are set to be the estimates obtained from fitting a mixed model with no ridge component. In total,
B=100
simulations are conducted for each of the
ρ
values based on
n=40
individuals. For further assumed the expert prior knowledge is
β=0
, for the computation of the PTMR and Stein-type estimators. Simulation results are summarized in Tables
1
and
2
. From Table
2
, it is clear the estimation is dependent on the level of significance
α
.
Table 1
Stein-type estimation for mixed and MR
ρ
β
M
MR
Shrinkage M
Shrinkage MR
Estimate
sd
Estimate
sd
Estimate
sd
Estimate
sd
0.0
0.0
− 0.01651
0.01897
0.03828
0.01708
− 0.01585
0.01833
0.03707
0.01651
0.1
0.09016
0.01864
0.11907
0.01593
0.08725
0.01802
0.11513
0.01530
0.2
0.19841
0.01832
0.21519
0.01559
0.19189
0.01777
0.20805
0.01498
0.4
0.38544
0.02153
0.37015
0.01870
0.37298
0.02110
0.35803
0.01861
0.8
0.83942
0.01785
0.75063
0.01868
0.81200
0.01640
0.72591
0.01979
MSE
0.294153
0.243336
0.271858
0.243966
0.2
0.0
− 0.00962
0.02271
0.06112
0.02014
− 0.00914
0.02193
0.05919
0.01947
0.1
0.09251
0.02057
0.12655
0.01728
0.08954
0.01989
0.12235
0.01659
0.2
0.19622
0.02042
0.21971
0.01648
0.18980
0.01980
0.21244
0.01581
0.4
0.37928
0.02446
0.35959
0.02064
0.36707
0.02396
0.34783
0.02057
0.8
0.83806
0.01875
0.72513
0.02178
0.81081
0.01734
0.70131
0.02312
MSE
0.370953
0.312257
0.344432
0.307289
0.5
0.0
− 0.00016
0.02968
0.07565
0.02530
0.00004
0.02866
0.07331
0.02445
0.1
0.09685
0.02508
0.14022
0.02006
0.09381
0.02424
0.13562
0.01926
0.2
0.19709
0.02523
0.22438
0.01961
0.19065
0.02445
0.21697
0.01883
0.4
0.35966
0.03151
0.34586
0.02530
0.34827
0.03089
0.33473
0.02511
0.8
0.84249
0.02363
0.70636
0.02399
0.81521
0.02205
0.68334
0.02541
MSE
0.595086
0.442459
0.55458
0.440721
0.7
0.0
0.01952
0.03965
0.11723
0.03073
0.01919
0.03831
0.11360
0.02973
0.1
0.09350
0.03343
0.16157
0.02493
0.09062
0.03233
0.15625
0.02394
0.2
0.18086
0.03260
0.22593
0.02314
0.17494
0.03164
0.21845
0.02226
0.4
0.35057
0.03940
0.32776
0.02927
0.33946
0.03852
0.31720
0.02904
0.8
0.85111
0.03275
0.65915
0.03311
0.82374
0.03098
0.63787
0.03439
MSE
1.026224
0.691952
0.958517
0.686111
0.9
0.0
0.06336
0.06138
0.21356
0.03809
0.06172
0.05929
0.21040
0.03704
0.1
0.05429
0.05000
0.21684
0.02302
0.05289
0.04841
0.21351
0.02192
0.2
0.15672
0.05137
0.20109
0.02179
0.15134
0.04986
0.19811
0.02068
0.4
0.31727
0.05493
0.29482
0.02799
0.30729
0.05360
0.28893
0.02728
0.8
0.90350
0.05326
0.52754
0.05286
0.87430
0.05059
0.51431
0.05294
MSE
2.387184
1.109869
2.226858
1.083424
Table 2
Preliminary test estimation for MR
ρ
β
PTMR, α=0.001
PTMR, α=0.01
PTMR, α=0.05
PTMR, α=0.1
Estimate
sd
Estimate
sd
Estimate
sd
Estimate
sd
0.0
0.0
0.01246
0.00856
0.03605
0.01578
0.03828
0.01708
0.03828
0.01708
0.1
0.02731
0.01393
0.10728
0.01466
0.11907
0.01593
0.11907
0.01593
0.2
0.05582
0.02647
0.18226
0.01764
0.21519
0.01559
0.21519
0.01559
0.4
0.09815
0.04943
0.32858
0.02632
0.37015
0.01870
0.37015
0.01870
0.8
0.19518
0.09782
0.66143
0.04317
0.75063
0.01868
0.75063
0.01868
MSE
2.55996
0.55901
0.24334
0.24334
0.2
0.0
0.01804
0.01010
0.05750
0.01853
0.06112
0.02014
0.06112
0.02014
0.1
0.03039
0.01426
0.11355
0.01621
0.12655
0.01728
0.12655
0.01728
0.2
0.06393
0.02630
0.18625
0.01822
0.21971
0.01648
0.21971
0.01648
0.4
0.10230
0.04901
0.31808
0.02757
0.35959
0.02064
0.35959
0.02064
0.8
0.20385
0.09668
0.63905
0.04445
0.72513
0.02178
0.72513
0.02178
MSE
2.50707
0.62413
0.31226
0.31226
0.5
0.0
0.02520
0.01120
0.07434
0.02222
0.07565
0.02530
0.07565
0.02530
0.1
0.02988
0.01521
0.12458
0.01873
0.14022
0.02006
0.14022
0.02006
0.2
0.05970
0.02746
0.18715
0.02045
0.22438
0.01961
0.22438
0.01961
0.4
0.09445
0.04990
0.31025
0.03054
0.34586
0.02530
0.34586
0.02530
0.8
0.17984
0.09789
0.61851
0.04538
0.70636
0.02399
0.70636
0.02399
MSE
2.61252
0.72805
0.44246
0.44246
0.7
0.0
0.03759
0.01581
0.11163
0.02780
0.11723
0.03073
0.11723
0.03073
0.1
0.03963
0.01675
0.14117
0.02351
0.16157
0.02493
0.16157
0.02493
0.2
0.06801
0.02819
0.18568
0.02332
0.22593
0.02314
0.22593
0.02314
0.4
0.09917
0.04982
0.29229
0.03410
0.32776
0.02927
0.32776
0.02927
0.8
0.20379
0.09593
0.58347
0.04987
0.65915
0.03311
0.65915
0.03311
MSE
2.55001
0.95592
0.69195
0.69195
0.9
0.0
0.05136
0.01859
0.17949
0.03486
0.21356
0.03809
0.21356
0.03809
0.1
0.06283
0.01780
0.18461
0.02241
0.21684
0.02302
0.21684
0.02302
0.2
0.04737
0.02795
0.15783
0.02346
0.20109
0.02179
0.20109
0.02179
0.4
0.07633
0.05073
0.25388
0.03453
0.29482
0.02799
0.29482
0.02799
0.8
0.14872
0.10104
0.47422
0.06376
0.52754
0.05286
0.52754
0.05286
MSE
2.83244
1.37271
1.10987
1.10987
From Table
1
, it is apparent the shrinkage mixed ridge (shrinkage MR) estimator has smaller MSE and standard error (sd). Hence, the shrinkage MR is the best among all other competitors; i.e., the shrinkage MR performs better than the mixed, MR and shrinkage mixed (shrinkage
M
). Knowing this, the preliminary test approach is only applied to the mixed ridge estimator, giving rise to the PTMR estimator. According to the results of Table
2
, as the level of significance increases, the MSE increases. The graphs of the MSE against the different values of
ρ
are also shown in Fig.
1
.
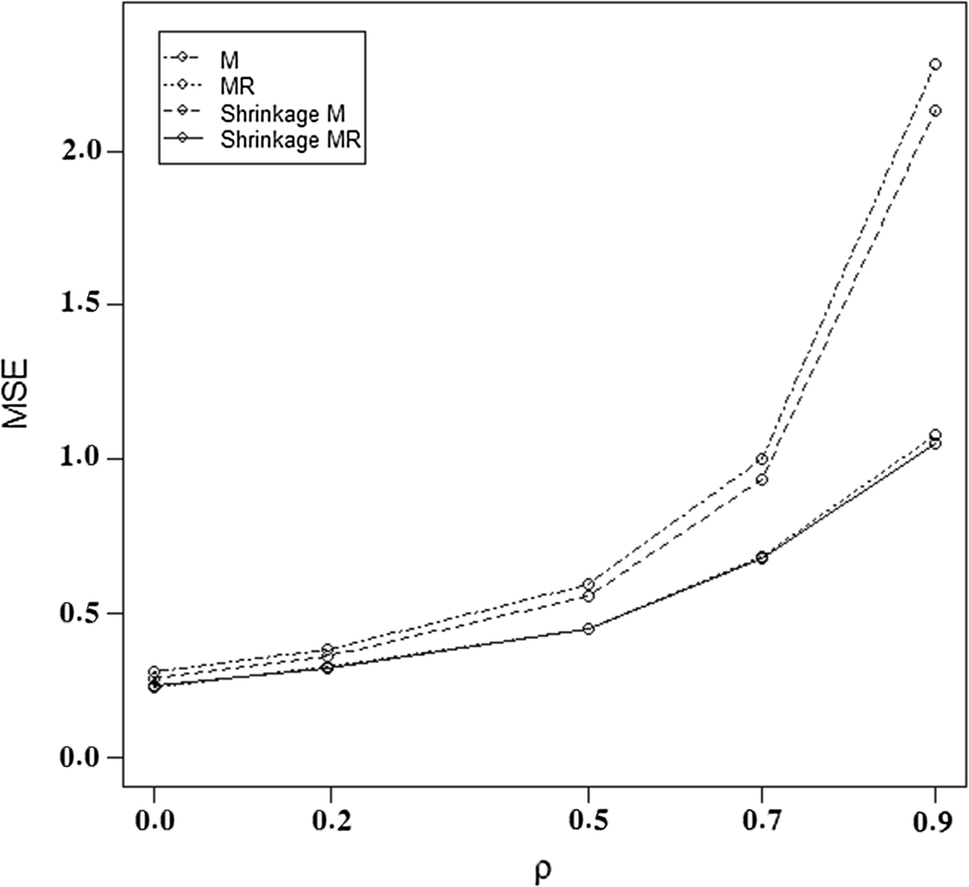
Fig. 1
MSE of estimators versus
ρ
Although as level of multi-collinearity increases, so does the MSE values, the proposed PTMR estimator has smaller MSE among all. Further, the PTMR and shrinkage MR estimators perform better than the M and MR estimators in multi-collinear situations.
HIV data analysis
In a similar framework as explained in Temesgen and Kebede [
4
], this section focuses on analyzing HIV data using the linear mixed model. In particular, in this study, we analyze the performance of the proposed estimators using the aids dataset taken from “JMbayes” package in R. The dataset consists of seven covariates for each
n=467
patients. The response variable is the CD4, and we consider the gender and prevOI variables as the random effects, in our study. Didanosine versus zalcitabine in HIV patients, a randomized clinical trial data were collected to compare the efficacy and safety of two antiretroviral drugs in treating patients who had failed or were intolerant of zidovudine (AZT) therapy. Table
3
introduces variables of this study:
Table 3
Introduction to data and variables format
Variables
Description
Patient
Patients identifier, in total there are 467 patients
Time
The time to death or censoring
Death
A numeric vector with 0 denoting censoring and 1 death
CD4
The CD4 cells counts
Obstime
The time points at which the CD4 cells count was recorded
Drug
A factor with levels ddC denoting zalcitabine and ddI denoting didanosine (ref)
Gender
A factor with levels female (ref) and male
prevOI
A factor with levels AIDS denoting previous opportunistic infection (AIDS diagnosis) at study entry, and noAIDS denoting no previous infection
AZT
A factor with levels intolerance (ref) and failure denoting AZT intolerance and AZT failure, respectively
Variables have been measured
ni
time for each individuals, so we have a longitudinal dataset; some of the variables like
gender
in this set will put the subjects in special groups, so we can consider these variables as random effects and we can use mixed models to analyze this dataset, but we know the high degree of correlation among predictors is expected, because variables are measured several times, so we have multi-collinearity data; to combat this difficulty, we can use mixed ridge regression (see Eliot et al. [
13
]). Information on the important variables is summarized in Table
4
.
Table 4
Summary of dataset
Time
CD4
Obstime
Min
0.47
0.00
0.00
1st. Q
12.23
3.16
0.00
Median
14.07
5.47
2.00
Mean
13.89
7.02
4.21
3rd. Q
17.00
10.44
6.00
Max
21.40
24.12
18.00
death
drug
gender
prevOI
AZT
Death: 412
ddI: 688
Male: 1288
AIDS: 863
Failure: 491
Censoring: 993
ddC: 717
Female: 117
noAIDS: 542
Intolerance: 914
In addition, we use shrinkage methods to increase estimation efficiency. For the purpose of utilizing the mixed model in “
Shrinkage approach
” section, the log transform was applied to the CD 4 counts.
Table 5
Estimations of real data
Variables
β^M
β^MR
β^MS
β^MRS
β^MRPT(α=0.5)
Time
0.06869698
0.2073583
0.02856897
0.08031050
0.2073583
Death
− 2.04918509
− 1.0093676
− 0.85219338
− 0.39093109
− 1.0093676
Obstime
− 0.14989040
− 0.1434991
− 0.06233483
− 0.05557763
− 0.1434991
Drug
0.52531199
0.3335692
0.68193879
0.49110137
0.3335692
AZT
0.66381892
0.1724118
0.27606198
0.06677560
0.1724118
MPE
1.20687
0.02114
1.04644
0.00052
0.02114
Table 6
Standard deviation (sd) estimations
Variables
sd(βM)
sd(βMR)
sd(βMS)
sd(βMRS)
sd(βMRPT)
Time
0.0006130127
1.666749e-04
0.0005790592
9.235027e-05
1.666749e-04
Death
0.0157215596
1.170777e-02
0.0152335866
3.478280e-04
1.170777e-02
Obstime
0.0011262431
4. 908799e-04
0.0010734227
8. 779722e-05
4.908799e-04
Drug
0.0374385567
1.637019e-02
0.0344460129
4.589694e-04
1.637019e-02
AZT
0.0044424233
4.234534e-03
0.0041215722
8.977002e-04
4. 234534e-03
Table
5
shows the mixed, MR, shrinkage
M
, shrinkage MR and PTMR estimators, respectively, denoted by
β^M
,
β^MR
,
β^MS
,
β^MRS
and
β^MRPT
. From Table
6
, it is clear that the drug ddI is more effective in curing the infected cells than ddC. In fact, the rate of improvement through using ddI increases by 63.41% as compared to using ddC. This conforms with the negative sign of the parameter “obstime” which indicates that the proliferation of the HIV virus is under control as the time point increases by an approximate rate of 5.715
%
. The negative sign in the “death” parameter also denotes that using ddC, the rate of deaths and the time to survival improve by 47.83
%
and 8.36
%
respectively. Besides, the standard deviation estimates illustrate that these explanatory variables are significant, and hence based on the above dataset, the drug ddI (didanosine) is a recommendable remedy.
From the medical point of view as well, it is shown that ddI yields better treatment in controlling the growth of the HIV virus in the human body (see Molina et al. [
26
]) while the drug ddC (zalcitabine) has been strongly recommended to be unused due to its countereffects as discussed in the book “clinical neurotoxicology” by Dobbs [
27
] and Bilgrami and O’Keefe [
28
].
To compare the performance of the shrinkage MR estimator, we evaluate the MPE; the lesser, the better. In what follows, we describe the scheme we used to derive the MPE. For our purpose, a
K
-fold cross-validation is used to obtain an estimate of the prediction errors of the model. In a
K
-fold cross-validation, the dataset is randomly divided into
K
subsets of roughly equal size. One subset is left aside,
{(Xtest,ytest)}
, termed as test set, while the remaining
K-1
subsets, called the training set, are used to fit model. The resultant estimator is called
β^train
. The fitted model is then used to predict the responses of test dataset. Finally, prediction errors are obtained by taking the squared deviation of the observed and predicted values in the test set, i.e.,
PEk=‖Xktestβ-y^ktest‖2
where
y^ktest=Xktestβ^ktrain
. The process is repeated for all
K
subsets, and the prediction errors are combined. To account for the random variation of the cross-validation, the process is reiterated
N
times and the average prediction error is estimated which is given by
MPE=median1K∑k=1KPE1k,…,1K∑k=1KPENk
where
PEik
is the prediction error of considering
k
th test set in
i
th iteration. If the value of MPE is lesser, the estimator is preferred, comparatively.
Our results are based on
N=500
case re-sampled bootstrap sample. In Table
5
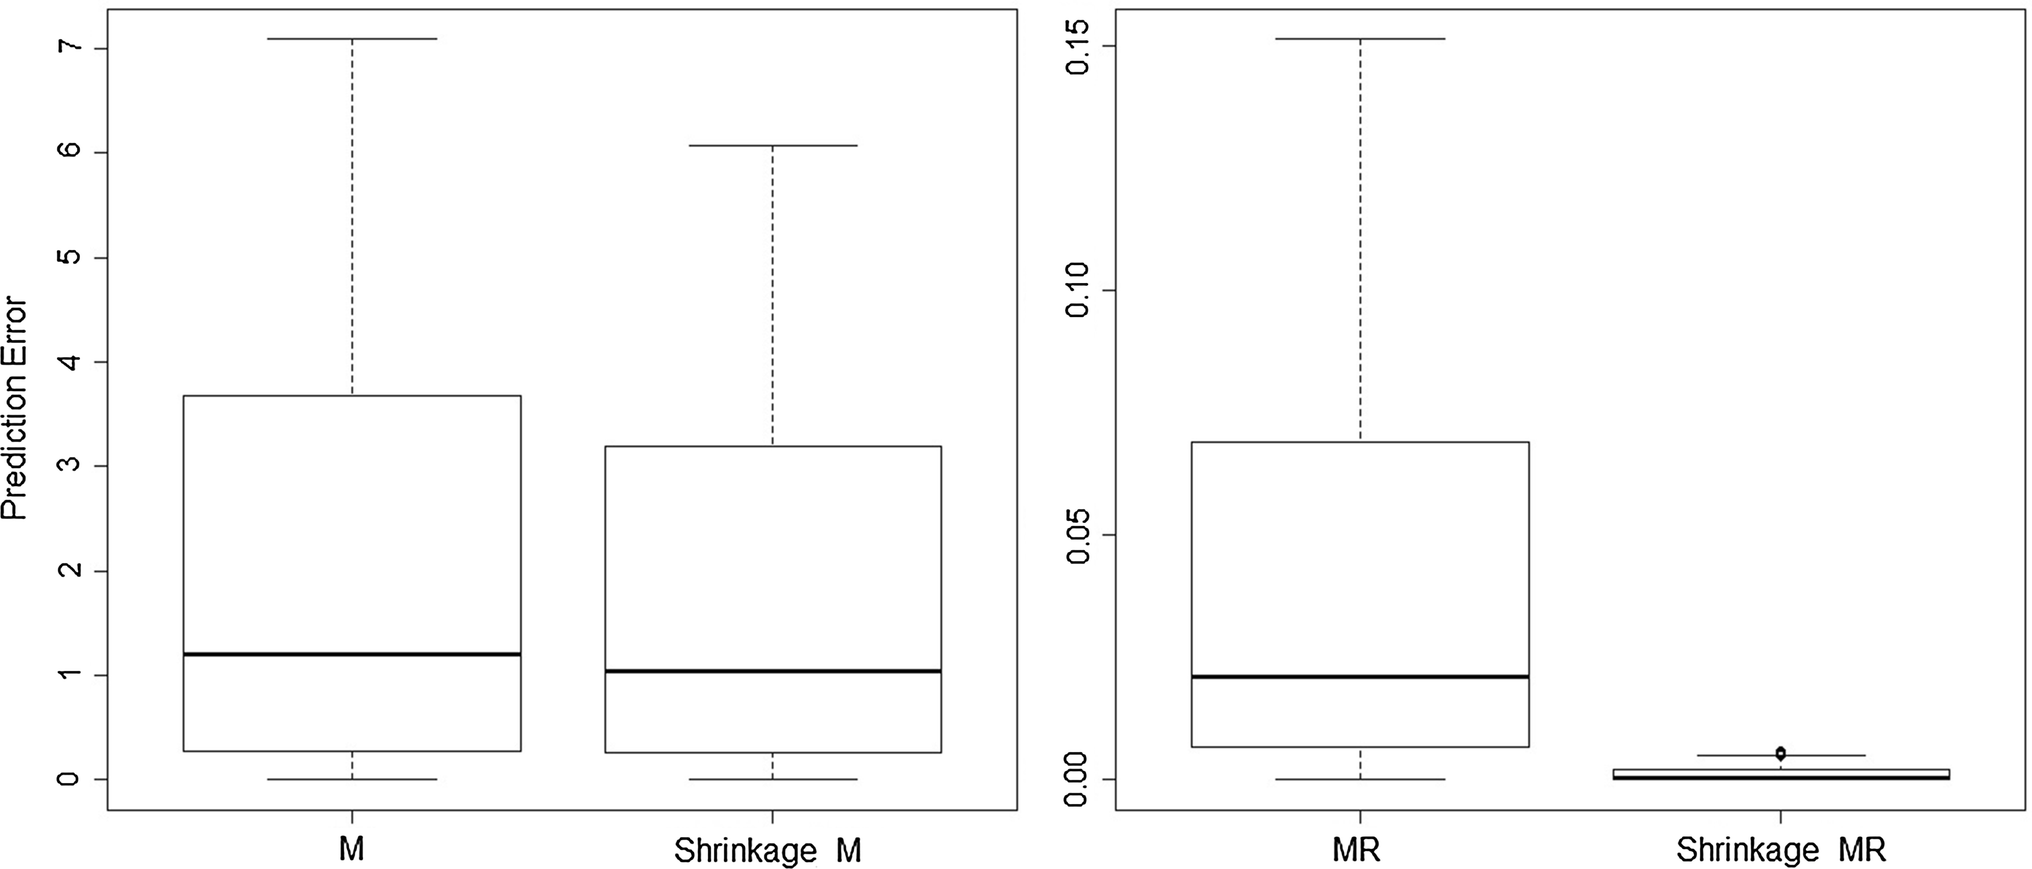
, we report the estimates and MPE values. Based on the results, the proposed shrinkage MR estimator performs better than the others, in MPE sense. Further, the absolute value of estimates in the shrinkage MR estimates is lesser than the others. The box plots of the PE are shown in Fig.
2
.
Fig. 2
Box plots for the PEs of the real data
From the results in the estimation table, it could be deduced that the didanosine drug provides a better treatment.
Conclusion
In this paper, we developed a preliminary test and Stein-type ridge regression estimation in linear mixed model for longitudinal data analysis. Hence, we considered a penalized likelihood approach and proposed the shrinkage mixed ridge estimator for the vector of regression coefficients. An EM algorithm is also exhibited to solve the penalized likelihood for the unknown parameters. Simulation studies demonstrated the good performance of the proposed estimator for multicollinear situations compared to the maximum likelihood estimator. In addition, the above model has contributed largely to justify the use of didanosine in improving the health states of HIV patients, as stated in various biomedical studies. Henceforth, such model and its estimation step based on shrinkage is highly commendable for medical studies of such genre.
Acknowledgements
We would like to thank the referees for constructive comments which greatly improved the presentation of paper.
Publisher's Note
Springer Nature remains neutral with regard to jurisdictional claims in published maps and institutional affiliations.
References
Mamode Khan et al. (2018) Modeling longitudinal INMA(1) with com-poisson innovation under non-stationarity: application to medical data 6(17) (pp. 1-22)
Yuan et al. (2012) Variable selection for covariate-adjusted semiparametric inference in randomized clinical trials (pp. 3789-3804) 10.1002/sim.5433
Verbeke et al. (2014) The analysis of multivariate longitudinal data: a review 23(1) (pp. 42-59) 10.1177/0962280212445834
Temesgen and Kebede (2016) Joint modeling of longitudinal CD4 count and weight measurements of HIV/tuberculosis co-infected patients at Jimma University specialized hospital 3(3) (pp. 321-338) 10.1007/s40745-016-0085-9
Seyoum et al. (2017) Joint longitudinal data analysis in detecting determinants of CD4 cell count change and adherence to highly active antiretroviral therapy at Felege Hiwot Teaching and Specialized Hospital, Northwest Ethiopia (Amhara Region) 14(14) (pp. 1-13)
Zeger and Liang (1986) Longitudinal data analysis for discrete and continuous outcomes 42(1) (pp. 121-130) 10.2307/2531248
Thall and Vail (1990) Some covariance models for longitudinal count data with overdispersion 46(3) (pp. 657-671) 10.2307/2532086
Laird and Ware (1982) Random-effects models for longitudinal data (pp. 963-974) 10.2307/2529876
Sutradhar (2003) An overview on regression models for discrete longitudinal responses 18(3) (pp. 377-393) 10.1214/ss/1076102426
Sutradhar and Jowaheer (2006) Analyzing longitudinal count data from adaptive clinical trials: a weighted generalized quasi-likelihood approach 76(12) (pp. 1079-1093) 10.1080/10629360600569196
FitzMaurice and Laird (1993) A likelihood-based method for analysing longitudinal binary responses 80(1) (pp. 141-151) 10.1093/biomet/80.1.141
Sutradhar et al. (2014) Remarks on asymptotic efficient estimation for regression effects in stationary and non-stationary models for panel count data 28(2) (pp. 241-254) 10.1214/12-BJPS204
Eliot et al. (2011) Ridge regression for longitudinal biomarker data (pp. 1-11) 10.2202/1557-4679.1353
Hossain et al. (2018) Shrinkage estimation in linear mixed models for longitudinal data 81(5) (pp. 569-586) 10.1007/s00184-018-0656-1
Saleh et al. (2014) Wiley
Ali and Saleh (1990) Estimation of the mean vector of a multivariate normal distribution under symmetry (pp. 209-226) 10.1080/00949659008811244
Ahmed and Fallahpour (2012) Shrinkage estimation strategy in quasi-likelihood models (pp. 2170-2179) 10.1016/j.spl.2012.08.001
Roozbeh and Arashi (2016) Shrinkage ridge regression in partial linear models 45(20) (pp. 6022-6044) 10.1080/03610926.2014.955115
Yuzbasi and Ahmed (2016) Shrinkage and penalized estimation in semi-parametric models with multicollinear data 86(17) (pp. 3543-3561) 10.1080/00949655.2016.1171868
Yuzbasi et al. (2017) Improved penalty strategies in linear regression models 15(2) (pp. 251-276)
Asar (2017) Some new methods to solve multicollinearity in logistic regression 46(4) (pp. 2576-2586) 10.1080/03610918.2015.1053925
Bancroft (1944) On biases in estimation due to the use of preliminary tests of significance (pp. 190-204) 10.1214/aoms/1177731284
Unknown ()
Unknown ()
Hoerl and Kennard (1970) Ridge regression: applications to nonorthogonal problems (pp. 69-82) 10.1080/00401706.1970.10488635
Molina et al. (2005) Didanosine in HIV-1) infected patients experiencing failure of antiretroviral therapy: a randomized placebo-controlled trial 191(6) (pp. 840-847) 10.1086/428094