Department of Textile and Polymer Engineering, Yazd Branch, Islamic Azad University, Yazd, IR
Department of Textile Engineering, Islamic Azad University of Qaemshahr, Qaemshahr, IR
Abstract
In this paper, we aimed to evaluate Acid Blue 62 removal from aqueous media, using mesoporous silicate MCM-41, loaded with polypyrrole (PPy) and polyaniline (PAni) composites. PPy/MCM-41 nanocomposite showed higher performance than PAni/MCM-41 due to its smaller molecule size. For characterizing the synthesized composites, different methods were applied. The Langmuir model showed the greatest agreement with the experimental findings (
qm
, 55.55 mg g
−1
). The kinetic study also confirmed the compatibility between the pseudo-second-order model and adsorption. Moreover, we measured Gibbs free energy changes (Δ
Go
) and enthalpy changes (Δ
Ho
). Considering the negative Δ
Go
and positive Δ
Ho
, AB62 adsorption on PPy/MCM-41 nanocomposite can be considered a spontaneous, endothermic reaction.
Introduction
The presence of dyes in industrial wastewaters is a major issue in different countries. Different industries, including textile printing, plastic, pharmaceutical, and food industries, use dyes in their procedures. About 20% of dye production in the world is lost during the dyeing process [
1
]; therefore, the presence of dyes in wastewater is inevitable.
Dye removal from wastewater is significant, as the quality of water greatly depends on color; even a very low dosage of dye (<1 ppm) can be easily seen in water and is found to be unfavorable. Besides, most dyes result in the occurrence of diseases, such as skin inflammation, skin irritation, carcinomas, and mutations in humans [
1
]. Removal of colored contaminants from wastewater is carried out using various techniques, including biological and physicochemical technologies.
Oxidation [
2
], coagulation–flocculation [
3
], separation of membranes [
4
], and adsorption [
5
,
6
] are among the major processes involved in treatment. Among the mentioned processes, adsorption is the most frequently used technique, showing feasibility, high yield rate, and less expenditure [
5
]. Species in the adsorption process are moved to the solid phase and can minimize the effluent volume [
1
].
Researchers have recently introduced favorable adsorbents [
5
,
6
–
7
]. Highly porous materials such as mobile crystalline material-41 (MCM-41) [
8
,
9
], modified hexagonal mesoporous silica (HMS) [
5
,
10
], and nanoporous silica (SBA-15) [
11
] seem to be appropriate for removing different dyes. Different types of surfactants are used for the preparation of these materials. Surfactants act as templates throughout sol–gel and hydrothermal processes. The main characteristics of mesoporous materials include great specific surface area, uniform and limited pore size distribution, and great thermal stability [
12
,
13
].
Recently, MCM-41 has been used for the adsorption of dyes from wastewater. Considering the presence of SiO and SiOH (known to adsorb cationic dyes and inhibit anionic dye adsorption), the structure of MCM-41 is negatively charged [
14
]. The importance of interaction between MCM-41 and safranin (a large positively charged dye) was examined in a previous study [
15
]. To enhance the MCM-41 capacity in adsorbing specific substances, it is necessary to make surface modifications. Considering the adsorbent–adsorbate interactions, surface modifications also improve the selectivity of MCM-41 [
16
].
Amines, as well-known functional groups, have been used in many studies for surface modification of different types of adsorbents. To eliminate mercury ions from water, MCM-41 was functionalized with diethylenetriamine (DETA) [
9
]. In a previous study, aminopropyltrimethoxysilane (APTS) was applied for MCM-41 (NH
3
+ -MCM-41) modification to remove four types of anionic dyes from the aqueous media [
16
].
Transition metals including nickel are extensively applied for the modification of MCM-41 structure [
17
]. In a previous study, to remove methyl blue from aqueous solutions, highly ordered nickel-supplemented MCM-41 adsorbents were synthesized (with varying nickel contents) [
14
]. Overall, according to our literature research, few studies have been conducted on the use of polypyrrole (PPy)/MCM-41 and polyaniline (PAni)/MCM-41 in anionic dye adsorption.
With this background in mind, PPy/MCM-41 and PAni/MCM-41 nanocomposites were synthesized in the current study. Nanocomposites were described using different methods, including transmission electron microscopy (TEM), scanning electron microscopy (SEM), Fourier transform infrared spectroscopy (FTIR), X-ray diffraction (XRD) analysis, and BET method. Through performing batch experiments, the efficiency of PPy/MCM-41 and PAni/MCM-41 in AB62 elimination from aqueous media was also examined. Moreover, the significance of solution pH, contact time, temperature, and adsorbent dose was evaluated. Finally, thermodynamic and kinetic evaluations were performed to measure the parameters.
Materials and methods
Substances
The reagents used for the preparation of samples and experimental tests included cetyl-trimethyl-ammonium bromide (CTMABr), ammonium hydroxide, tetraethyl ortho silicate (TEOS, SiC
8
H
20
O
4
), aniline, pyrrole, potassium iodate (KIO
3
), ferric chloride, sulfuric acid, acetone, hydrochloric acid (HCl), NaOH, Na
2
HPO
4
, NaH
2
PO
4
, and deionized water (Merck Co., Germany). Moreover, Dystar Co. (Germany) provided anionic dye (Acid Blue 62 or AB62,
λmax
= 595 nm). Figure
1
illustrates the chemical composition of AB62.
Fig. 1
Molecular structure of dye Acid Blue 62
MCM-41 synthesis
MCM-41 synthesis was performed in line with the technique proposed by Kamarudin et al. [
18
]. In brief, 2.4 g of cetyltrimethylammonium bromide (CTMABr) as the template was added to deionized water (120 g) and stirred to form a uniform solution. Afterward, ammonium hydroxide (8 mL) was added and stirred over 5 min. Following that, 10 mL of tetraethyl orthosilicate (TEOS), as the silicon source, was added and stirred for 24 h.
The solution was moved to a steel autoclave and stored at 145 °C for 2 days. The pH was adjusted typically during 48–72 h to attain stability. The obtained product was filtered, washed, and stored at 100 °C for 1 day. In the final step, calcination was performed at 600 °C for 5 h.
PAni/MCM-41 nanocomposite preparation
For the preparation of PAni/MCM-41, potassium iodate (KIO
3
, 1 g) and 1 M sulfuric acid (100 mL) were mixed and stirred during 10 min. Afterward, 0.2 g of cetyl trimethylammonium bromide surfactant, along with 1 g of MCM-41, was added. Following a 20-min interval, distilled aniline monomer (1 mL) was mixed in the solution. The color of the solution changed from light to dark violet, indicating the occurrence of polymeric reaction and formation of PAni.
The reaction was performed at room temperature during 5 h. Finally, the composite was filtered and impurities were eliminated. PAni/MCM-41 composite was rinsed several times using distilled water and acetone and placed in an oven during 1 day at a temperature of 70 °C. Finally, PAni/MCM-41 composite was stored in a desiccator for subsequent experiments [
6
,
7
].
PPy/MCM-41 preparation
For preparing PPy/MCM-41 nanocomposite, 5.4 g of ferric chloride was added to distilled water and stirred for 20 min. Afterward, MCM-41 (1 g) and pyrrole (1 mL) were mixed in the filtered solution. For fulfilling the polymerization reaction, the final mixture was stirred for 5 h. The synthetic composite was filtered and dried for 24 h [
11
].
Characterization
XRD patterns were obtained by a refractometer (35 kV, 28.5 mA, and 298 K; Philips Instruments, Australia). The BET surface area was estimated with respect to nitrogen adsorption at −196 °C. The BJH method (Quantachrome NovaWin2, USA) was utilized to measure the size and volume distribution of pores, based on the N
2
adsorption–desorption isotherm curve. The existence of functional groups on MCM-41 surface was determined with FTIR (8400S, Shimadzu, Japan) at wavenumbers of 400−4000 cm
−1
based on the KBr method. We used UV–Vis spectrophotometry for determining dye concentration before and after adsorption. TEM images of the adsorbents were obtained by a Philips camera (CM120, the Netherlands) operating at 150 kV. Also, SEM analysis (HITACHI S-4160) was used for identifying the sample morphology.
Batch experiments
Batch experiments were performed with 100 mL of various concentrations of dye solution (20, 40, 60, 80, and 100 mg L
−1
). The experiments were performed in an incubator at 200 rpm. The pH of dye solutions was adjusted to 2–10 with HCl and NaOH solutions (0.1 M). Also, the impact of adsorbent dosage, primary dye dosage, duration of contact, and temperature was examined.
To obtain the equilibrium concentrations, a UV–Vis spectrophotometer was used (6310, JENWAY, UK). After contact durations of 15, 30, 45, 60, 90, 120, and 180 min, sampling was performed; the samples were centrifuged at a speed of 6000 rpm during 30 min. Equation (
1
) was used to measure the adsorption potential of the adsorbent:
qt=Co-CtV/M.
In this equation,
qt
(mg g
−1
) represents the adsorption efficiency at time
t
until equilibrium,
Co
and
Ct
(mg L
−1
) denote dye dosage at baseline and time
t
, respectively,
V
denotes dye volume (
L
), and
M
represents the concentration of the adsorbent (g). In addition, Eq. (
2
) was used to calculate the dye removal efficiency:
Removal efficiency=Co-Ct/Co×100.
Results and discussion
Characterization
Figure
2
demonstrates the N
2
adsorption/desorption isotherms related to MCM-41, PAni/MCM-41, and PPy/MCM-41 nanocomposites. Isotherm type IV was recognizable for MCM-41 with hysteresis. An obvious rise in the adsorbed N
2
was reported at
P
/
P0
of 0.6–0.8, which characterizes mesoporous materials [
19
,
20
–
21
]. It was concluded from the BJH method that MCM-41 has a limited pore size distribution (average, 6.7 nm). Table
1
demonstrates parameters including the average pore diameter, as well as pore volume in MCM-41 and synthesized nanocomposites.
Fig. 2
N
2
adsorption–desorption isotherms of MCM-41, PAni/MCM-41, and PPy/MCM-41
Table 1
Characterization results of MCM-41, PAni/MCM-41, and PPy/MCM-41
Sample
Surface area (BET) (m2 g−1)
Pore diameter (BJH) (nm)
Pore volume (BJH) (cm3 g−1)
MCM-41
1003.61
6.7
0.78
MCM-41/PAni
535.34
4.8
0.47
MCM-41/PPy
434.89
3.6
0.32
After pyrrole and aniline polymerization, the inflection point of the nanocomposite isotherm changed to a lower
P
/
P0
; based on this finding, PPy and PAni were in the MCM-41 channels [
21
,
22
]. Moreover, the reduction in BET surface area, as well as pore volume and size, in PPy/MCM-41 and PAni/MCM-41 nanocomposites clearly shows that the polymers penetrated into the MCM-41 channels [
19
,
21
,
22
].
According to the findings, the MCM-41 BET surface area reduced from 1003.61 to 434.89 and 535.34 m
2
g
−1
after loading with PPy and PAni, respectively. PPy with smaller molecules could rapidly fill the MCM-41 pores in comparison with PAni; therefore, it caused pore obstruction and decreased the BET surface area.
Figure
3
indicates the XRD analysis of synthesized MCM-41, PAni/MCM-41, and PPy/MCM-41 in the range of 0 < 2
θ
< 10. There was a sharp peak at 2 < 2
θ
< 3, as well as two weaker peaks at 3 < 2
θ
< 5, which are attributed to (100), (110), and (200) planes of the MCM-41 structure [
23
]. According to Fig.
3
, following PPy and PAni loading, the XRD pattern of MCM-41 was comparable with pure MCM-41. Nevertheless, the diffraction intensity of PPy/MCM-41 was below that of MCM-41 and PAni/MCM-41. MCM-41 pore filling with PPy might be the probable reason for the reduction in peak intensity.
Fig. 3
XRD patterns of MCM-41, PAni/MCM-41, and PPy/MCM-41
Coating of MCM-41 outer surface by amine groups did not majorly affect MCM-41 diffraction intensity [
24
]. According to this finding, it can be concluded that quick pore filling in the presence of PPy is attributed to the smaller molecular size of PPy, compared to PAni. On the other hand, as for the small size of PPy particles, they can penetrate into the MCM-41 structure, generating more positions to absorb a constant volume. Since a larger number of molecules can penetrate into the pore throughout MCM-41 loading, the structure rapidly collapses and leads to the reduction of diffraction intensity [
19
,
22
,
25
].
In Fig.
4
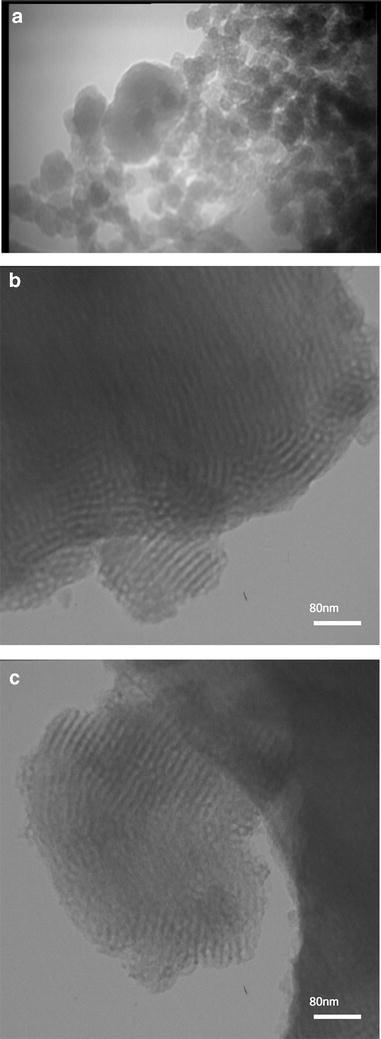
, SEM results are presented. The MCM-41 and composites are formed with small particle sizes (almost uniform). The increase in MCM-41 particle size after loading indicates the contribution of PPy and PAni to the formation of composites. In addition, TEM findings are presented in Fig.
5
. It can be observed that both MCM-41 and composites had hexagonal well-ordered mesoporous structures, where organic compounds could easily access the active sites. Therefore, MCM-41 pore structure after PPy and PAni loading remained undamaged, and PPy and PAni were evenly scattered on the MCM-41 surface [
14
]. Also, the light and black points on the surface of the composite are representative of MCM-41 nanopowder and PAni-PPy, respectively.
Fig. 4
SEM images of MCM-41, PAni/MCM-41, and PPy/MCM-41
Fig. 5
TEM images of MCM-41, PAni/MCM-41 and PPy/MCM-41
To explain the surface properties of MCM-41 for identification of functional groups, the FTIR technique was applied. Figure
6
demonstrates the MCM-41 and composite spectra (range 400–4000 cm
−1
). The band at 3400 cm
−1
was attributed to the surface hydroxyl groups (SiOH) [
14
]. The observed peaks at 1030–1080 cm
−1
indicated asymmetric stretching vibrations pertaining to the Si–O–Si bridges. In addition, the absorption bands observed at 780–800 cm
−1
were a result of symmetric stretching vibrations of Si–O–Si. Also, Si–O bending vibrations were observed at 450–460 cm
−1
[
14
].
Fig. 6
FTIR spectra of MCM-41, PAni/MCM-41, and PPy/MCM-41 before and after AB62 adsorption
The C=C bonds at 1584 and 1492 cm
−1
were related to quinonoid and benzenoid rings, respectively, in the PAni/MCM-41 composite; the peaks at 1300 cm
−1
were related to C–N [
26
]. The peak at 810 cm
−1
indicated out-of-plane C–H deformation in the Π-disubstituted benzene ring. The strong broad band at 3427 cm
−1
for PPy/MCM-41 was attributed to PPy stretching vibrations. Also, C–H vibrations accounted for the bands at 2918 cm
−1
, whereas bands at 2356 cm
−1
were related to stretching vibrations of C–N.
C=C ring stretching of pyrrole accounted for the absorption band at 1635 cm
−1
. The band at 1305 cm
−1
was attributed to C–H vibrations. Also, the peak at 1091 cm
−1
was related to C–O symmetric stretching and in-plane O–H deformation. C–H deformation vibrations in the CH=CH group could account for the peak at 910 cm
−1
[
21
,
25
,
27
].
Comparison of MCM-41 and PPy/MCM-41 FTIR patterns indicated that some bands had disappeared and, therefore, PPy was incorporated in MCM-41 particles. In addition, the distinguished absorption peak of PPy/MCM-41 near 3427 cm
−1
decreased following AB62 adsorption. This finding showed that PPy/MCM-41 pore structure changed with dye adsorption probably because of inherent disorder, and not the MCM-41 structure collapse.
Adsorption assessments
pH
Overall, pH is the most effective parameter during adsorption, which suppresses the quantity of dye ions on adsorbent active sites [
28
]. The removal efficiency of AB62 was examined in different pH ranges (2–10), whereas other variables including the adsorbent quantity, dye dosage, and temperature remained constant. The importance of pH in AB62 adsorption on the origin and modified MCM-41 is presented in Fig.
7
.
Fig. 7
Effect of pH on the percentage of dye removal by MCM-41, PAni/MCM-41, and PPy/MCM-41 (adsorbent dosage, 0.02 g, 100 mL of dye solutions, initial dye concentration, 40 mg L
−1
, contact time, 90 min, and
T
20 °C)
The primary doses of dye and composites were 40 mg L
−1
and 0.02 g, respectively. As can be seen, a rise in pH from 2 to 10 led to a decline in dye adsorption. The composite surface could attract positive charges at a lower pH [
29
], and the powerful electrostatic bond between the positive and negative charges of composite and dye molecules, respectively, could enhance dye adsorption. In addition, lower AB62 adsorption, observed at alkaline pH, might be associated with electrostatic repulsion among anionic dye molecules and OH ions [
5
].
In comparison with PPy, PAni has a larger molecular size and a lower dye adsorption considering the steric hindrance. In fact, steric hindrance enhances, as the molecular size of the polymer increases [
30
]. In addition, unmodified MCM-41 had a lower dye removal efficiency than MCM-41 modified with PPy; also, PAni/MCM-41 showed lower efficiency in acidic conditions.
Adsorbent concentration
The significance of adsorbent concentration was examined, using 0.02–0.2 g of both composites and 40 mg L
−1
of dye solution in 100 mL solution (pH 2). As presented in Fig.
8
, by increasing the concentration of PPy/MCM-41 and PAni/MCM-41 to 0.1 and 0.15 g, respectively, we could enhance the removal efficiency (up to 81 and 38%, respectively). However, further increase of composites had no effects on removal efficiency due to aggregation of composites [
31
,
32
]. Therefore, 0.1 g of PPy/MCM-41 and 0.15 g of PAni/MCM-41 were considered as the optimal adsorbent dosages for AB62 removal.
Fig. 8
Effect of adsorbent dosage on the percentage of dye removal (initial dye concentration 40 ppm; pH 2; contact time 90 min;
T
20 °C)
Temperature
For evaluating the effect of temperature on PPy/MCM-41 and PAni/MCM-41 removal, assessments were performed at various temperatures with primary dye doses of 40–100 mg L
−1
, 0.1 g of PPy/MCM-41, and 0.15 g of PAni/MCM-41 during 90 min of equilibrium (pH 2). As Fig.
9
presents, removal reduced by increasing the dye dosage and enhanced by increasing the temperature to 323 K; this finding might be attributed to the increased activity on the surface [
5
,
6
]. Therefore, AB62 adsorption on nanocomposite adsorbents is both a spontaneous and an endothermic reaction.
Fig. 9
Effect of temperature on dye removal (initial dye concentration, 40 up to 100 ppm; nanocomposite dosage; 0.1 g of PPy/MCM-41 and 0.15 g of PPy/MCM-41; pH of 2; and contact time 90 min)
Contact time
Dye adsorption by PPy/MCM-41 and PAni/MCM-41 was evaluated at 20 °C; the findings are presented in Fig.
10
. At the beginning of the adsorption process, rapid dye removal occurred, given more access to the active sites. Afterward, adsorption gradually slowed down until equilibrium at 90 min. In the equilibrium state, the adsorption sites of the composites were filled [
33
]. Since PPy/MCM-41 nanocomposite showed higher removal efficiency than PAni/MCM-41 in all the experiments, 0.15 g of PPy/MCM-41 was considered as the optimal dosage and the subsequent experiments were carried out with 0.15 g of PPy/MCM-41.
Fig. 10
Effect of contact time on the percentage of dye removal (initial dye concentration, 40 up to 100 ppm; 0.15 g of PAni/MCM-41 and 0.1 g of PPy/MCM-41 in 100 mL of dye solutions; pH 2; and
T
20 °C)
Adsorption thermodynamics
We used thermodynamic analysis to understand the characteristics and mechanisms of adsorption. Δ
Go
, Δ
Ho
, and Δ
So
values were measured using the following formulae:
kc=CAe/Ce,ΔGo=-RTlnkc,ΔGo=ΔHo-TΔSo,logkc=ΔSo/2.303R-ΔHo/2.303RT,
where Δ
H
(kJ mol
−1
) is measured with respect to the slope of log
kc
vs. 1/
T
plot and Δ
S
(J mol
−1
K
−1
) is measured relative to the plot’s intercept. Also, Δ
Go
was measured using Eq. (
6
). The results of thermodynamic analysis are shown in Table
2
.
Table 2
Thermodynamic parameters for the adsorption of Acid Blue 62 onto the PPy/MCM-41
Initial dye concentration (mg L−1)
ΔHo (kJ mol−1)
ΔSo (J mol−1 K)
20 °C
ΔGo (kJ mol−1) 30 °C
40 °C
50 °C
20
14.80
64.75
−4.14
−4.82
−5.51
−6.07
40
13.44
54.01
−3.55
−4.41
−4.83
−5.19
60
12.12
46.77
−0.36
−0.60
−1.08
−1.78
80
11.88
40.16
−0.22
−0.52
−1.00
−1.27
100
10.12
38.21
−0.20
−0.41
−0.88
−0.91
According to Table
2
, increasing the temperature could enhance adsorption. Therefore, dye adsorption on PPy/MCM-41 was endothermic, as confirmed by the positive value of Δ
Ho
. On the other hand, the heat of physical adsorption was less than 21 kJ mol
−1
. Based on the Δ
Ho
values, AB62 adsorption on PPy/MCM-41 was in the form of physical adsorption [
5
,
34
,
35
]. The negative Δ
Go
values confirmed the feasibility of dye adsorption. Also, positive Δ
So
values indicated the reversible adsorption of dye on PPy/MCM-41 [
5
,
11
].
Adsorption isotherm equations
Adsorption isotherm equations describe the adsorbent–adsorbate interactions. Isotherm models are applied for designing the adsorption process. To evaluate dye adsorption isotherms, equilibrium data were prepared with 0.1 g of PPy/MCM-14 nanocomposite at 50 °C (pH 2). In this study, five important isotherms were applied to investigate the dye adsorption.
Langmuir isotherm equation
This equation, which is based on monolayer adsorption, was applied to determine the adsorption efficiency. Adsorption was observed on the same active sites on the surface, without any interactions among the adsorbate molecules [
11
].
The nonlinear Langmuir isotherm equation is as follows:
qe=qmkLCe/1+kLCe,
where
qe
denotes the adsorption efficiency in equilibrium (mg g
−1
),
Ce
the equilibrium dosage (mg L
−1
),
qm
the highest adsorption potential (mg g
−1
), and
kL
the Langmuir constant. The binding affinity of dye molecules is indicated by high
kL
values.
Freundlich isotherm equation
This equation is derived from empirical information and is generally applied for the expression of heterogeneous surfaces [
36
]:
qe=KfCe1/n,
where
Kf
represents the adsorption capacity (L g
−1
),
n
(a constant) the intensity of adsorption, and 1/
n
the heterogeneity of the composite surface;
n
values between 2 and 10 exhibit favorable adsorption.
Redlich–Peterson model
In this three-parameter equation, Langmuir and Freundlich isotherms are combined [
37
]:
qe=kRCe/1+αRCeβ,
where
kR
(L g
−1
) and
αR
(L mg
−1
) denote the Redlich–Peterson constants and
β
represents the equation exponent. The Freundlich isotherm is the supreme isotherm when
β
is near 0, while the Langmuir model is predominant when
β
is close to the unit.
Dubinin–Radushkevich equation
It is written as [
38
]:
qe=qme-βε2,
where
qm
denotes the monolayer efficiency (mg g
−1
),
β
the adsorption energy constant, and
ε
the Polanyi adsorption potential:
ε=RTln1+1/Ce.
In this equation,
R
represents the gas constant (8.314 J
−1
mol K
−1
),
T
the absolute temperature,
β
the mean free energy, and
ε
the dye molecules moved to the solid surface. The relation of
ε
with
β
is described as follows:
ε=1/2β0.5.
Temkin isotherm
For investigating multilayer adsorption, the Temkin isotherm was applied [
39
,
40
]:
qe=BlnACe.
Parameters of the isotherms were measured, based on the linear regression of nonlinear forms in the models, as shown in Table
3
. Comparison was performed between the experimental information and model findings with respect to
R2
values:
Langmuirtype 1>Redlich-Peterson>Temkin>Dubinin-Radushkevich>Freundlich. {\text{Redlich}}{-}{\text{Peterson}} > {\text{Temkin}} > {\text{Dubinin}}{-}{\text{Radushkevich}} > {\text{Freundlich}} . $$\end{document}]]>
Table 3
The values of parameters for isotherm models
Isotherm
Nonlinear equation
Linear form
Parameter
R2
Langmuir 1
qe=qmKLCe/1+KLCe
Ce/qe=1/klqm+1/qmCe
qm = 55.55 mg L−1
0.988
Ce/qevs.Ce
Kl = 0.227 L mg−1
Langmuir 2
1/qe=1/klqmCe+1/qm
qm = 55.55 mg L−1
0.972
1/qevs.1/Ce
Kl = 0.818 L mg−1
Langmuir 3
qe = qm − qe/kLCe
qm = 52.47 mg L−1
0.878
qe vs. qe/Ce
Kl = 0.878 L mg−1
Langmuir 4
qe/Ce = qm/kl − qe/kl
qm = 54.47 mg L−1
0.878
qe/Ce vs. qe
Kl = 3.73 L mg−1
Freundlich
qe=KfCe1/n
ln qe = ln Kf + 1/n ln Ce
n = 3.41
0.887
Ln qe vs. ln Ce
Kf = 17.38 (mg g−1) (L mg−1)1/n
Redlich–Peterson
qe=kRCe/1+aRCeβ
LnKR∗Ce/qe-1vs.βlnCe+lnαR
KR = 17.85 L g−1
0.911
αR = 0.38 (L mg−1)β
β = 0.35
Temkin
qe=BlnACe
qe vs. ln Ce
B = 19.63 J mole−1
0.901
A = 11.78 L g−1
Dubinin-Radushkevich
qe=qme-βε2
Ln qe vs. ε2
qm = 46.3 mg g−1
0.881
β = 0.13
E = 1/2β = 1.9 kJ mole−1
Based on the obtained results, Langmuir equation showed the greatest correlation coefficient indicative of monolayer adsorption. Regarding the Freundlich isotherm,
n
was measured to be 3.41, indicating suitable adsorption. The Redlich–Peterson isotherm correlation coefficient (0.911) was below the value obtained by the Langmuir model; as a result, the Langmuir model was introduced as the supreme isotherm.
To continue the experiments, the Dubinin–Radushkevich model was used. The correlation coefficient of this model (0.881) was lower than that of Langmuir. We also applied Temkin isotherm to evaluate multilayer adsorption. The correlation coefficient was measured to be 0.901, which is below that reported in the Langmuir model. Therefore, it can be concluded that monolayer adsorption happened, and the Langmuir model is the predominant one.
Adsorption kinetics
Using different models, the mechanism of adsorption was evaluated. The pseudo-first and pseudo-second-order linear models are commonly used to fit the kinetic information via Eqs. (
14
) and (
15
), respectively:
lnqe-q=lnqe-k1t,t/q=1/khqe2+t/qe,
where
qt
denotes the adsorbate amount in each adsorbent unit at time
t
(mg g
−1
),
k1
the pseudo-first-order constant, and
kh
the second-order constant. The rate constants, as well as the adsorption efficiencies in the pseudo-first-order model, were measured at various doses with respect to the ln(
qe
−
qt
) vs.
t
plot. In addition, in the other model, the rate constants and adsorption capacities were measured at various doses, based on the
t
/
qt
versus
t
plot. The findings are demonstrated in Table
4
.
Table 4
Pseudo-first order, pseudo-second-order, and intraparticle diffusion model parameters for Acid Blue 62 adsorption on PPy/MCM-41 adsorbent
Initial DY86
Pseudo-first order
Pseudo-second-order R2
Intraparticle diffusion
Concentration (mg L−1)
kad (1 min−1)
qe,cal. (mg g−1)
R2
kh (g mg−1 min)
qe,cal. (mg g−1)
qe,ex. (mg g−1)
R2
Kp (mg g−1 min0.5)
C (mg g−1)
R2
20
0.036
22.20
0.97
0.0028
20.40
16.91
0.99
1.33
5.00
0.90
40
0.036
38.70
0.96
0.0003
52.63
32.45
0.99
3.24
1.87
0.98
60
0.032
45.38
0.99
0.0007
43.47
32.66
0.99
3.73
2.12
0.94
80
0.034
56.68
0.94
0.0004
55.55
38.17
0.98
3.93
2.80
0.98
100
0.034
54.24
0.93
0.0005
52.63
40.14
0.98
4.14
2.95
0.97
According to Table
4
, the evaluated models showed great correlation (
R2
), although
qe
values measured by the pseudo-second-order model (
qe
, cal.) showed greater agreement with the experimental values (
qe
, exp.). Therefore, the results demonstrated that AB62 adsorption on PPy/MCM-41 is best characterized, using this model. In fact, it could describe the process of adsorption and indicated that chemical adsorption controls AB62 adsorption on the composite surface.
The adsorption rate can be managed using intraparticle diffusion, along with other kinetic mechanisms including boundary layer or film diffusion effects. Weber and Morris first presented the model of intraparticle diffusion [
41
]:
qt=kpt0.5+C.
In this equation,
C
denotes the intercept,
k
represents the intraparticle rate constant, and
kp
is calculated with respect to the slope of
qt
(mg g
−1
) versus
t0.5
plot. The
kp
values are presented in Table
4
. Based on the findings, given the great driving force, the increase in diffusion rate was associated with an increase in the primary dye dosage.
Intraparticle diffusion characterizes the rate-control stage if the linear regression of
qt
versus
t0.5
plot crosses the origin. Nevertheless, it is obvious from Fig.
11
that the linear graphs did not cross the origin. As a result, other mechanisms could have affected the adsorption rate (it is not only dependent on intraparticle diffusion) [
11
,
42
]. Table
5
presents the comparison of AB62 adsorption on PPy/MCM-41 with other adsorbents used in previous studies [
43
,
44
,
45
–
46
]. As can be seen, the presented adsorbent generally has a good adsorption capacity for AB62. The prepared adsorbent showed a higher adsorption capacity than other composites.
Fig. 11
Intraparticle diffusion model for the adsorption of Acid Blue 62 onto PPy/MCM-41
Table 5
A comparison between the results of the present work and some reported results in literature
Adsorbent
Dye
qe
Refs.
Activated carbon
Acid Red 97
52.08
[43]
Activated red mud
Acid Blue 113
83.33
[44]
Spinel ferrite nanoparticles
Acid Red 88
111.1
[45]
copper oxide nanoparticle loaded on activated carbon
Acid Blue 129
65.36
[46]
Ppy/MCM-41
Acid Blue 62
55.55
This work
Adsorption mechanism
With respect to AB62 adsorption on different adsorbents (i.e., MCM-41/PPy and MCM-41/PAni), various mechanisms can be convoluted including ionic bonding between cationic functional groups of the adsorbents and anionic functional group(s) in dissolved dye molecules. During adsorption, different phenomena may occur. First, in the aqueous medium, AB62 is dissolved and sulfonate groups of dye transform into anionic dye ions (
17
). In the second step, the adsorbent amino groups (PPy and PAni) are protonated in the acidic medium (
18
). According to Eq. (
19
), adsorption continues, given the electrostatic bond between the counter ions:
Dye-SO3Na→DyeSO3-+Na+,PAni&PPy-NH+H+→PAni&PPy-NH2+,PAni&PPy-NH2++Dye SO3-→PAni&PPy-NH2+-3OSDye.
Desorption studies
By performing desorption assessments, we can analyze the adsorption mechanism and the possibility of adsorbent reuse. The interaction of the adsorbent surface with dye molecules (either a strong or a weak bond) determines the reversibility of adsorption. Alkaline solutions (pH 10) were applied to desorb AB62 dye from PPy/MCM-41. The results of desorption study for five cycles are presented in Fig.
12
. As can be seen, PPy/MCM-41 showed desorption ability.
Fig. 12
Adsorption and desorption behaviors of AB62 dye on PPy/MCM-41
Based on our findings, weak forces mainly accounted for the bonding between the adsorbent surface and AB62 molecules and could lead to high desorption capacity and produce adsorbents; the activation energy and thermodynamic parameters also support this finding. The adsorbent showed acceptable adsorption efficiency for AB62 and might be an acceptable adsorbent for treatment purposes.
Conclusion
PPy/MCM-41 and PAni/MCM-41 nanocomposites were successfully synthesized through chemical polymerization and were described using different techniques. The adsorption of AB62 on both synthesized nanocomposites was evaluated in aqueous solutions. Batch experiments demonstrated that the dye removal efficiency of PPy/MCM-41 nanocomposite was more favorable than PAni/MCM-41. The smaller size of PPy molecules in comparison with PAni makes it more capable of removing dyes. Moreover, the significance of pH, adsorbent dosage, duration of contact, and temperature in dye removal was studied. The removal capacity showed adverse dependence on pH, which enhanced by increasing the duration of contact, adsorbent dosage, and temperature. The highest removal efficiency was 90.57% at a pH of 2 and contact time of 90 min, using 20 mg L
−1
of AB62 and 0.1 g of PPy/MCM-41 nanocomposite. Thermodynamic studies showed that adsorption is both an endothermic and a spontaneous reaction. Moreover, the findings reported in equilibrium were compatible with the Langmuir isotherm, and adsorption capacity on PPy/MCM-41 was 55.55 mg g
−1
at a primary dye dosage of 20 mg L
−1
. Based on the intraparticle diffusion model, adsorption is influenced by a boundary layer, as well as intraparticle diffusion. Also, the pseudo-second-order model showed the greatest agreement with the experimental findings.
References
Yang et al. (2011) Effect of template in MCM-41 on the adsorption of aniline from aqueous solution (pp. 2939-2943) 10.1016/j.jenvman.2011.07.006
Castillo et al. (2013) Removal of diethyl phthalate from water solution by adsorption, photo–oxidation, ozonation and advanced oxidation process (UV/H2O2, O3/H2O2 and O3/activated carbon) (pp. 26-35) 10.1016/j.scitotenv.2012.10.062
Saini and Kumar (2016) Simultaneous removal of methyl parathion and chlorpyrifos pesticides from model wastewater using coagulation/flocculation. Central composite design (pp. 673-680) 10.1016/j.jece.2015.12.020
Shirzad Kebria et al. (2015) SiO2 modified polyethyleneimine-based nanofiltration membranes for dye removal from aqueous and organic solutions (pp. 255-264) 10.1016/j.desal.2015.04.017
Binaeian et al. (2016) Synthesis of oak gall tannin-immobilized hexagonal mesoporous silicate (OGT-HMS) as a new super adsorbent for the removal of anionic dye from aqueous solution (pp. 8420-8436) 10.1080/19443994.2015.1020513
Tayebi et al. (2016) Synthesis of polyaniline/Fe3O4 magnetic nanoparticles for removal of reactive red 198 from textile waste water: kinetic, isotherm, and thermodynamic studies (pp. 22551-22563) 10.1080/19443994.2015.1133323
Shabandokht et al. (2016) Adsorption of food dye acid red 18 onto polyaniline modified rice husk composite: isotherm and kinetic analysis (pp. 1-13) 10.1080/19443994.2016.1172982
Sun et al. (2016) Surface modification of MCM-41 and its application in DNA adsorption (pp. 139-144) 10.1016/j.cclet.2015.08.008
Idris et al. (2011) Selective extraction of mercury (II) from water samples using mercapto functionalised-MCM-41 and regeneration of the sorbent using microwave digestion (pp. 171-176) 10.1016/j.jhazmat.2011.07.037
Peng et al. (2014) Adsorption of anionic and cationic dyes on ferromagnetic ordered mesoporous carbon from aqueous solution, equilibrium, thermodynamic and kinetics (pp. 272-282) 10.1016/j.jcis.2014.05.035
Shafiabadi et al. (2016) Removal of Hg(II) from aqueous solution using polypyrrole/SBA-15 nanocomposite (pp. 154-160) 10.1016/j.synthmet.2015.12.020
Prida et al. (2012) Adsorption of toxic metal ion Cr(VI) from aqueous state by TiO2-MCM-41: equilibrium and kinetic studies (pp. 395-403) 10.1016/j.jhazmat.2012.09.052
Wongsakulphasatch et al. (2014) The adsorption aspect of Cu2+ and Zn2+ on MCM-41 and SDS-modified MCM-41 (pp. 301-304) 10.1016/j.inoche.2014.06.029
Shu et al. (2015) Synthesis and characterization of Ni-MCM-41 for methylene blue adsorption (pp. 88-94) 10.1016/j.micromeso.2015.05.006
Kaur et al. (2015) Synthesis and adsorption properties of mesoporous material for the removal of dye safranin: kinetics, equilibrium, and thermodynamics (pp. 19-27) 10.1016/j.jiec.2014.06.019
Anbia and Salehi (2012) Removal of acid dyes from aqueous media by adsorption onto amino-functionalized nano-mesoporous silica SBA-3 (pp. 1-9) 10.1016/j.dyepig.2011.10.016
Tanaka et al. (2012) Effect of pore size and nickel content of Ni-MCM-41 on catalytic activity for ethylene dimerization and local structures of nickel ions (pp. 5664-5672) 10.1021/jp2103066
Kamarudin and Alias (2013) Adsorption performance of MCM-41 impregnated with amine for CO2 removal (pp. 332-337) 10.1016/j.fuproc.2012.08.017
Fang et al. (2010) Electrorheology of a mesoporous silica having conducting polypyrrole inside expanded pores (pp. 338-343) 10.1016/j.micromeso.2009.11.032
Esfandiyari et al. (2017) Characterization and absorption studies of cationic dye on multi walled carbon nanotube–carbon ceramic composite (pp. 35-43) 10.1016/j.jiec.2016.09.031
Radi et al. (2015) The comparison of sonochemistry, electrochemistry and sonoelectrochemistry techniques on decolorization of CI Reactive Blue 49 (pp. 609-615) 10.1016/j.ultsonch.2015.04.021
Liu et al. (2013) CO2 adsorption properties and thermal stability of different amine-impregnated MCM-41 materials (pp. 469-476) 10.1016/S1872-5813(13)60025-0
Zareyee et al. (2012) Preparation of polyaniline/activated carbon composite for removal of reactive red 198 from aqueous solution 4(1) (pp. 799-802)
Gil et al. (2011) Monoamine-grafted MCM-48: an efficient material for CO2 removal at low partial pressures (pp. 291-297) 10.1016/j.cej.2011.09.107
Tao et al. (2010) Adsorption of humic acid to aminopropyl functionalized SBA-15 (pp. 177-185) 10.1016/j.micromeso.2009.12.018
Javadian et al. (2014) Experimental investigation on enhancing aqueous cadmium removal via nanostructure composite of modified hexagonal type mesoporous silica with polyaniline/polypyrrole nanoparticles (pp. 3678-3688) 10.1016/j.jiec.2013.12.066
Idris et al. (2011) Large pore diameter MCM-41 and its application for lead removal from aqueous media (pp. 898-904) 10.1016/j.jhazmat.2010.09.105
Ballav et al. (2012) High efficient removal of chromium (VI) using glycine doped polypyrrole adsorbent from aqueous solution (pp. 536-546) 10.1016/j.cej.2012.05.110
Shahbazi et al. (2011) Functionalized SBA-15 mesoporous silica by melamine-based dendrimer amines for adsorptive characteristics of Pb(II), Cu(II) and Cd(II) heavy metal ions in batch and fixed bed column (pp. 505-518) 10.1016/j.cej.2010.11.053
Belmabkhout et al. (2010) Adsorption of CO2-containing gas mixtures over amine-bearing pore-expanded MCM-41 silica: application for gas purification 49(1) (pp. 359-365) 10.1021/ie900837t
Arshadi (2015) Manganese chloride nanoparticles: a practical adsorbent for the sequestration of Hg(II) ions from aqueous solution (pp. 170-182) 10.1016/j.cej.2014.07.111
Kakavandi et al. (2014) Enhanced chromium(VI) removal using activated carbon modified by zero valent iron and silver bimetallic nanoparticles (pp. 115-124) 10.1186/s40201-014-0115-5
Zhang et al. (2014) One-pot synthesis, characterization and desulfurization of functional mesoporous W-MCM-41 from POM-based ionic liquids (pp. 386-393) 10.1016/j.cej.2013.12.093
Rahman et al. (2014) Optimization, kinetic and thermodynamic studies for removal of Brilliant Red (X-3B) using Tannin gel 2(1) (pp. 76-83) 10.1016/j.jece.2013.11.023
Kumar et al. (2010) Adsorption of dye from aqueous solution by cashew nut shell: studies on equilibrium isotherm, kinetics and thermodynamics of interactions (pp. 52-60) 10.1016/j.desal.2010.05.032
Galve et al. (2013) Combination of ordered mesoporous silica MCM-41 and layered titanosilicate JDF-L1 fillers for 6FDA-basedcopolyimide mixed matrix membranes (pp. 163-170) 10.1016/j.memsci.2012.12.046
Maneesuwan et al. (2013) Synthesis and characterization of Fe–Ce-MCM-48 from silatrane precursor via sol–gel process (pp. 65-68) 10.1016/j.matlet.2012.11.139
Braga et al. (2013) Kinetic study of template removal of MCM-41 derived from rice husk ash (pp. 1013-1018) 10.1007/s10973-012-2516-y
Pouretedal and Ahmadi (2013) Preparation, characterization and determination of photocatalytic activity of MCM-41/ZnO and MCM-48/ZnO nanocomposites 3(3) (pp. 149-155)
Benhamou et al. (2013) Amino-functionalized MCM-41 and MCM-48 for the removal of chromate and arsenate (pp. 135-139) 10.1016/j.jcis.2013.04.026
Raji and Pakize (2013) Study of Hg(II) species removal from aqueous solution using hybrydeZnCl2-MCM-41 adsorbent (pp. 415-424) 10.1016/j.apsusc.2013.05.145
Ghaedi et al. (2013) Study of removal of Direct Yellow 12 by cadmium oxide nanowires loaded on activated carbon (pp. 2258-2265) 10.1016/j.msec.2013.01.052
Gomez et al. (2007) Kinetic and adsorption study of acid dye removal using activated carbon 69(7) (pp. 1151-1158) 10.1016/j.chemosphere.2007.03.076
Shirzad Siboni (2014) Removal of acid blue 113 and reactive black 5 dye from aqueous solutions by activated red mud (pp. 1432-1437) 10.1016/j.jiec.2013.07.028
Konicki (2013) Equilibrium and kinetic studies on acid dye Acid Red 88 adsorption by magnetic ZnFe2O4 spinel ferrite nanoparticles (pp. 152-160) 10.1016/j.jcis.2013.02.021
Nekouei (2015) Kinetic, thermodynamic and isotherm studies for Acid Blue 129 removal from liquids using copper oxide nanoparticle-modified activated carbon as a novel adsorbent (pp. 124-133) 10.1016/j.molliq.2014.09.027