Preparation and characterization of nano-spherical CoFe2O4 supported on copper slag as a catalyst for photocatalytic degradation of 2-nitrophenol in water
Department of Chemistry, Arak Branch, Islamic Azad University, Arak, IR
Abstract
In this research, new catalyst prepared by supporting CoFe
2
O
4
on copper slag (CS) and characterization of this catalyst was done with using scanning electron microscopy image, energy-dispersive X-ray spectroscopy, BET surface area, and X-ray diffraction patterns. UV + H
2
O
2
processes by CoFe
2
O
4
/CS as a photocatalyst was used for degradation of 2-nitrophenol (2NP) as a pollutant in water. Response surface methodology in the Basis of a three-variable Box–Behnken design was applied to determine the effect of pH values (4, 7 and 10), concentration of 2-nitrophenol (10, 20 and 30 ppm), and concentration of H
2
O
2
(30, 60 and 90 ppm) on the levels of response and optimized these operational parameters. The optimal conditions were determined as pH = 10, concentration of 2-nitrophenol = 10 ppm, and concentration of H
2
O
2
= 90 ppm. Degradation efficiency in optimal condition was 96.55%.
Introduction
In recent years, a variety of nanoparticles with various shapes such as spheres, nanotubes, nano-horns, and nano-cages, made of different materials have already been fabricated and explored for many scientific fields, including chemistry, material sciences, physics, medicine, and electronics [
1
]. The advantages of the nanoparticles are mainly due to their nanoscale size and large surface area.
Nanoparticles play an important role in heterogeneous catalysis. One of the major applications of heterogeneous catalysis is photocatalytic oxidation to promote complete mineralization of hazardous pollutants to benign materials. Semiconductor heterogeneous photocatalysis which is classified as advanced oxidation process (AOP) is a useful and effective method for the oxidation of resistant pollutants, such as phenolic compounds [
2
,
3
].
Ferrite nanoparticles have been intensively investigated due to their remarkable electrical and magnetic properties and wide practical applications in catalytic process, ferrofluid technology, information storage system, magnetocaloric refrigeration, and medical diagnosis [
1
,
4
].
Cobalt ferrite (CoFe
2
O
4
) is a class of semiconductors with narrow bandgaps, exhibits characteristics of light response, possesses good photochemical stability, as well as favorable magnetism. Many works have investigated the photocatalytic degradation of the nitrophenols in aqueous dispersions containing TiO
2
or ZnO. The main problem in this process is to separate the catalyst from solution [
2
,
3
]. The presence of CoFe
2
O
4
magnetic nanoparticles fairly enhances the efficiency of the photocatalytic degradation of organic pollutants and can be easily separated from the solution by applying an external magnetic field [
5
,
6
].
CoFe
2
O
4
such as ZnO, ZnS, and TiO
2
is a semiconductor then mechanism of photocatalytic activity of this compound under ultraviolet radiation is electron–hole. Based on this mechanism, the effect of ultraviolet radiation to the surface of semiconductor electrons is transferred from the valence band into the conductive band. The holes in the valence band and the electron in conducting band are created. Holes are strongly oxidizers and after reacting with water or hydroxide anion create hydroxyl radicals. Electrons in the valence band react with dissolved oxygen and after some steps, hydroxyl radicals are produced [
5
–
8
].
Copper slag (CS) is very stable and cheap; it was chosen as the base of the CoFe
2
O
4
for increasing catalyst surface. Mechanical and thermal property of CS is suitable for supporting of catalyst.
Recent research efforts were concentrated on photocatalytic degradation of aromatics wastewater treatment. Aromatics (such as nitrophenols) are inclusive of the compounds, due to the relative stability in the environment, water solubility, toxicity, and health problems. Removal of these pollutants from the output of industrial effluents is of great importance of protecting the environment. Aromatic compounds, a large collection of environmental factors in cancer ubiquitous environmental pollutants such as air, water and soil, can be seen. Thus, these compounds are harmful to human health. Aromatic compounds present in industrial effluents, oil spills, waste, and improper disposal of oil residues can influence the surface water [
7
,
8
].
In this study, a new catalyst prepared by supporting CoFe
2
O
4
on copper slag and characterized using scanning electron microscopy (SEM) image and X-Ray diffraction patterns. For degradation of 2-nitrophenol was used UV + H
2
O
2
process in the presence of CoFe
2
O
4
/CS as a photocatalyst.
Response surfaces methodology (RSM) is a set of statistical techniques and applied mathematics on modeling on experimental results. This method can be used for studying the effect of several factors (with different levels) and their influence on each other. TheCoFe
2
O
4
/CS as a photocatalysis.method is one type of response surface methodology. For photocatalytic degradation of 2-nitrophenol, three-factor and three-level Box–Behnken experimental design was used [
9
–
12
]. The second order equation was used in Box–Behnken experimental design [
13
,
14
].
If all variables are assumed to be measurable, the response surfaces can be expressed as follows:
y=f(χ1,χ2,χ3,…,χk).
The goal is to optimize the response variable
y
. The assumption is that the independent variables
x
, continuously and trial and error control is very little and negligible.
Then, be sure to find a good approximation for the functional relationship between independent variables and the response equation of the second order, which is properly shown in Eq. (
2
) [
15
].
y=β0χi+∑i=1kβiχi+∑i=1kβiiχi2+∑i=1k-1∑j=2kβijχiχj,+ε.
According to Eq. (
1
),
χ
1,
χ
2,
χ
3,…,
χk
are the input factors which influence the response
y
,
k,
and
β0
,
βii
(1, 2, …,
k
),
βij
(
i
= 1, 2, …,
k
;
j
= 1, 2, …,
k
) are unknown parameters and
ε
is a random error. The
β
coefficients, which should be determined in the second order model, are obtained by the least square method. In general, Eq. (
2
) can be written in matrix form.
Y=bx+ε,
where
Y
is matrix of measured values, matrix of independent variables. The matrixes
b
and
ε
consist of coefficients and errors, respectively. The solution of Eq. (
3
) can be obtained by the matrix approach.
B=X′X-1X′Y,
where
X
′ is the transpose of the matrix
X
and (
X
′
X
)
−1
is the inverse of the matrix
X
′
X
[
16
–
18
].
Materials and methods
Materials
In this study, 2-nitrophenol, Cobalt and Iron nitrate salt and other materials were provided from Merck Company (Germany). Copper slag was purchased from the Iranian company of Messbareh. The pH values were adjusted to desired level using dilute NaOH and H
2
SO
4
. The shape, size, and surface morphology of the synthesized CoFe
2
O
4
/CS were examined using the obtained images of a Philips XL-30 Scanning Electron Microscope (SEM). The X-Ray Diffraction (XRD) analysis of the samples was done using a DX27-mini diffractometer. BET surface area of materials was determined by N
2
adsorption–desorption method at 77 K, measured using a BELSORP-mini II instrument. The samples were degassed under vacuum at 473 K for 12 h before the BET measurement. All Ultraviolet/Visible (UV/Vis) absorption spectra were obtained using an Agilent 8453 spectrophotometer. A Metrohm pH meter model 827 was used for measurement of pH amounts. Likewise, to separate the catalyst from samples, an ALC 4232 centrifuge was employed.
Experimental method
50 ml 0.25 M Cobalt nitrate solutions (prepared from Co(NO
3
)
2
·6H
2
O, Merck) were added to the 50 ml 0.5 M Ferric nitrate solutions (prepared from Fe(NO
3
)
3
·9H
2
O, Merck), 100 ml 2 M molar urea solutions was added to this solution and reflux for 12 h in a hot water bath at 90 °C. After completing the process, catalyst CoFe
2
O
4
was precipitate. The precipitate isolated by filtering was washed with distilled water and drying in 110 °C. To stabilize the catalyst on copper slag, copper slag was mixed with CoFe
2
O
4
powder and was put into the furnace for 6 h at 550 °C.
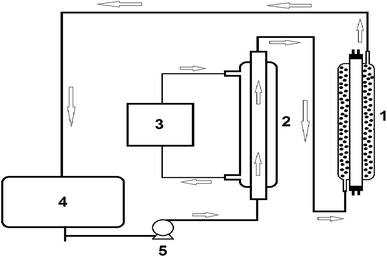
Schematic view of apparatus was show in Fig.
1
. Circulate Packed Bed Reactor (CPBR) with a total volume of 1 L and effective volume of 0.2 L was used in this process. One UV lamp with a power of (15 W, Philips) was placed directly inside the reactor and around the UV lamp was filled with catalyst. The CPBR was filled with 70 g of catalyst CoFe
2
O
4
/copper slag.
Fig. 1
Schematic view of apparatus:
1
reactor CPBR,
2
heat transfer,
3
thermo bath
4
storage tank,
5
water pump
Based on the Box–Behnken experimental design method, several experiments were conducted and factors influencing the photocatalytic degradation were studied. The factors influencing the photocatalytic degradation [pH, the initial concentration of 2-nitrophenol (C
2NP
) and concentration of hydrogen peroxide (
CH2O2
)] were studied.
For photocatalytic degradation experiments, the different volume levels of hydrogen peroxide were added to the 2-nitrophenol solution. Using a dilute solution of sodium hydroxide and sulfuric acid, pH of solutions were adjusted. The resulting solution was transferred to the feed tank and send in to the reactor using a water pump. At certain time intervals, samples were taken and COD was measured.
Results and discussion
Catalyst identification
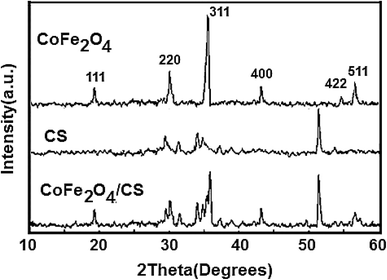
Identification of the catalyst was performed by XRD and SEM devices. The corresponding powder X-ray diffraction (XRD) pattern provides further crystallinity and phase information about the obtained CoFe
2
O
4
. The observed peak positions (as shown in Fig.
2
) are consistent with the characteristic peaks reported for CoFe
2
O
4
in the literature [
19
]. The major crystalline phases present in copper slag was Fayalite (2FeO.SiO
2
)-specified peaks at the 2
ϴ
= 52, and Magnetite (Fe
3
O
4
), Hedenbergite Ca(Fe, Mg)(SiO
3
)
2
, Hematite, and Maghemite-specified peaks in the range of 2
·
= 28–31, which is consistent with previous research [
20
].
Fig. 2
The XRD patterns of photocatalyst CoFe
2
O
4
, copper slag (CS), and CoFe
2
O
4
/CS
Moreover, the mean size of the as-synthesized nanoparticles is calculated from the peak broadening in the XRD pattern using the Debye–Scherrer formula. The average size of CoFe
2
O
4
is 96 nm.
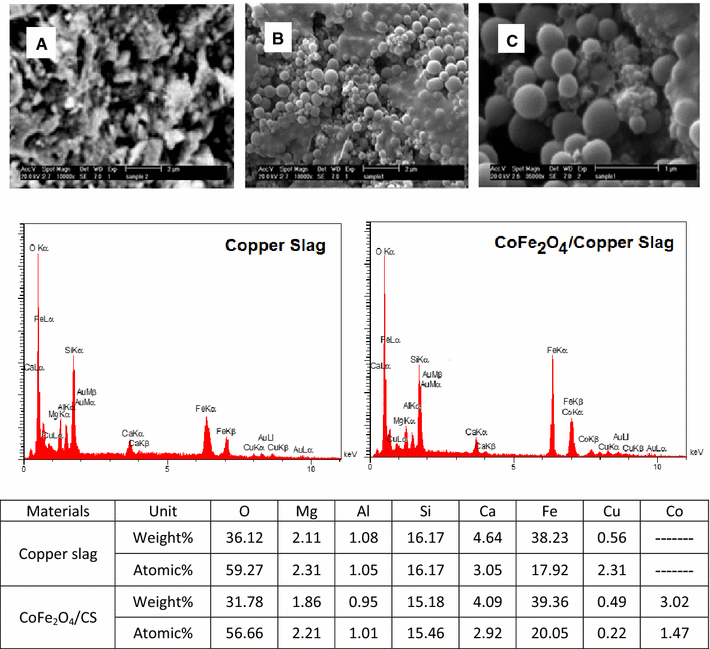
The surface morphology and the approximate particle size of the CoFe
2
O
4
were characterized by SEM and related EDX analysis. The results (Fig.
3
) show that the particles are smooth, having homogeneous surface and very similar nano-spherical particles. Although sizes of particles are different, all have a spherical shape. As show in Fig.
3
, all surface of CS has covered with CoFe
2
O
4
nano-spherical shape. EDX analysis of product also proved that substances that have been established on the surface consist only of CoFe
2
O
4
Nano particle.
Fig. 3
SEM images and their EDX analysis for copper slag (
a
) and CoFe
2
O
4
/CS (
b
,
c
)
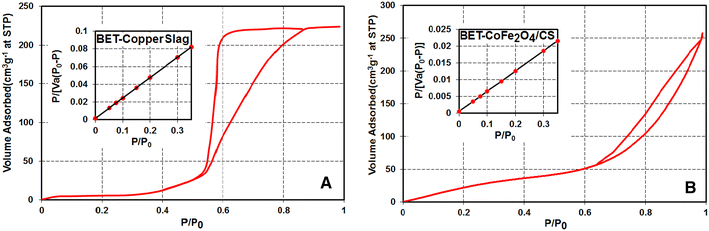
Low-temperature (77 K) nitrogen adsorption-desorption isotherms are used for pore structure analysis of porous materials. The Brunauer–Emmett–Teller (BET) method is used for the determination of surface area of new materials.
Figure
4
shows the adsorption–desorption isotherms and BET surface area for the copper slag, CoFe
2
O
4
, and CoFe
2
O
4
/CS. The adsorption isotherms of the copper slag sample are of type IV and present hysteresis loops of type H2 classification with previous research [
21
], indicating that the structure is mainly mesoporous with pores having narrow mouths (ink-bottle pores). The presented type IV isotherm and present hysteresis loops of type H1, characteristic of mesoporous materials with bottleneck (cylindrical pore geometry) pores and spherical particles, are arranged in a fairly uniform way for CoFe
2
O
4
and CoFe
2
O
4
/CS.
Fig. 4
Adsorption–desorption isotherms and BET surface area for the copper slag (
a
) and CoFe
2
O
4
/CS (
b
)
The BET surface area of copper slag, CoFe
2
O
4
, and CoFe
2
O
4
/CS were determined as 152.46, 283.77, and 310.73 (m
2
/g), respectively. It seems that supporting of nano-spherical CoFe
2
O
4
on the CS has been increasing the BET surface area of the catalyst.
Box–Behnken design
In this research, optimization of 2-nitrophenol degradation processes, with response surface methodology, using Box–Behnken model, was performed. Three independent variables of pH (
X1
), the initial concentration of 2-nitrophenol (X
2
), and the concentration of hydrogen peroxide (
X3
), in three levels (−1, 0, +1) were tested and shown in Table
1
[
22
–
24
].
Table 1
Independent variables and their coded levels used for the optimization of degradation
Key
Factor
Levels
Low
Medium
High
−1
0
+1
X1
pH
4
7
10
X2
C2-nitrophenol (ppm)
10
20
30
X3
CH2O2 (ppm)
30
60
90
With detailed tests was determined the scope of variables. The number of tests required for Box–Behnken model was determined with Eq. (
5
) [
25
].
N=2KK-1+C0.
According to the Eq. (
5
),
N
is the number of samples (tests),
K
is the number of factors (variables), and
C0
is the number of central points.
Table
2
shows the Box–Behnken design of experiment and response achieved.
Table 2
Matrix design of experiments variables and degradation efficiency of 2-nitrophenol
Run
A = pH
B = Initial 2-nitrophenol concentration (ppm)
C = Initial H2O2(ppm)
Photocatalytic degradation efficiency%
Actual
Predicted
15
1
7
20
60
74.25
74.25
4
2
10
30
60
70.12
71.65
5
3
4
20
30
50.06
51.42
13
4
7
20
60
74.25
74.25
3
5
4
30
60
64.58
63.62
2
6
10
10
60
78.66
79.61
9
7
7
10
30
58.36
58.53
12
8
7
30
90
84.75
84.57
1
9
4
10
60
68.65
67.11
7
10
4
20
90
80.38
81.51
14
11
7
20
60
74.25
74.25
11
12
7
10
90
89.54
89.94
10
13
7
30
30
52.85
52.44
6
14
10
20
30
61.15
60.01
8
15
10
20
90
94.82
93.45
The quadratic model and analysis of variance (ANOVA)
All 15 experimental runs designed by the software were performed according to Table
3
. The response was set as percentage of degradation after 180 min. The percentage of initial concentration of pollutant decomposed by the photocatalytic process or the percent of photodegradation efficiency (Degradation%) as a function of time is given by:
Table 3
Regression equations derived for degradation of 2-nitrophenol
The regression equations given in Table
3
were derived from the analysis of variances.
Analysis quadratic polynomials and quadratic model, as it is the best model, for relationships between variables and degradation efficiency 2-nitrophenol was used.
Table
4
shows analysis of variance and was used to validate models.
Table 4
ANOVA results of quadratic model for 2-nitrophenol degradation
Source
DF
Adj SS
Adj MS
F value
p value
Regression
9
2328.45
258.716
97.85
<.000
pH
1
24.11
24.110
11.12
<0.029
C2NP
1
7.89
7.887
9.48
<0.045
CH2O2
1
42.98
42.977
16.25
<0.010
pH × pH
1
11.44
11.437
4.33
0.092
C2NP × C2NP
1
14.59
14.585
5.52
0.066
CH2O2 × CH2O2
1
2.91
2.908
1.10
0.342
pH × C2NP
1
5.00
4.995
1.89
0.228
pH × CH2O2
1
2.81
2.806
1.06
0.350
C2NP × CH2O2
1
0.13
0.130
0.05
0.834
Error
5
13.22
2.644
–
–
Lack-of-fit
3
13.22
4.407
–
–
Pure error
2
0.00
0.00
–
–
Total
14
2341.67
–
–
–
The significance of each term of the predictive model was evaluated by
p
values using a 0.05 significance level; and smaller the
p
value the more significant are the corresponding term. The effect of the independent variables on the degradation of 2-nitrophenol followed the order: concentration of hydrogen peroxide (
CH2O2
) > pH > initial concentration of 2-nitrophenol (C
2NP
) [
26
–
28
].
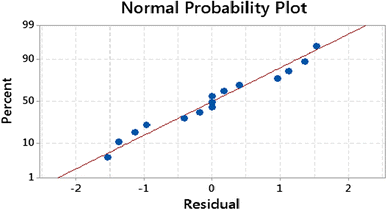
Figure
5
shows the difference between actual and predicted values for efficiency degradation of 2-nitrophenol, to check whether uniformity of variance assumption with the residual charting compared to predict values is possible.
Fig. 5
Normal probability plot of residual for % 2-nitrophenol degradation
Effect of parameters on the system performance
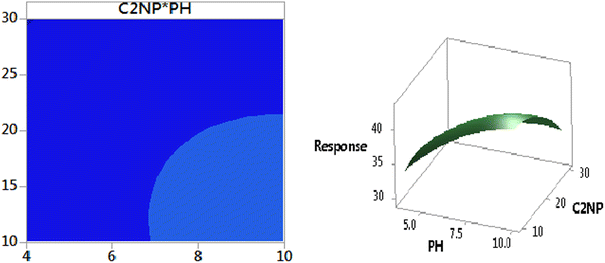
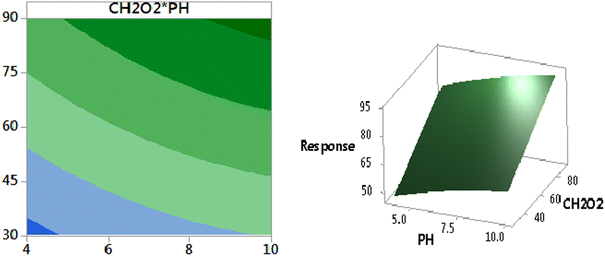
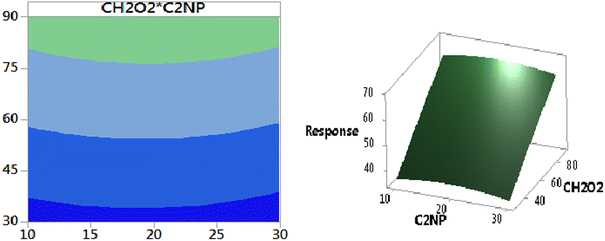
In this study, to investigate more deeply the effect of each variable, the three-dimensional (3D) and contour (2D) plots were formed according to the second order polynomial model to analyze the change in response. Figures
6
,
7
, and
8
depict the surface and contour plots of each interacting variable with two variables kept constant and the other two varying within experimental range.
Fig. 6
Contour plots (
left
) and 3D Response surface (
right
) showing the interaction between pH and initial concentration of 2-nitrophenol (C
2NP
) for photocatalytic degradation of 2-nitrophenol
Fig. 7
Contour plots (
left
) and 3D Response surface (
right
) showing the interaction between pH and concentration of Hydrogen peroxide (
CH2O2
) for photocatalytic degradation of 2-nitrophenol
Fig. 8
Contour plots (
left
) and 3D Response surface (
right
) showing the interaction between initial concentration of 2-nitrophenol (C
2NP
) and concentration of Hydrogen peroxide (
CH2O2
) for photocatalytic degradation of 2-nitrophenol
For photocatalytic degradation efficiency,
CH2O2
in solution was found to have the greatest effect on the response, with the highest
F
value (Table
5
) of 16.25; while both the pH and C
2NP
had less effect regarding the degradation efficiency. According to Table
5
, the interaction effects between the variables appeared insignificant due to the larger values of
p
. The photocatalytic degradation efficiency of 2-nitrophenol was found to increase to decreased C
2NP
and increased concentration of H
2
O
2
and pH.
Table 5
Optimum value of the process parameter for maximum efficiency
A = pH
B = Initial 2-nitrophenol concentration (ppm)
C = Initial H2O2 (ppm)
Photocatalytic degradation efficiency%
Actual
Predicted
10
10
90
96.55
95.28
As seen from Figs
6
,
7
and
8
, degradation efficiency of 2-nitrophenol increased with increasing the pH values, because hydroxyl free radicals are formed faster and better in the alkaline pH.
By reducing the initial concentration of 2-nitrophenol, the contaminant degradation processes carried out better. With the increase in concentration of pollutants, part of the light energy is absorbed by the molecules of pollutants and high-energy beams do not reach the catalyst surface.
It is seen also that concentration of hydrogen peroxide is an important factor that influences degradation efficiency. Photocatalytic degradation increases with increasing the amount of hydrogen peroxide. In the process, hydrogen peroxide decomposes and produces hydroxyl radicals. In addition, hydrogen peroxide, such as molecular oxygen, can attract photocatalytic conduction band electrons and thereby produce hydroxyl radicals [
29
,
30
].
Optimum condition and verification
The accurate optimal values of the variables were obtained and shown in Table
5
. According to the forecasts done, verification experiments were conducted under optimum operational conditions (pH = 10, C
2NP
= 10 ppm,
CH2O2
= 90 ppm). The three replicate experiments yielded an average maximum of degradation efficiency of 96.55%. The similarity between the predicted and experimental results verified the validity of the model and existence of an optimal point. This confirms that the RSM was a powerful tool for determining the exact optimal values of the individual factors [
31
,
32
].
Conclusions
In this study, CoFe
2
O
4
particles were successfully synthesized and based on CS. Synthesize particles were then utilized as a catalyst for the photocatalytic degradation of 2-Nitrophenol in CPBR reactor. The Box–Behnken design was adopted to study the effects of three influencing factors, which were pH, C
2NP
, and
CH2O2
on the degradation efficiency of 2-nitrophenol by CoFe
2
O
4
/ CS. Through ANOVA analysis, Concentration of H
2
O
2
was found to have the most significant effects on degradation efficiency compared to pH and C
2NP
. Response Surface Methodology was applied as an experimental design to explore the optimum conditions for the photocatalytic degradation of 2-nitrophenol. At optimal conditions (pH = 10, C
2NP
= 10 ppm,
CH2O2
= 90 ppm), the degradation efficiency, of the experiment done, was 96.55%.
Acknowledgements
The authors thank the Arak Islamic Azad University for financial support.
Ahmed et al. (2010) Heterogeneous photocatalytic degradation of phenols in wastewater: a review on current status and developments (pp. 3-18) 10.1016/j.desal.2010.04.062
Chen and Mao (2007) Titanium dioxide nanomaterials: synthesis, properties, modifications, and applications 107(7) (pp. 2891-2959) 10.1021/cr0500535
Erik Casbeer et al. (2012) Synthesis and photocatalytic activity of ferrites under visible light: A review (pp. 1-14) 10.1016/j.seppur.2011.11.034
El-Shobaky et al. (2010) Effect of preparation condition on physicochemical, surface and catalytic properties of cobalt ferrite prepared by coprecipitation (pp. 415-422) 10.1016/j.jallcom.2009.12.115
Golsefidi et al. (2016) Effects of capping agent and surfactant on the morphology and size of CoFe2O4 nanostructures and photocatalyst properties (pp. 121-126) 10.1007/s40097-015-0186-6
Palmisano et al. (2006) Influence of the substituent on selective photocatalytic oxidation of aromatic compounds in aqueous TiO2 suspensions (pp. 1012-1014) 10.1039/b515853b
Shimizu et al. (2004) Selective photo-oxidation of benzene over transition metal-exchanged BEA zeolite (pp. 75-80) 10.1016/j.apcata.2004.04.001
Sharmaa et al. (2009) Optimization of process variables for decolorization of Disperse Yellow 211 by Bacillus subtilis using Box–Behnken design (pp. 1024-1029) 10.1016/j.jhazmat.2008.08.104
Ferreira et al. (2004) Doehlert matrix: a chemometric tool for analytical chemistry-review (pp. 1061-1067) 10.1016/j.talanta.2004.01.015
Box and Hunter (1957) Multi-factor experimental designs for exploring response surfaces (pp. 195-241) 10.1214/aoms/1177707047
Kansal et al. (2007) Optimization of photocatalytic process parameters for the degradation of 2,4,6-trichlorophenol in aqueous solutions (pp. 787-802) 10.1080/00986440701193803
Ranjan et al. (2011) Bioadsorption of arsenic: an artificial neural networks and response surface methodological approach (pp. 9852-9863) 10.1021/ie200612f
Nelofer et al. (2012) Comparison of the estimation capabilities of response surface methodology and artificial neural network for the optimization of recombinant lipase production by E. coli BL21 (pp. 243-254) 10.1007/s10295-011-1019-3
Annadurai et al. (2000) Photocatalytic decolourization of congo red over ZnO powder using Box–Behnken design of experiments (pp. 167-173) 10.1007/PL00009120
Mourabet et al. (2012) Removal of fluoride from aqueous solution by adsorption on Apatitic tricalcium phosphate using Box–Behnken design and desirability function (pp. 4402-4410) 10.1016/j.apsusc.2011.12.125
Salahi et al. (2013) Nano-porous membrane process for oily wastewater treatment: optimization using response surface methodology (pp. 218-225) 10.1016/j.jece.2013.04.021
Garg et al. (2008) Removal of nickel (II) from aqueous solution by adsorption on agricultural waste biomass using a response surface methodological approach (pp. 1325-1331) 10.1016/j.biortech.2007.02.011
Khataee et al. (2011) Application of response surface methodology in the optimization of photocatalytic removal of environmental pollutants using nanocatalysts (pp. 1669-1684) 10.1080/09593330.2011.597432
Marghussian and Maghsoodipoor (1999) Fabrication of unglazed floor tiles containing Iranian copper slags (pp. 617-622) 10.1016/S0272-8842(98)00075-3
Sing et al. (1985) Reporting physisorption data for gas/solid systems with special reference to the determination of surface area and porosity (pp. 603-619) 10.1351/pac198557040603
Lin et al. (2009) Photocatalytic degradation of methylparaben by TiO2: multivariable experimental design and mechanism (pp. 32-41) 10.1016/j.apcatb.2008.09.026
Gopinath et al. (2010) Sonochemical degradation of Congo red: optimization through response surface methodology (pp. 427-433) 10.1016/j.cej.2009.12.002
Sharmaa et al. (2009) Optimization of process variables for decolorization of Disperse Yellow 211 by Bacillus subtilis using Box–Behnken design (pp. 1024-1029) 10.1016/j.jhazmat.2008.08.104
Sangal et al. (2012) Optimization of structural and operational variables for the energy efficiency of a divided wall distillation column (pp. 33-40) 10.1016/j.compchemeng.2012.01.015
Mrowetz and Selli (2006) Photocatalytic degradation of formic and benzoic acids and hydrogen peroxide evolution in TiO2 and ZnO water suspension (pp. 15-22) 10.1016/j.jphotochem.2005.09.009
Kansal et al. (2007) Parametric optimization of photocatalytic degradation of catechol in aqueous solution by response surface methodology (pp. 145-153)
Nordin et al. (2004) Application of response surface methodology in describing the performance of coated carbide tools when turning AISI 104 steel (pp. 46-58) 10.1016/S0924-0136(03)00861-6
Rauf et al. (2008) Photolytic decolorization of Rose Bengal by UV/H2O2 and data optimization using response surface method (pp. 602-609) 10.1016/j.jhazmat.2008.02.098
Cho and Zoh (2007) Photocatalytic degradation of azo dye (Reactive Red 120) in TiO2/UV system: optimization and modeling using a response surface methodology (RSM) based on the central composite design (pp. 533-543) 10.1016/j.dyepig.2006.06.041
Korbahti and Rauf (2008) Response surface methodology (RSM) analysis of photoinduced decoloration of toludine blue (pp. 25-30) 10.1016/j.cej.2007.03.007
Sakkas et al. (2010) Photocatalytic degradation using design of experiments: a review and example of the Congo red degradation (pp. 33-44) 10.1016/j.jhazmat.2009.10.050