Center for Materials Science, Zewail City of Science and Technology, 6th October City, Giza, 12588, EG
Microanalysis Lab, Applied Organic Chemistry Department, National Research Centre (NRC), Cairo, 12622, EG
Abstract
Nanostructured metal oxides received considerable research attention due to their unique properties that can be used for designing advanced nanodevices. Thus, in the present study, zinc oxide/graphene oxide (ZnO/GO) nanocomposite was synthesized, characterized and implemented in an electrochemical system. The formation of a compacted ZnO/GO nanocomposite was confirmed by field emission scanning electron microscopy, high-resolution transmission electron microscopy (HRTEM), X-ray diffraction (XRD), and attenuated total reflectance spectroscopy. HRTEM showed that ZnO nanocrystals (NCs) are well formed on the GO surface and are interconnected via GO functional groups. From the XRD patterns, the average size of ZnO NCs was found to be about 21.7 ± 2.3 nm which is in agreement with the HRTEM results. The newly developed nanocomposite-based electrochemical system showed a significant improvement in both electrical conductivity and the electrocatalytic activity as noted from the cyclic voltammetry measurements. Consequently, direct electron transfer efficiency was confirmed and used for the amperometric detection of hydrogen peroxide (H
2
O
2
). Fast and sensitive electrochemical responses for the detection of H
2
O
2
at 1.1 V in the linear response range from 1 to 15 mM with the detection limit (S/N = 3) of 0.8 mM were obtained. These results demonstrated that the prepared ZnO/GO/CPE displayed a good performance along with high sensitivity and long-term stability.
Introduction
Electrochemical techniques have recently showed many advantages in medical and biological analysis such as high sensitivity, low cost, rapid response, and simplicity [
1
]. In the era of nanomaterials, several electrochemical systems have been developed using various nanomaterials such as nanostructured metal oxides [
2
]. Amongst the nanostructured metal oxides, zinc oxide semiconductor nanocrystals (ZnO NCs) have been widely used in photocatalytic [
3
], photonic [
4
] spintronic [
5
], and many other optoelectronic applications [
6
]. This could be attributed to their wide band gap (3.37 eV) and large excitonic binding energy (60 meV) [
7
,
8
]. However, the use of ZnO NCs as a single electrode modifier in electrochemical biosensors is limited since it behaves as n-type semiconductor. This causes fast recombination of the generated electron-hall pairs and low operating speed, and thus, the capability of direct electron transfer is rather difficult [
9
]. Instead, implementation of artificial electron shuttles [
10
] or using hydride substances [
11
] to liberate the captured-(stored)-electrons is highly recommended.
To avoid the utilization of artificial redox mediators, the direct electrochemical communication is more preferable. Thus, the integration (or hybridization) of ZnO with other carbon-based materials has been reported [
12
,
13
]. Due to its interesting mechanical and electrochemical properties, and the ease of its mass production in addition to the abundance of several function groups on its surface [
12
,
14
], graphene oxide (GO) has attracted our attention to build up sensitive and reliable electrochemical sensors and biosensors. In fact the interesting catalytic activity of the ZnO/GO nano-structured has been shown in several electrochemical applications [
15
–
20
]. However, better understanding for the mechanisms behind the use of either the composite or its elemental composition (i.e. individual use of ZnO NPs, or GO NPs) for the direct electron transfer is still unclear.
Therefore, the main concern of this study is to identify the possibility of direct electrochemical uses of ZnO/GO nanocomposite. To reach that goal, fabrication with full characterization of ZnO/GO nanocomposite was performed. Electrocatalytic activity of the target nanostructure was investigated using the redox functions of ferricyanide (FCN). In addition, direct electrochemical detections were performed after testing the role of ZnO alone or upon combination with GO in form of a nanocomposite. Consequently, the modified electrode with the nanocomposite was successfully used for the direct amperometric determination of hydrogen peroxide, as one of the most important biomarkers for several biochemical process and enzymatic functions [
21
,
22
]. The developed ZnO/GO modified CPE presents high sensitivity, low potential and long-term stability towards the detection of H
2
O
2
, which could be a promising approach for the development of non-enzymatic H
2
O
2
sensor.
Materials and methods
Materials
Graphite flakes were purchased from Fisher (UK), chemical reagents such as sulfuric acid (H
2
SO
4
), phosphoric acid (H
3
PO
4
), potassium permanganate (KMnO
4
), hydrogen peroxide (H
2
O
2
), dimethylformamide (DMF), Zinc acetate dihydrate Zn(CH
3
COO)
2·
2H
2
O, phosphate buffer saline (PBS) were purchased from Sigma-Aldrich (Germany).
Methods
Preparation of GO
GO was prepared using improved Hummer method with a slight modification [
23
]. Typically, 3 g of graphite flakes was added to a 4:1 mixture of concentrated H
2
SO
4
/H
3
PO
4
(160:40 mL), 15 g of KMnO
4
was added to the mixture with keeping the temperature below 5 °C using ice bath. The reaction was heated to 60 °C with stirring for 24 h. Finally, the reaction was cooled to room temperature and poured onto ice (~400 mL) with 30 % H
2
O
2
(5 mL). The resulting solution was maintained at room temperature overnight and then the supernatant was decanted away. This process was repeated for 4 days. Afterwards, the dispersion was washed repeatedly with water in a cycle of centrifugation and decantation, and finally washed with ethanol. The product was allowed to dry at 50 °C for 12 h.
Preparation of ZnO/GO nanocomposite
In a typical procedure, 10 mg GO was first dispersed in 10 mL of DMF by sonication for 4 min. Then, the GO suspension was added with stirring to 50 mL of zinc acetate dihydrate [Zn(CH
3
COO)
2
·2H
2
O] dissolved in DMF (0.02 M). Subsequently, the mixture was heated to 90 °C and maintained at that temperature for 5 h. The color of the resulting ZnO/GO powder was then changed into grayish-white. The product was subjected to repeated washing with ethanol followed by centrifugation, and finally washing with water. The pure ZnO/GO powder was obtained after drying the product overnight at 50 °C. ZnO NCs were prepared using the same procedure and used as the control sample.
Morphological characterization
Attenuated total reflectance (ATR) spectroscopy of the produced ZnO/GO nanocomposite was performed using FTIR spectrometer (NECOLET iS10). The morphology of ZnO/GO nanocomposites was investigated by HRTEM (JEOL -JEM- 2100) at an accelerating voltage of 200 kV. Field emission scanning electron microscope FESEM images were carried out using a (Nova Nano SEM 450) at an accelerating applied potential of 15 keV. The X-ray diffraction patterns of the samples were recorded by X-ray diffractometer (Philips PW 1390) using Cu Kα1 as an X-ray source. A thermogravimetric analyzer (TGA Q50) was used to study the thermal behavior of ZnO NCs and the ZnO/GO nanocomposites in the temperature range from 0 to 700 °C with a heating rate of 10 °C min
−1
in a 40 mL min
−1
nitrogen flow.
Sensor preparation
Nano-sensors were prepared by thoroughly mixing 75 mg ZnO/GO and 675 mg synthetic carbon powder with 0.2 mL paraffin oil in a small agate mortar. A portion of the paste was then packed into the tip of the electrode assembly with a surface area of (0.3 cm
2
) [
24
]. Electrode surface regeneration was performed before each experiment by polishing it with a smooth wet filter paper until a shiny and clean electrode surface was obtained. The fabrication of the ZnO/GO-based nano-sensor is illustrated in Scheme
1
.
Scheme 1
A schematic illustration of the preparation of the ZnO/GO nanocomposite and the fabrication of the sensor’s electrode
Electrochemical characterization of ZnO/GO nanocomposite
All electrochemical measurements were performed using a computer controlled Gamry Potentiostat/Galvanostat/ZRA G750, which was connected to a three electrode system comprising of a CPE working electrode, a Pt disc auxiliary electrode, and an Ag/AgCl reference electrode. Prior to the measurements, the working electrode was electrochemically activated in 0.1 M KCl by 10-cyclic scans from −0.2 to 1.0 V with scan rate of 100 mVs
−1
. Aliquots of the FCN were introduced into the electrochemical cell containing 30 mL of KCl.
Direct electrochemical detection of H2O2
The surface of the nanocomposite sensor was activated in phosphate buffer (pH 7.4) by 10-cyclic scans from −0.2 to 1.0 V with a scan rate of 100 mVs
−1
. Then, certain amounts of H
2
O
2
were introduced into the electrochemical cell containing 30 mL of phosphate buffer. All the experiments were carried out at room temperature.
Results and discussion
Structural features of ZnO/GO nanocomposite
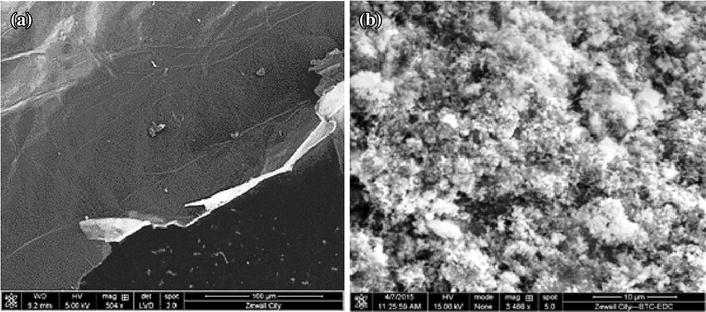
The morphological characterizations of the synthesized GO, and ZnO/GO nanocomposite were examined by FESEM. Figure
1
a shows the basic shape of GO sheet that was significantly exfoliated, and looks like pieces of leaves with a dimension ranging from several hundred nm to several microns. Figure
1
b shows the top view of ZnO/GO nanocomposite which indicates that ZnO NCs are closely anchored at the surface of GO.
Fig. 1
FESEM of
a
GO, and
b
ZnO/GO nanocomposite
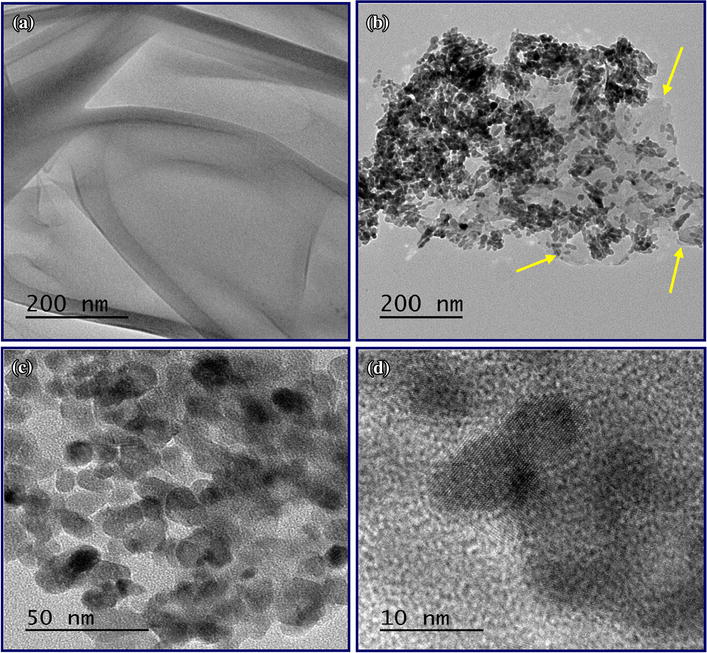
From the TEM images, the GO surface looks smooth and integrated (Fig.
2
a). In the case of ZnO/GO nanocomposite (Fig.
2
b), a large number of ZnO NCs with average diameters 21.7 ± 2.3 nm were observed uniformly on the surface of the GO. The arrows clearly show the edges of the GO sheet. The high magnification TEM image (Fig.
2
c) further reveals that ZnO NCs are almost spherical in shape. The high-resolution transmission electron microscopy (HRTEM) image of the ZnO NCs (Fig.
2
d) shows a clear lattice fringe which indicates a high degree of crystallinity of the ZnO.
Fig. 2
TEM images of
a
GO,
b
,
c
ZnO/GO nanocomposite with different magnifications, and
d
HRTEM image of ZnO NCs anchored GO surface
Furthermore, the XR diffraction patterns of GO, ZnO NCs and ZnO/GO nanocomposite are illustrated in (Fig.
3
). In the diffractogram of GO (Fig.
3
a), the peak appearing at 10.6° is due to the presence of oxygen carrying groups on the GO-surface. This peak was significantly decreased in ZnO/GO nanocomposite (Fig.
3
c) due to exfoliation of GO sheet as a result of the ZnO NCs surface loading. As obvious from (Figs.
3
b, c), a coincidence of diffraction peaks for ZnO NCs and ZnO/GO nanocomposite is highly remarkable indicating the formation of well crystalline structure of ZnO NCs onto the GO surface. Peaks at 31.7°, 34.4°, 36.2°, 47.4°, 56.6° 62.9°, 65.5°, 68.0° and 69.1° that are corresponding to (100), (002), (101), (102), (110), (103), (200), (112) and (201) lattice planes, respectively, indicating the formation of wurtzite structure with 2D hexagonal
P63mc
space group [
25
,
26
].
Fig. 3
XRD patterns of
a
GO,
b
ZnO NCs, and
c
ZnO/GO nanocomposite
For the functional analysis, FTIR-ATR spectra were used as shown in Fig.
4
. The following functional groups were identified; O–H stretching vibrations (3240–3300 cm
−1
), C=O stretching vibration (1720–1740 cm
−1
), C=C from un-oxidized
sp2
C–C bonds (1590–1620 cm
−1
), and C–O vibrations (1250 cm
−1
) [
23
]. Comparing the spectra of ZnO/GO nanocomposite with that of GO demonstrates a slight shift with a reduction in the intensity of the O–H peak (at 3240 cm
−1
). Besides, the peak at about 1740 cm
−1
corresponding to the C=O was disappeared in ZnO/GO nanocomposite. This confirms the formation of ZnO NCs onto the surface of GO accompanied by a partial reduction of the GO. For further physical investigations, thermal gravimetric analysis has been performed (see Fig. 1 in the supplementary information).
Fig. 4
FTIR-ATR spectra of
a
GO,
b
ZnO/GO nanocomposite, and
c
ZnO NCs
Electrocatalytic activity of ZnO/GO
Carbon paste electrode was used in this study due to its ease of fabrication, modification and renewability of its active surface area. For achieving better direct electrochemical detection and identifying the role of the nanocomposite, different electrodes, ZnO, ZnO/GO nanocomposite or unmodified electrode, were prepared and their electrochemical responses were measured. In this regard, Ferricyanide (FCN) was used for testing the electrocatalytic performance of the prepared sensors. Therefore, the redox reactions of FCN using the modified and unmodified electrodes were obtained. As shown in Fig.
5
a, the electrochemical peak currents, either the oxidation or the reduction peaks, increased after incorporating the nanomaterials, either ZnO or ZnO/GO, into the electrode matrix. However, the addition of ZnO/GO nanocomposite exhibited the highest electrochemical signals.
Fig. 5
a
Cyclic voltammograms of different electrodes against FCN (2 mM) in KCl (0.1 M),
b
effect of ZnO/GO concentration on the electrochemical performance of FCN
Due to the catalytic properties of graphene oxides, the conjugation of GO to the ZnO nanoparticles enhanced the electron transfer. GO role in the composite could be demonstrated as a wire-transfer for bridging the electron between the ZnO (that accepts the electrons from the redox molecules) and the electrode surface.
Consequently, the effect of ZnO/GO nanocomposite concentrations, within the electrode matrix, on the measurable oxidation current of FCN was investigated (Fig.
5
b). Specifically, different concentrations ranging from 5 to 20 % (w/w) were selected. As shown in (Fig.
5
b), the electrochemical signal of the 10 % w/w was found to be the highest. To that end, 10 % w/w of ZnO/GO nanocomposite was selected as optimal concentration. Moreover, the impact of FCN concentration was examined against 10 % w/w of ZnO/GO nanocomposite (see Fig. 2 in the supplementary information) and the results showed increase in electrochemical response with the increase of FCN concentration.
The use of ZnO/GO-based sensor for H2O2 detection
As the main concern of this study is to enable the direct detection of H
2
O
2
using the developed nano-structured electrode, the capability of direct electron transfer was tested. In this regards, different concentrations of peroxides were injected into the electrochemical cell and the possibility of direct oxidation was measured. As shown in Fig.
6
, the oxidation peak currents of H
2
O
2
at ~1.1 V were obtained without the addition of artificial redox mediator. However, the chronoamperometric responses of the nano-composite were much higher than that obtained by either the ZnO-based electrode or the bare-CPE.
Fig. 6
a
Cyclic voltammograms obtained at ZnO/GO/CPE in the
a
absence, and presence of
b
1.5 mM,
c
3 mM, and
d
4.5 mM H
2
O
2
, The
inset
is the corresponding calibration curve between the current response and concentration of H
2
O
2
.
b
Amperometric response of different electrodes against H
2
O
2
Therefore, the used nanostructured electrode has the enough electrocatalytic activity to enable the direct detections of peroxide. In addition, the oxidation currents were correlated with the concentrations of H
2
O
2
which reflects the sensitivity as well as the reliability of the proposed sensor.
Effect of pH
Figure
7
shows the influence of pH on the performance of the ZnO/GO modified electrode surface towards the oxidation of peroxides. It was found that the oxidation current increased by increasing the pH values until reaching 7.4 which have the highest peak, after that the peak height decreased. The decreasing of oxidation current at lower pH may be attributed to the protonation of the electrode surface which resists the electron transfer. Therefore, PBS at pH 7.4 was selected as the supporting electrolyte in all subsequent experiments, given that the biosensors would be used under normal physiological conditions [
27
].
Fig. 7
Effect of pH on the oxidation peak of the composite-modified electrode in 0.1 M PBS
Chronoamperometric determinations of peroxide
Using the CVs measurements, the capability of direct oxidation of peroxide using the nanostructured electrode was confirmed. Consequently, the chronoamperometric measurements were performed at 1.1 V versus Ag/AgCl. A standard addition was done by adding a certain concentration of H
2
O
2
at fixed time intervals (30 s). From the time/current curve (Fig.
8
a), a fast response towards each addition was noted, which reflects the rapid electron transfer as well as the electrocatalytic power of the developed nanostructured electrode. Figure
8
b shows the corresponding calibration curve that has a linear response range from 1 to 15 mM with the detection limit (S/N = 3) of 0.8 mM. Method sensitivity for the real physiological concentration of peroxides in the biological samples is sufficient.
Fig. 8
a
Amperometric response of the ZnO/GO electrode upon addition of H
2
O
2
at 1.1 V.
b
The corresponding calibration curve between the current response and concentration of H
2
O
2
Conclusion
In this study, we have reported a facile and cost-effective approach for the fabrication of ZnO NCs on the GO surface. The resulting ZnO/GO nanocomposite was incorporated into the carbon paste electrode matrix producing a significant improvement in the electrical conductivity, electrocatalytic activity which provides a direct electrochemical detection of superoxide. The effect of ZnO/GO nanocomposite concentrations incorporated into the electrode was investigated and it was found that 10 % (w/w) has the highest electrochemical signal. These results revealed that the developed nanocomposite with the high surface area and electrocatalytic activity offers great promise for a non-enzymatic biosensor.
Acknowledgments
The authors are grateful for the group leader of Biological Systems Analysis, Prof. Dr. Ursula (Bilitewski, Helmholtz Centre for Infection Research, HZI, and Braunschweig, Germany) for presenting the Potentiostat (Gamry Potentiostat/Galvanostat/ZRA G750).
References
Thenmozhi and Narayanan (2007) Electrochemical sensor for H2O2 based on thionin immobilized 3-aminopropyltrimethoxy silane derived sol–gel thin film electrode (pp. 195-201) 10.1016/j.snb.2007.02.006
Shen et al. (2009) Devices and chemical sensing applications of metal oxide nanowires (pp. 828-839) 10.1039/B816543B
Chu et al. (2009) Formation and photocatalytic application of ZnO nanotubes using aqueous solution (pp. 2811-2815) 10.1021/la902866a
Willander et al. (2009) Zinc oxide nanorod based photonic devices: recent progress in growth, light emitting diodes and lasers10.1088/0957-4484/20/33/332001
Pearton et al. (2006) ZnO spintronics and nanowire devices (pp. 862-868) 10.1007/BF02692541
Godlewski et al. (2011) Zinc oxide for electronic, photovoltaic and optoelectronic applications (pp. 235-240) 10.1063/1.3570930
Özgür et al. (2005) A comprehensive review of ZnO materials and devices10.1063/1.1992666
Schulz et al. (2014) Tailoring electron-transfer barriers for zinc oxide/C60 fullerene interfaces (pp. 7381-7389) 10.1002/adfm.201401794
Xie et al. (2013) Hydrogen peroxide biosensor based on hemoglobin immobilized at graphene, flower-like zinc oxide, and gold nanoparticles nanocomposite modified glassy carbon electrode (pp. 245-250) 10.1016/j.colsurfb.2013.02.020
Chawla and Pundir (2012) An amperometric hemoglobin A1c biosensor based on immobilization of fructosyl amino acid oxidase onto zinc oxide nanoparticles-polypyrrole film (pp. 156-162) 10.1016/j.ab.2012.08.002
Zhou et al. (2005) Synthesis and electrochemical properties of ZnO 3D nanostructures (pp. 1114-1115) 10.1246/cl.2005.1114
Palanisamy et al. (2012) Highly sensitive and selective hydrogen peroxide biosensor based on hemoglobin immobilized at multiwalled carbon nanotubes-zinc oxide composite electrode (pp. 108-115) 10.1016/j.ab.2012.07.001
Wang et al. (2009) Evaluation of ZnO nanorod arrays with dandelion-like morphology as negative electrodes for lithium-ion batteries (pp. 2851-2855) 10.1016/j.electacta.2008.11.019
Kang et al. (2011) Characteristics of CVD graphene nanoribbon formed by a ZnO nanowire hardmask10.1088/0957-4484/22/29/295201
Wan et al. (2011) Graphene oxide sheet-mediated silver enhancement for application to electrochemical biosensors (pp. 648-653) 10.1021/ac103047c
Wang et al. (2015) Improving photocatalytic performance of ZnO via synergistic effects of Ag nanoparticles and graphene quantum dots (pp. 18645-18652) 10.1039/C5CP02352A
Yang et al. (2011) Hybrid nanostructure heterojunction solar cells fabricated using vertically aligned ZnO nanotubes grown on reduced graphene oxide10.1088/0957-4484/22/40/405401
Geng et al. (2014) Effects of the electric field on the properties of ZnO-graphene composites: a density functional theory study (pp. 3542-3548) 10.1039/C3CP52841C
Chen et al. (2011) Incorporation of graphene in quantum dot sensitized solar cells based on ZnO nanorods (pp. 6084-6086) 10.1039/c1cc10162e
Erman et al. (1989) Detection of an oxyferryl porphyrin. pi.-cation-radical intermediate in the reaction between hydrogen peroxide and a mutant yeast cytochrome c peroxidase. Evidence for tryptophan-191 involvement in the radical site of compound I (pp. 7992-7995) 10.1021/bi00446a004
Zhou et al. (1997) A stable nonfluorescent derivative of resorufin for the fluorometric determination of trace hydrogen peroxide: applications in detecting the activity of phagocyte NADPH oxidase and other oxidases (pp. 162-168) 10.1006/abio.1997.2391
Marcano et al. (2010) Improved synthesis of graphene oxide (pp. 4806-4814) 10.1021/nn1006368
Hassan and Bilitewski (2013) Direct electrochemical determination of Candida albicans activity (pp. 192-198) 10.1016/j.bios.2013.05.015
Bindu and Thomas (2014) Estimation of lattice strain in ZnO nanoparticles: X-ray peak profile analysis (pp. 123-134) 10.1007/s40094-014-0141-9