Department of Civil Engineering, B. S. Abdur Rahman University, Chennai, IN
Post Graduate and Research Department of Chemistry, D. G. Vaishnav College, Chennai, IN
Abstract
An Ag–Cu (AC) bimetallic alloy nanoparticles in various proportions were fabricated by facile electrochemical process is presented in this work. Apart from the electrochemical method of synthesis, the surface morphology, crystal structure and texture as well as the optical properties of the nano alloy have been investigated. The surface morphology and the particle size of the Ag–Cu deposits were deliberated by scanning electron microscopic studies. The preferred orientation and average particle size of the AC NTs were obtained by X-ray diffraction analysis. The well-dispersed AC nano alloy (NA) exhibited ultrafine size and high crystallinity corresponding to face centered cubic Ag and Cu. Ultraviolet–visible spectroscopy was performed to study the optical properties of the nano alloy and the results showed that the nano alloys have wide band gap energies 3.18, 3.57 and 3.03 eV for AgCu, AgCu
2
and AgCu
3
NAs, respectively. The studies on size, morphology and composition of the nanoparticles were performed by means of transmission electron microscopy, and energy dispersive X-ray Analysis.
Introduction
Over a past few decades, nano scale particles have elicited much interest due to their distinct physical, chemical and biological properties. When compared to their bulk counterparts, nanoparticles either single or composite find their way into various areas of science and technology owing to their distinct properties [
1
–
4
]. Bimetallic alloy nanoparticles consist of different metals are of greater interest. Alloying of metal nanoparticles is a technique of emerging new materials that have better high-tech expediency than their parent metal nanoparticles. The properties of alloy nanoparticles can be very different from the properties of the component single metallic nanoparticles from which they are prepared. This provides yet another dimension in amending the properties of nanomaterial besides the usual size and shape manipulation.
Various nanostructures provide a wide range of tunable electrical, magnetic, optical, thermal and chemical properties owing to the quantum confinement effect. The potential applications of nano structured materials still long-drawn-out through catalysis [
5
–
10
], textile engineering [
11
], bioengineering and technology [
12
], water treatment [
9
,
13
], electrochemical sensor [
14
], biosensor [
15
–
18
], non-linear optics [
19
], nano-photonics [
20
], fiber optic sensor [
21
], electronics and corrosion. In particular, it has enthralled much attention in the field of medicine [
22
,
23
] due to their excellent bactericidal eminence. For many years, materials containing particles of metals and their alloys such as copper [
24
,
25
], gold [
26
], silver [
27
,
28
], titanium [
28
] and zinc [
27
,
29
] have been extensively used for antimicrobial applications due to their ability to penetrate through the microorganism causing cell deformation and it has been established that the bactericidal intensity increases with decrease in particle size. In particular, the silver–copper alloy was extensively used for its antibacterial and antiseptic applications in the field of medicine and drug delivery [
30
,
31
].
Although significant progress has been shown in the antibacterial applications, Ag–Cu bimetallic nanoparticles are well known for their electrical properties as the copper mixed silver enhances the electrical migration of copper ion [
32
,
33
]. AC NA plays a key role in sensing the toxic chemical like carcinogens and as an electrochemical sensor [
34
]. Bimetallic AC nano crystals, as a new class of materials, have great potential in optoelectronic devices for the non-linear optical properties due to their excitation of surface plasmon [
35
]. For the quantum confinement effect, AC NA finds use in the field of catalysis [
36
–
38
]. Some of the researchers successfully demonstrated the potential application of Ag–Cu NA in the field of corrosion resistance [
39
], solar cells [
40
], electrochemical sensor, composite fillers [
41
], micro composite for their enhanced electrical properties and protective coating, etc.
A range of approaches have been delibrated for the synthesis of monometallic and bimetallic nanoparticles which include laser ablation [
42
], polyol synthesis [
43
], chemical reduction [
32
,
44
,
45
], co-deposition [
46
], electrodeposition [
47
], solvothermal, colloidal synthesis [
48
], microwave irradiation [
49
], chemical vapor deposition [
50
], and biosynthesis. Each of these approaches suffer to some extent from an inability to guarantee the formation of the specific, desired bimetallic species as well as a limited combination of catalytically active metals. Electrodeposition is one of the more practical methods to make nanostructured materials and the most commercially exploitable technique. Reetz and Helbig (1994) were the first to describe in detail about electrochemical technique for the synthesis of nanoparticles [
51
].
Electrodeposition is such an attractive technique because the driving force and the rate of deposition of the nanoparticles can be easily controlled by either the electrode potential or the current density. This is possible due to the replenishment of electrolyte at the electrolyte-substrate interface replacement during the off time periods, thus allowing current densities even higher than the limiting current density. This establishes conditions of large over-potential and low surface diffusion rates, which are typically associated with higher nucleation rates and suppressed grain growth rates. Besides, this technique is superior to other chemical reduction methods involving strong reducing agents and organic stabilizers for the reason that the particle size and shape of the nano alloy can be controlled by varying the applied current density.
The advantage of this method exists in the rapid, cost-effective, maximum yield and a good control over the particle size during synthesis. As grain sizes of nano scale can therefore be obtained with increased nucleation rates in electrodeposition, this method was chosen for the synthesis of crystalline silver–copper nano alloy (Ag–Cu) in the present study. By controlling their shape and size, scientists can engineer the performances of nanostructures and it has been proved that the properties of these alloys are much superior to their pure metals, as quoted earlier.
Furthermore, these deposition parameters can be changed continuously to make functionally graded materials. Since electrodeposition is highly diverse in nature, no single universal experimental procedure has been found satisfactory to cover all aspects of electrodeposition of single metal and alloy nanoparticles. Various nano alloy combinations can be synthesized by this method and it is relatively easy to set up the electrochemical cell without the need of extensive equipment. Though absolute reproducibility is rather difficult to achieve due to several factors, reproducibility with minimum error is of considerable importance.
Experimental
Materials and method
Silver nitrate (
AgNO3
) and copper sulfate (
CuSO4·5H2O
) were used as the metal precursors for the Ag–Cu nano alloy. Hydrazine sulfate mono hydrate (
N2H6SO4·H2O
) in milli-molar concentration was used as the reducing agent and to stabilize the pH of the electrolytic bath. All the chemicals were of analytical grade obtained from Merck and were used without further purification. The electrolytes were prepared with double distilled deionized water obtained from Merck. All the electrolyte solutions were treated with hydrazine sulfate to obtain the inert atmosphere and to maintain the pH during electrolysis. The synthesis of AC NA was performed in a conventional two electrode electrochemical cell at room temperature. Glassy carbon rods of 10 mm in diameter and 65 mm in length were used as both counter electrode and working electrodes. The electrodes were washed carefully with acetone and water prior to the electrolysis. To simplify the process, electrodeposition of AC NA was carried out using a single acid bath approach. The alloy nanoparticles were electrochemically deposited from three different electrolytes of varied ionic concentrations to study the influence of electrolyte on the nano alloy formation. For all the experiments, the applied current density was maintained at 0.01 ampere/second.
Synthesis of Ag–Cu nano alloy
Reduction of metal ion to zero valence can be achieved by number of methods. Electrochemical method adapted for the synthesis of Ag–Cu bimetallic nano alloy is a unique, operationally simple and a facile route to obtain nano alloys of various sizes and surface morphologies. In a typical electrodeposition process, electrolytes of were prepared mixing 170 mg of
AgNO3
, 250 mg of
CuSO4
and 15 mg of
N2H6SO4
in 100 ml of deionized water. Before the addition of
AgNO3
,
CuSO4
and
N2H6SO4
were mixed in a magnetic stirrer for 5 min. For various compositions of Ag/Cu nano alloy,
AgNO3
concentration was fixed, while the concentration of
CuSO4·5H2O
was changed for different ratios 1:1, 1:2 and 1:3. Hydrazine sulfate in the electrolyte plays a dual role; it acts as pH buffer and as a reducing agent to control the metal oxide formation throughout the process.
During electrolysis both the electrodes were held parallel to each other at 10 mm distance and controlled current of 10 mA/s was passed through the solution. Alloying of AC nanoparticles occurs on co-reduction of
Ag+
and
Cu2+
ions from the acidic bath. The mechanism of electrodeposition is discussed from the point of view of supply of metal ions and their distribution at the cathode surface. The reduction mechanism for an electrochemical deposition of AC NA is shown in Scheme
1
. The actual mechanism of AC electrodeposition is not clearly understood.
Scheme 1
Co-reduction mechanism of AC NA
In a mixture of silver and copper electrolyte, silver would be deposited at the cathode rather than copper. This is due to the fact that metals are deposited electrochemically from the mixture of ionic solution in the inverse order of their position in the electrochemical series, and since copper is positioned under silver,
Ag+
ion deposits predominantly compared with copper ion. During electrolysis
Ag+
ion is reduced faster at the cathode as compared to
Cu2+
ion due to the electrochemical nature of
Ag+
ion. This can be understood form the fact that the reduction potential of
Ag+
to Ag metal in acidic solution is
E0
= +0.79 V whereas the reduction potential of
Cu2+
ion is
E0
= +0.34 V.
Ag++Cu2++2e-→Ag0+Cu+Ag0+Cu+→e-Ag0Cu0
But it was observed that the reduction of copper ion being increased at the cathode surface at high applied current densities (25 mA/cm
2
) due to the fact that an increase in current density usually decreases the amount of the more noble metal deposition.
On the other hand, at the higher concentrations of
Ag+
ion during the co-deposition of Ag/Cu metals, only a small quantity of the metal of copper (electrochemically less noble) is found to be deposited. When the applied current density is reduced both the ions are simultaneously reduced. This can be understood from the fact that the mobility of
Cu2+
ions in solution is greater than
Ag+
ions. It is still a great challenge to understand the nucleation and growth mechanism of bimetallic nanocrystals. The influence of current density can be improved by changing the pH to obtain better co-deposition of
Ag+
and
Cu2+
ions. At optimal pH condition powdery deposits resulted, because of the limiting current density.
Characterization
The surface morphology and the particle size of the nano alloy were determined from the images obtained from JOEL 3010 transmission electron microscope (TEM). The synthesized nano alloy was characterized for size morphology using FEI Quanta FEG 200—high resolution scanning electron microscope. Scanning electron microscope equipped with energy dispersive X-ray detectors (EDX) that have the ability to detect characteristic X-ray generated by the various elements present in the nanoparticles and the results confirmed the molar ratios of Ag–Cu nano alloy. The detailed information about the crystalline geometry of the electrodeposited bimetallic nanoparticles were obtained from powder X-ray diffraction investigation carried out using diffractometer with
Kα
radiation at the scanning rate of 2/min and 2
θ
from 20° to 80°. The average particle size of the nanoparticles was calculated using X-ray diffraction technique. FT-IR spectrum was recorded using Perkin Elmer Spectrum 1 spectrometer operating between 450 and 4000 cm
−1
to explore the modes of interactions between the surface adsorbed molecules and nanoparticles. To divulge the optical properties of the electrodeposited nano twins, diffuse reflectance measurements were carried out using Perkin Elmer Lambda spectrophotometer operating between 200 and 800 nm.
Results and discussions
Optical properties
Alloy nanoparticles are materials used to tune the position of surface plasmon resonance and used for their distinctive non-linear optical properties. Alloy nanoparticles system has been found to exhibit optical limiting properties due to surface plasmon resonance. However, the optical properties of alloy systems are difficult to predict because of the random distribution of materials. The position, shape and the intensity of the surface plasmon band strongly depend on various factors such as ionic concentration, pH and current density, etc.
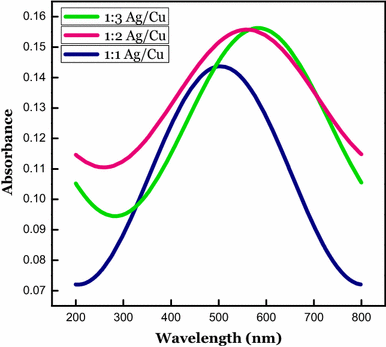
The diffuse reflectance of the Ag–Cu was carried out using Perkin Elmer UV–visible spectrophotometer to determine the absorption edge and band gap energy. The surface plasmon absorption peaks were obtained at different composition of Ag/Cu and are shown in Fig.
1
. The optical properties of the electrochemically synthesized nano alloy were found to vary with the stoichiometry of Ag–Cu composition.
Fig. 1
Optical absorption spectrum of AC nano alloys
Linear shift in the surface plasmon band of nano alloy was observed with increase in concentration of the copper ion. Ag–Cu nano alloy prepared with the 1:1 molar concentration showed a
λ
-max at blue spectrum of UV–vis region which is between the absorption wavelengths of pure copper and silver nanoparticles. This indicated the formation of nano alloy with equimolar concentrations of
Ag+
and
Cu2+
ions. The AgCu
2
nano alloy showed absorption near the lower wavelength (yellow region) and the AgCu
3
nano alloy was absorbed near higher wavelength (red shift). Since the pure metal of copper nanoparticles absorbs radiation near 600 nm in the UV–vis spectrum.
These results indicated that the surface plasmon resonance peaks for each nano alloy vary with the molar concentration of
Ag+
and
Cu2+
ions. It was observed that the position of the SPR peak is shifted toward the blue region when the concentration of the silver ion in the electrolyte is increased and if the molar concentration of copper ion is increased the peak position is shifted toward the red region in the UV–vis spectrum. Further scrutiny showed the shift in position of the SPR peaks for the varied concentrations of the AgCu nano alloy was not only due to the molar concentration of the ions present in the electrolyte but also due to the particle size.
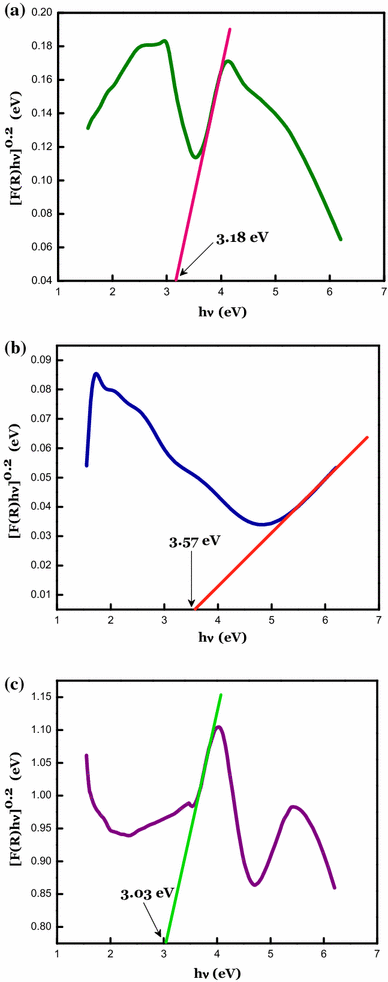
Optical band gap energy for the AC NA was calculated using Kubelka–Munk algorithm
FR=1-R2/2R
. Where
R
is the reflectance and
F
(
R
) is the absorption coefficient. The absorption coefficient values calculated using K–M equation were substituted for α in the Tauc relation
αhνn=Ahν-Eg.
Where
A
is a constant, ‘α’ the absorption coefficient,
Eg
is the optical energy band gap,
h
is the Plank’s constant, ‘
ν
’ is the frequency, and n equals to ½ for the allowed direct transition. The graph was drawn between energy (
hν
) on the
x
axis and absorption coefficient
FRhν1/2
on the
y
axis. The optical band gap was obtained by extrapolating the high energy part of the curve to the
x
axis corresponding to the
F
(
R
) = 0 and the results are shown in Fig.
2
. The optical band gap energy calculated for the AgCu NAs at different compositions was found to be 3.18, 3.57 and 3.03 eV for
AgCu
,
AgCu2
and
AgCu3
NAs, respectively.
Fig. 2
Kubelka–Munk plot of Ag–Cu nano alloy showing the energy band gaps at various proportions
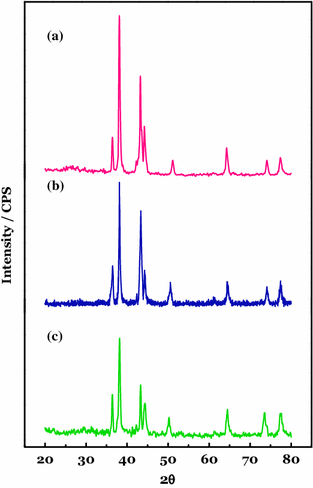
X-ray diffraction spectroscopy (XRD)
Powder X-ray diffraction technique is a powerful tool used in identification and characterization of the crystallographic structure of the nanoparticles. The powder XRD patterns of the as synthesized AC alloy nanoparticles in various proportions are shown in Fig.
3
a–c. The peak position of the nano crystals agrees with those of the bulk, indicating that the crystal structure has not changed as the particle sizes decrease, despite the significant change in the domain size. A small shift in peak position can also be seen, when crystallite size decreases which is due to lattice relaxation.
Fig. 3
Powder X-ray diffractogram of AgCu nano alloy synthesized at different molar ratios
a
AgCu,
b
AgCu
2
and
cAgCu3
No prominent peaks were observed in the XRD pattern indicating the purity of the alloy formation. The XRD pattern of AC nano alloy displays two strong peaks which are assigned to the (111) reflections for silver and copper, respectively. The broad peaks formed by the nano alloy indicate the formation of nano crystals. XRD peaks of AC nano alloy contain clearly distinguishable multiple peaks which can be indexed to Ag and Cu nanoparticles. The diffraction peaks at the Bragg’s angles 36.41, 43.31, 50.41 and 74.12 correspond to the pure copper and at the Bragg’s angles 38.16, 44.35, 64.47 and 74.12 correspond to the pure silver. Powder X-ray diffraction results obtained suggest that the synthesized bimetallic nanoparticles are in high crystalline nature and are well agreed with the standard JCPDS results.
Particle size and micro strain
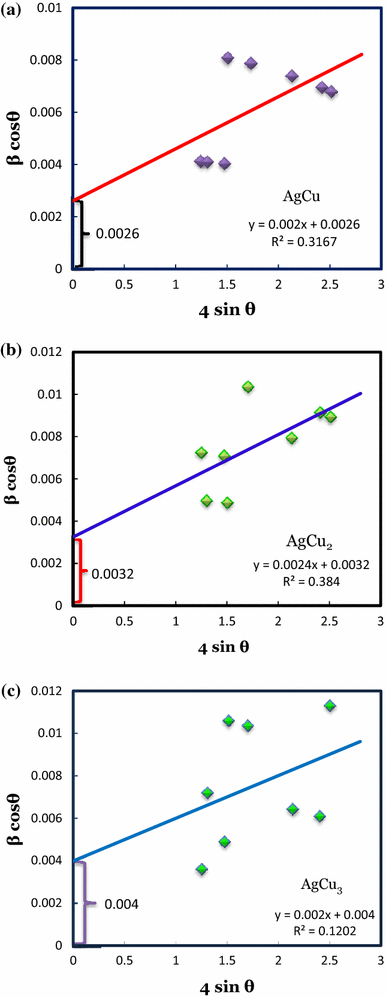
When crystallites are <100 nm in size appreciable broadening in the X-ray diffraction lines will occur. From the line width of the individual XRD peaks, the particle size was estimated using Scherrer formula.
D=KλβDCosθ
Most of the nanomaterials exhibit broadening due to crystal size, imperfection in the crystal formation and strain. Particle size calculated using Scherrer formula is valid when the diffracting nano crystal is stress free. The strain induced broadening due to crystal imperfection and distortion in the AC nano alloy were calculated using Williamson–Hall equation,
βhklCosθ=KλD+4εsinθ
where
D
is the grain size in nanometer,
λ
is the wavelength of the radiation (1.5418
Å
for Cu
kα
radiation),
K
is a constant equal to 0.94,
β
the peak width at half maximum intensity (FWHM) of X-ray diffraction peak in radiance and
θ
the diffraction angle (degrees).While the Scherrer method only provides an average unit cell column length, Williamson–Hall technique also gives estimates of the lattice strain. The strain induced broadening and average crystal sizes for the AC nano alloys were calculated from Williamson–Hall equation and the results obtained are shown in Table
1
. A plot is drawn with 4sin
θ
along the
x
axis and
βhklCosθ
along the
y
axis as shown in Fig.
4
. From the linear fit to the data, the crystalline size was calculated from the ordinate intercept, and the micro deformation is determined from the slope of the fit. It was observed that the average particle size of the AC NA decreases with increase in the molar concentration of
Cu2+
ions and it was also observed that the micro strain in the crystals was almost the same. It is seen that the points in the Williamson–Hall plot were scattered indicating the anisotropic nature of the crystals formed.
Table 1
Geometrical data for Ag–Cu nano alloys fabricated in various proportions
Nano alloy
Energy band gap (eV)
Particle size (nm)
Micro strain ξ
δTEM
δS
δW-H
AgCu
3.18
100
24.41
53.37
0.002
AgCu2
3.57
32
19.16
43.36
0.0024
AgCu3
3.03
54
19.19
34.69
0.002
Fig. 4
The Williamson–Hall analysis of AC nano alloy prepared at 1:1, 1:2 and 1:3 molar concentrations
Transmission electron microscopy (TEM)
HR–TEM is the simplest and most reliable method to measure the size of the metal nanoparticles and it can provide information not only on size and shape but also the crystalline structure of the nanoparticles. Homogeneity and particle size of the alloy nanoparticles obtained by electrodeposition method were characterized by transmission electron microscope (TEM). Among the techniques employed, transmission electron microscope (TEM) is essential technique for the morphology characterization of metal nanoparticles. When energy dispersive X-ray micro analysis is used in conjugation with TEM localized elemental information can be obtained. The capability of the TEM method to provide robust and accurate results on the physical properties such as particle size, shape, and surface morphology/topology depends on the type of material, method of preparation and on a number of image analysis parameters. The most relevant parameters are considered to be the sample preparation, selection of particles and the applied magnification.
Figure
5
shows the TEM images of Ag–Cu alloy NPs prepared from different molar ratios of Ag and Cu ions. Amazingly, all three results of Ag–Cu alloy NPs showed identical particle diameter of about 16 nm with a narrow size distribution (Fig.
5
d–f). The results obtained from TEM analysis indicate that the synthesized Ag–Cu alloy nanoparticles consist of agglomerates of small grains and independent of molar concentrations of the metal precursors. The shapes of the nanoparticles obtained from various proportions were shown to be the spherical in shape. Figure
5
a shows the silver-rich dendrite-like shape having hexagonal copper ends, and Fig.
5
b, c shows the agglomerates of nano alloy. When the concentration of silver ions increased in the electrolyte it results in the cluster formation with minimum number of copper in it.
Fig. 5
TEM images of Ag–Cu alloy nano cluster with different Ag/Cu molar ratio.
a
AC nano alloy prepared at 1:1 molar concentration,
b
AC nano alloy prepared at 1:2 and
c
AC nano alloy prepared at 1:3. Below shown is particle size distribution (
d
–
f
)
Scanning electron microscopy (SEM)
Field emission scanning electron microscope (FESEM) provides topographical and elemental information at high magnifications with virtually unlimited depth of field. It is the wonderful tool to characterize the solid materials especially the nano metal particles. FESEM also provides a three-dimensional image while TEM provides a two-dimensional picture.
Figure
6
shows SEM image of Ag–Cu nano alloy prepared by electrochemical method in absence of surfactant molecules at an optimized conditions. It can be seen from the figure that the electrodeposited nano alloy nanoparticles were grown like dendrites containing both silver and copper in it. When concentrations are varied they showed a different morphology rather than being a dendrite.
Fig. 6
SEM micrographs of AC nano alloy prepared at various proportions of Ag and Cu
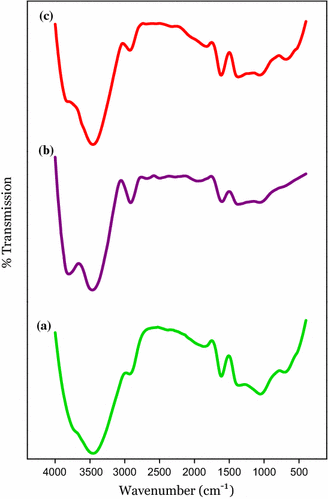
FT-IR
Fourier transform infrared (FT-IR) is used to perform qualitative and quantitative analysis of material’s homogeneity and is shown in Fig.
7
. Infrared spectroscopy provides useful information about the purity and the surface adsorbed molecule of the alloy nanoparticles synthesized. A broad peak obtained at 3200–3600 cm
−1
corresponds to the O–H stretching frequencies of water molecule which might be absorbed from the electrolytic medium. A small intense peak at 1600 cm
−1
can be attributed to the C=O stretching frequency and this is due to the fact that carbon monoxide gas is normally adsorbed on the surface of the metal nanoparticles.
Fig. 7
FT-IR spectrum obtained for AC NAs
From the three IR images obtained at different concentrations of an electrolyte, it is clearly understood that the synthesis conditions do not have influence on the particle frequencies instead it tells the purity of the nano alloy.
Conclusion
This article highlights the recent progress in the synthesis of bimetallic nano alloy with controlled particle dimensions. Using this method, one can easily achieve good control over structure, composition, size and morphology of nanocrystal. The optical band gap studies have shown that the effect of copper ratio in the nano alloy has a significant influence on the optical properties of the nano alloy. Hence, it can be a potential candidate in the field of optic and optoelectronic devices. The electron microscope images revealed the smaller size of the Ag–Cu alloy NPs with spherical morphology. TEM micrographs indicated that the grain size of the Ag–Cu alloy NPs obtained from different molar ratios is independent of the ionic concentrations.
Zhang et al. (2012) Chloroplasts-mediated biosynthesis of nanoscale Au-Ag alloy for 2-butanone assay based on electrochemical sensor10.1186/1556-276X-7-475
Unknown ()
Sotiriou and Pratsinis (2011) Engineering nanosilver as an antibacterial, biosensor and bioimaging material (pp. 3-10) 10.1016/j.coche.2011.07.001
Unknown ()
Unknown ()
Unknown ()
Unknown ()
Sharma and Mohr (2008) On the performance of surface plasmon resonance based fibre optic sensor with different bimetallic nanoparticle alloy combinations10.1088/0022-3727/41/5/055106
Unknown ()
Unknown ()
Unknown ()
Unknown ()
Unknown ()
Unknown ()
Unknown ()
Unknown ()
Unknown ()
Unknown ()
Unknown ()
Unknown ()
Unknown ()
Unknown ()
Piccinin et al. (2010) Alloy catalyst in a reactive environment: the example of Ag–Cu particles for ethylene epoxidation10.1103/PhysRevLett.104.035503
Unknown ()
Zhang et al. (2015) Synergistic effect in bimetallic copper–silver (Cu × Ag) nanoparticles enhances silicon conversion in Rochow reaction10.1039/C5RA04575D
Unknown ()
Bansal et al. (2013) Scattering efficiency and LSPR tunability of bimetallic Ag, Au, and Cu nanoparticles10.1007/s11468-013-9607-x
Zhao et al. (2015) Brazing TC4 alloy to Si3N4 ceramic using nano-Si3N4 reinforced AgCu composite filler (pp. 40-46) 10.1016/j.matdes.2015.03.046
Malviya et al. (2015) Phase formation and stability of alloy phases in free nanoparticles: some insights10.1039/C5RA03924J
Rahman et al. (2012) Synthesis and spectroscopic characterization of Ag–Cu alloy nanoparticles prepared in various ratios (pp. 533-538) 10.1016/j.crci.2012.03.012
Taner et al. (2011) Synthesis, characterization and antibacterial investigation of silver–copper nanoalloys (pp. 13150-13154) 10.1039/c1jm11718a
Unknown ()
Ghodselahi et al. (2014) Synthesis and biosensor application of Ag@Au bimetallic nanoparticles based on localized surface plasmon resonance (pp. 230-234) 10.1016/j.apsusc.2014.02.050
Alqudami et al. (2008) Ag–Au alloy nanoparticles prepared by electro-exploding wire technique (pp. 1027-1036) 10.1007/s11051-007-9333-4
Liu et al. (2012) Dendrimer-mediated synthesis and shape evolution of gold–silver alloy nanoparticles (pp. 22-29) 10.1016/j.colsurfa.2012.04.028
Valodkar et al. (2011) Synthesis and anti-bacterial activity of Cu, Ag and Cu–Ag alloy nanoparticles: a green approach (pp. 384-389) 10.1016/j.materresbull.2010.12.001
Kiani et al. (2012) Low temperature formation of silver and silver-copper alloy nano-particles using plasma enhanced hydrogenation and their optical properties (pp. 142-147) 10.4236/wjnse.2012.23018
Reetz and Helbig (1994) Size-selective synthesis of nanostructured transition metal clusters (pp. 7401-7406) 10.1021/ja00095a051