National Engineering School of Sfax, University of Sfax, Sfax, TN
Laboratory of Coordination Chemistry, Toulouse, 31077, FR
Institute Neel, CNRS and Joseph Fourier University, Grenoble Cedex 9, 38042, FR
Faculty of Sciences, Sfax University, Sfax, 3000, TN
Abstract
The structural, magnetic, and magentocaloric properties are systematically investigated for Pr
0.6
Bi
0.4
Mn
1−
x
Fe
x
O
3
(0.1 ≤
x
≤ 0.3) manganites. The samples have been synthesized by sol–gel method. X-ray diffraction (XRD), scanning electron microscopy, transmission electron microscopy, and Fourier transform infrared spectroscopy were employed to investigate the crystalline structure. Magnetization measurements were used to investigate the magnetic properties. All the samples crystallize in the orthorhombic
Pnma
space group as expected for manganite compounds. The presence of a PrMn
2
O
5
compound is also evidenced by XRD. The average size of the manganite particles is about 50–60 nm. Particle characterizations at the atomic level turn to be of paramount importance. Magnetic measurements versus temperature under an applied magnetic field of 0.01 T show that all samples exhibit a paramagnetic–ferromagnetic transition. Temperature-dependent magnetization measurements and Arrott analysis reveal second-first order ferromagnetic transitions for (
x
= 0.1 and
x
= 0.2). The magnetic entropy change |Δ
SM
| was estimated using Maxwell relation method and is found to reach maximum values of 0.47 and 0.37 J/kg/K under an applied magnetic field of 5 T for
x
= 0.1 and
x
= 0.2, respectively.
Introduction
Since the discovery of the magnetocaloric effect (MCE) in the pure Gadolinium, numerous materials have been the subject of intensive study in order to improve their magnetocaloric properties and to propose them as potential candidate materials for magnetic refrigeration [
1
,
2
]. Owing to their substantial MCE, the perovskite manganites with the general formula Ln
1−
x
A
x
MnO
3
, where Ln is a rare earth ion (Ln = La, Pr, Sm …) and A is a divalent element (A = Ca, Sr, Ba …), have attracted great interest for their colossal magnetoresistance (CMR) and MCE [
3
–
6
]. In fact, magnetic refrigeration is becoming a promising technology to replace the conventional gas compression–expansion technique. For sub-room temperature magnetic refrigeration applications, gadolinium is the first material known to show a large MCE, since it exhibits a maximum value of magnetic entropy change,
ΔSMmax
, of 5 J
/
kg K at 294 K under an applied magnetic field of 2 T [
1
]. As it is well known, their essential magnetic properties are explained by the double exchange (DE) interaction between Mn
3+
and Mn
4+
ions and phase separation [
7
].
In addition, several perovskite manganites exhibit a transition from ferromagnetic to paramagnetic (PM) state near the Curie temperature where the MCE reaches a maximum. The correlation between both structure and magnetic properties is easily revealed and accorded by different elaboration methods.
Among these methods, the sol–gel method considered in this research work shows high ability to control the Curie temperature by substitution of ions in such manganites. In the present paper, we report the synthesis, structure, and magnetic properties of Pr
0.6
Bi
0.4
Fe
x
Mn
1−
x
O
3
nanostructured samples elaborated by sol–gel method.
Experimental section
Preparation of samples
The Pr
0.6
Bi
0.4
Fe
x
Mn
1−
x
O
3
(0.1 ≤
x
≤ 0.3) samples were prepared by a modified sol–gel method [
8
,
9
]. Mixtures of Pr
6
O
11
, MnO
2
, Bi
2
O
3
, and Fe
2
O
3
with up to 99.9 % purity in stoichiometric proportions are used in the desired proportion according to the following reaction:
0.1Pr6O11+0.2Bi2O2+1-xMnO2+x/2Fe2O3→Pr0.6Bi0.4Mn1-xFexO3+δCO2.
The precursors were dissolved in dilute 1 M HNO
3
. Afterward, 3 g of citric acid and 1 mL of ethylene glycol were added and a complete homogenous transparent solution was achieved. Then, the solution was heated on thermal plate under constant stirring at 80 °C to eliminate the excess of water and to obtain a viscous gel [
10
]. Finally, the powders were grinded in an agate mortar and annealed at 900 °C for 4 h [
11
].
Characterization techniques
Fourier transformation infrared spectroscopy
To interpret the different vibrational modes, involving pairs/groups of atoms and the functional groups existing in the prepared Pr
0.6
Bi
0.4
Fe
x
Mn
1−
x
O
3
perovskite samples, Fourier Transformation Infra Red (FTIR) spectra were recorded using a spectrometer (Perkin Elmer 1725). The spectra were recorded in the wavenumber range of 4000–400 cm
−1
at room temperature, in different reflectance modes, at a resolution of 1 cm
−1
. The samples used for the measurements were obtained using the KBr pellet method. The KBr discs were made by pressing the mixture, which contained 10 mg of samples with 100 mg of KBr, at a pressure of 125 kg/cm
2
.
Microscopy
The microstructure and morphology of the Pr
0.6
Bi
0.4
Fe
x
Mn
1−
x
O
3
samples were analyzed using SEM images obtained from scanning electron microscope (JEOL JSM 6700F). The spectrometer was operated at an accelerating voltage of 5 kV. A transmission electron microscope (TEM, JEOL JEM 2100F) was used to obtain substructural information and particle size of the prepared samples by recording TEM images and EDX. The samples for TEM studies were prepared ultrasonically by dispersing the samples in methanol.
X-ray diffraction
Phase purity, homogeneity, and crystal properties were determined by powder X-ray diffraction (XRD) at room temperature using a MPDPro Panalytical diffractometer equipped with CuKα (1.54056 Å) radiation. An additional powder XRD data for the powder calcined at 900 °C for 4 h was collected at ambient temperature in the range 10–70 in the 2
θ
domain with a 0.02 step and a 600 s per step counting time.
Magnetic measurements
Magnetization measurements versus temperature and magnetic field were recorded using a SQuID Magnetometer (MPMS 5 QUANTUM DESIGN (cryo-magnet 5T; cryostat 2–400 K). The evolution of the magnetization with temperature was recorded in the 2–300 K range, under an applied field of 10 Oe. The magnetization versus magnetic applied field measurements were recorded up to 5 T at several temperatures.
Results and discussions
Synthesis
During the synthesis, the sample is an uncolored sol, then the gel turns yellowish, and after precipitation, pulverulent dark brown powders are obtained. After sintering at 900 °C, any significant modification is observed: the samples are pulverulent dark brown powders. Yield ranges from 88, 89, to 92 %, respectively, for
x
= 0.1,
x
= 0.2 and
x
= 0.3, pointing out the efficiency of the sol–gel method.
FTIR spectroscopic investigations
Among numerous applications of vibrational spectroscopy to solid-state problems, those dealing with structural evolution of samples obtained by sol–gel process appear particularly interesting. IR spectroscopy gives qualitative information about the way in which the adsorbed molecules are bounded to the surface as well as structural information of solids. Figure
1
shows FTIR spectra of the different Pr
0.6
Bi
0.4
Fe
x
Mn
1-x
O
3
systems.
Fig. 1
FTIR vibration spectrum of Pr
O.6
Bi
0.4
Fe
x
Mn
1−
x
O
3a
as-made and
b
calcined powder
Figure
1
a shows an example of the as-prepared sample for
x
= 0.3. The absorption bands in the 4000–1000 cm
−1
range are characteristic of –OH, C=O, N–H, and CH
3
functional organic groups, while the region between 1000 and 400 cm
−1
is the fingerprint of the inorganic material. The observed broad bands at 3400 and 2320 cm
−1
can be attributed to the O–H stretching vibration of water molecules [
12
–
14
]. The bands at 1500 and 1066 cm
−1
are ascribed to the stretching vibrations of the aliphatic CH
3
groups [
15
]. The bands between 900 and 400 cm
−1
are mainly due to metal oxide bonds (Bi–O, Fe–O and Mn–O). Similar results are obtained for
x
= 0.1 and
x
= 0.2.
The FTIR spectra of the sintered samples displayed in Fig.
1
b show only two bands. The 960 cm
−1
band is assigned to the vibrations of COOH. The observed broad peak in the low wavenumber range of 560 cm
−1
is characteristic of the Mn–O group [
16
] and can be attributed to the MnO
2
layers linked to the perovskite layers. When the sample was heat treated at 900 °C for 4 h, the absorption characteristic of νO–H stretching vanished, due to water evaporation from the surface of the powder. Our results are comparable to those obtained by Sana et al. [
21
] for Pr
0.6
La
0.1
Ca
0.3
Mn
1−
x
Fe
x
O
3
prepared by sol–gel method and Abir et al. [
17
] for Pr
0.6
Sr
0.4
Mn
1−
x
Fe
x
O
3
prepared by ball Milling and evidence the formation of the desired manganites.
Structural properties
Phase identification and structural analysis were carried out by XRD technique with Cu K
α
radiation at room temperature. The XRD patterns of Pr
0.6
Bi
0.4
Fe
x
Mn
1−
x
O
3
heated at 900 °C for 4 h (Fig.
2
) show that all the samples crystallize in the orthorhombic structure with Pnma space group. The identification revealed the coexistence of two structures. The first one corresponding to PrMn
2
O
5
fitted in the orthorhombic structure with the Pbam
s
pace group [
18
–
20
]. The second phase fits with Pbnm space group (JCPDS files 00-054 0871) and corresponds to the expected orthorhombic perovskite structure associated to the Pr
0.6
Bi
0.4
Fe
x
Mn
1−
x
O
3
[
21
]; the percentage of the secondary phase is nearly constant and is around 20 %. Precisely, the yield ranges from 22.5, 20.9 to 18.9 %, respectively, for
x
= 0.1,
x
= 0.2 and
x
= 0.3.
Fig. 2
X-ray diffraction patterns of Pr
0.6
Bi
0.4
Fe
x
Mn
1−
x
O
3
(
x
= 0.1,
x
= 0.2 and
x
= 0.3) compounds
The average particle diameter,
D
, was obtained using Scherer’s formula [
22
] for the peak width broadening as a function of the size of the particles.
D=Kλβcos(θ),
where
λ
(Cu
Kα
= 1.5418Å) is the X-ray wavelength,
k
is the machine constant (0.916),
θ
and
β
are the diffraction angle and the full width for the most intense peak. The obtained
D
values are about 60 nm regardless of the compounds.
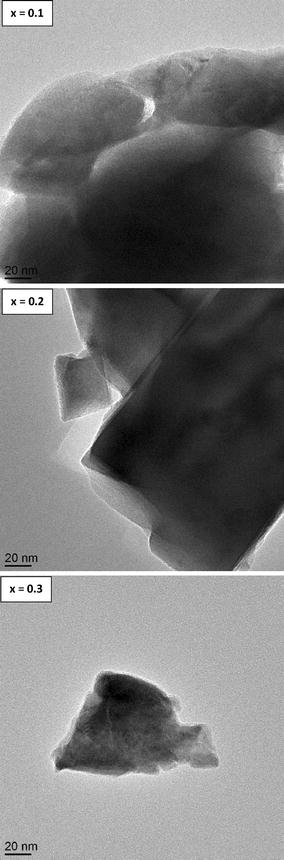
Transmission electron microscopy
In order to better evidence the particle size of Pr
0.6
Bi
0.4
Fe
x
Mn
1−
x
O
3
powders obtained by the sol–gel method, transmission electron microscopy analysis (TEM) was carried out. Figure
3
presents, respectively, the TEM micrographs of the Pr
0.6
Bi
0.4
Fe
x
Mn
1−
x
O
3
powders heat treated at 900 °C for 4 h. Particles of few tens of nanometres to micrometre in size are observed.
Fig. 3
Typical Transmission electron micrographs (TEM) of Pr
0.6
Bi
0.4
Fe
x
Mn
1−
x
O
3
compounds
Energy-dispersive analysis of X-ray (EDX)
Figure
4
shows the EDX spectra of all the sintered samples. It is clear from the EDX spectra that these samples are composed of Pr, Bi, Fe, and Mn elements. The presence of Cu is due to the grid support. The analysis of the amount of the different elements has been performed by EDX at room temperature. Regardless of the sample, the general composition is close to the expected Pr
0.6
Bi
0.4
Fe
x
Mn
1−
x
O
3
(
x
= 0.1,
x
= 0.2 and
x
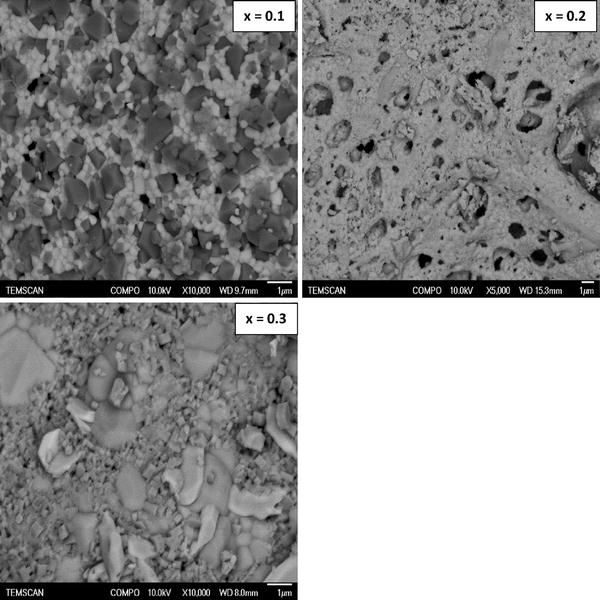
= 0.3) formula. Local quantification highlights that for
x
= 0.2 and 0.3, the composition corresponds to the Pr
0.6
Bi
0.4
Fe
x
Mn
1−
x
O
3
formula, while for
x
= 0.1, local inhomogeneity is observed. Such results were confirmed by SEM measurement (see below). Of course, due to the presence of the PrMn
2
O
5
minority phase, the exact composition of the perovskite structure is erroneous.
Fig. 4
EDAX analysis of Pr
0.6
Bi
0.4
Fe
x
Mn
1−
x
O
3
compounds
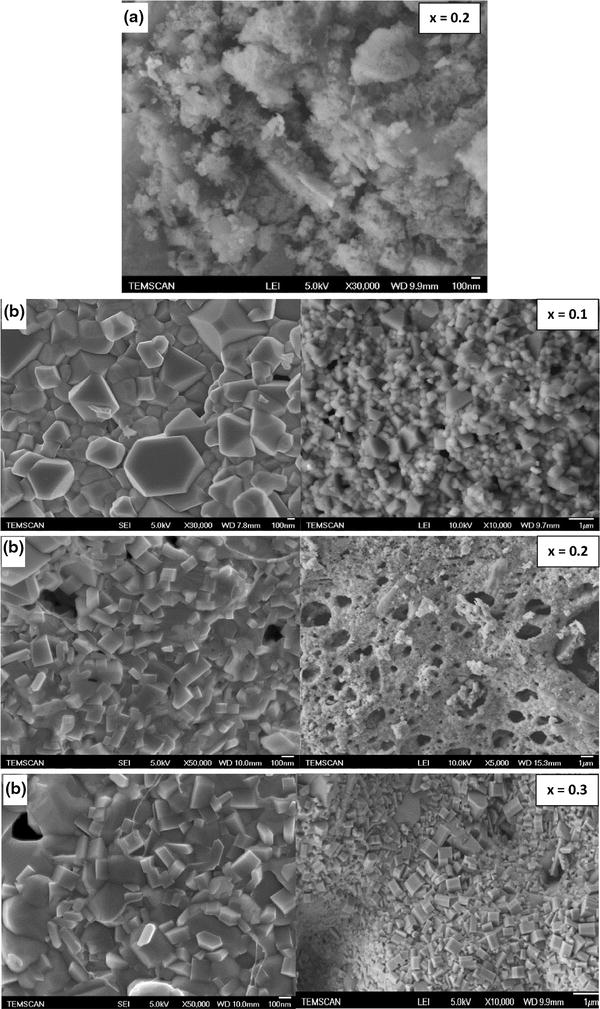
Scanning electron microscopy
The SEM images of the as-prepared and sintered samples are shown in Fig.
5
a. SEM micrograph of the as-prepared sample reveals that regardless of the iron amount, the obtained Pr
0.6
Bi
0.4
Fe
x
Mn
1−
x
O
3
samples are porous and homogenous but with not a well-defined particle shape (see Fig.
5
a for
x
= 0.2). On the other hand, the SEM micrographs (Fig.
5
b) of the sintered samples evidence particles of well-defined shape. Interestingly, some modification of the particle shape is observed. While particles with a hexagonal shape are observed for
x
= 0.1, particles exhibiting cubic shape are observed for
x
= 0.2 and
x
= 0.3 (Fig.
6
).
Fig. 5
Atomic distribution of Pr
0.6
Bi
0.4
Fe
x
Mn
1−
x
O
3
for (
x
= 0.1,
x
= 0.2 and
x
= 0.3)
Fig. 6
Scanning transmission electron microscopy of Pr
0.6
Bi
0.4
Fe
x
Mn
1−
x
O
3
obtained at 900 °C/4 h
Magnetic properties
A systematic investigation of magnetization with temperature of all samples has been undertaken at very low applied magnetic field of 0.01 T (Fig.
7
). The variation of the magnetization (
M
) versus temperature. (
T
) reveals that all samples exhibit a ferromagnetic–PM transition at Curie temperature.
TC
—defined as the temperature at which dM/dT shows a maximum value. The obtained
TC
values are found to be 40, 77, and 52 K for
x
= 0.1, 0.2, and 0.3, respectively. The evolution of
TC
can be explained by the increased number of Fe
3+
–O–Fe
3+
interactions which indicates a weakening of ferromagnetism. This weakening can be explained by the competition between DE interaction Mn
3+
–O–Mn
4+
and superexchange antiferromagnetic interactions, typically Mn
3+
–O–Mn
3+
and Mn
4+
–O–Mn
4+
. The substitution of Mn by Fe giving rise to an antiferromagnetic coupling between Mn and Fe ions that favours the superexchange mechanism [
23
].
Fig. 7
Magnetization measurements as a function of temperature for Pr
0.6
Bi
0.4
Fe
x
Mn
1−
x
O
3
. The
inset
Temperature dependent inverse magnetic susceptibility,
χ−1
plot for Pr
0.6
Bi
0.4
Fe
x
Mn
1−
x
O
3
(
ax
= 0.1,
bx
= 0.2 and
cx
= 0.3) compounds
The PM–FM transition is also highlighted using a linear extrapolation to the zero magnetization of the
χ−1
(T) curves (Fig.
7
). The Curie temperature of the Pr
0.6
Bi
0.4
Fe
x
Mn
1−
x
O
3
powders is similar to those obtained by Troyanchuk et al. and by Chen et al. [
24
,
25
]. The magnetic properties of PrMn
2
O
5
sample reveal that the oxide has antiferromagnetic transition at low temperature giving a Neel temperature (
TN
) at 100 K.
In the PM region (
T
≥
Tc
), the magnetization curve is well fitted by Curie–Weiss law (see Fig.
7
the inset). The temperature dependence of inverse magnetic susceptibility data in the 5–300 K temperature range follow a Curie–Weiss behavior above
T
c. The relation between
χ
and temperature
T
should follow the Curie–Weiss law in the PM region:
χ=CT-θp,
where
C
and
θp
are the Curie constant and the Weiss temperature, respectively.
C
and
θp
were obtained by fitting the linear PM region of
χ
(
T
) curve (Table
1
). The positive
θp
value indicates an FM interaction between the spins. The positive magnetic interaction in these compounds is due to the presence of Mn
3+
and Fe
3+
ions, which favor FM interaction. The obtained value is slightly higher than
TC
. From these results, we can deduce that this difference depends on the substance and is related to the presence of short-range ordered slightly above the Curie temperature, which is related to the presence of magnetic inhomogeneity [
26
].
Table 1
Physical parameters of Pr
0.6
Bi
0.4
Fe
x
Mn
1−
x
O
3
(0.1 ≤
x
≤ 0.3) compounds
θp (K)
TC (K)
C (emu K/g T)
0.1
69.36
40
0.01441
0.2
72.14
77
0.01386
0.3
150
52
0.13156
In order to gain a deeper understanding of the magnetic properties and to confirm the ferromagnetic behavior at low temperatures, the isothermal magnetic hysteresis loops,
M
(
H
), have been recorded. As seen in Fig.
8
, the curve reveals a ferromagnetic property with a clear magnetic hysteresis at 2 K. From this figure, we see that magnetization decreases with the increasing Fe content. In fact, magnetization does not reach the saturation for
x
= 0.2 and
x
= 0.3. This confirms the presence of the AFM interactions, which are more important for higher Fe contents (
x
= 0.2 and
x
= 0.3) [
27
,
28
].
Fig. 8
Variation of magnetization as a function of applied magnetic field measured at 2 and 300 K for Pr
0.6
Bi
0.4
Fe
x
Mn
1−
x
O
3
compounds
Magnetocaloric study
The MCE is an intrinsic property of magnetic materials. It is the response of the material to the application or removal of magnetic field, which is maximized when the material is near its magnetic ordering temperature (Curie temperature
TC
). The evolution of magnetization (
M
) versus magnetic field (
H
) for the
x
= 0.1 and 0.3 composition, obtained at different temperatures (
T
), is shown in Fig.
9
. These curves reveal a strong variation of magnetization around the Curie temperature indicating a possible large magnetic entropy change associated with the ferromagnetic–PM transition temperature.
Fig. 9
Isothermal magnetization M (H) for Pr
0.6
Bi
0.4
Mn
0.9
Fe
0.1
O
3
and Pr
0.6
Bi
0.4
Mn
0.7
Fe
0.3
O
3
.samples at several temperatures. The
inset
depicts
ArrotcurvesM2
versus μ
0
H/M
In order to check the nature of the magnetic transitions for the nanopowder, we have used the criterion given by Banerjee [
29
]. This criterion consists in inspecting the slope of isotherm plots of
M2
versus
H
/
M
. From a thermodynamic point of view, it can be concluded that if all the curves have a positive slope, the magnetic transition is of the second-order type. On the other hand, if some of the curves show a negative slope at some point, the transition is of the first-order type. A more standard type of Arrott plots is observed. The plots exhibit a linear behavior, and the positive and negative slopes are clearly noted in the complete
M2
range. So, following Banerjee’s criterion, we can conclude that the ferromagnetic-to-PM (FM–PM) phase transition in the samples is obviously of the second-order type for
x
= 0.1 and first-order type for
x
= 0.3 as shown in Fig.
9
(the inset).
The MCE of the materials can be derived from the Maxwell’s thermodynamic relationship:
∂H∂TH=∂S∂HT,
where
S
,
M
, and
H
are the magnetic entropy, the magnetization, and the applied magnetic field, respectively. The magnetic entropy change can be derived from Eq. (
3
) by integrating over the magnetic intensity
H
:
ΔSMH,T=∫0H∂M∂TdH.
The values of the magnetic entropy changes (Δ
SM
) upon application of magnetic fields from the isothermal
M
–
H
curve can be numerically calculated using Eq. (
4
):
ΔSMT1+T22=1T1+T2∫0HmaxMT2,HdH-∫0HmaxMT1,HdH
Figure
10
shows the temperature dependence of −Δ
SM
(
T
, (Δ
µ0H
) for
x
= 0.1 and
x
= 0.2 for different applied magnetic fields. We can note that the magnetic entropy change depends on the magnetic applied field.
Fig. 10
Magnetic entropy change versus temperature for Pr
0.6
Bi
0.4
Mn
0.9
Fe
0.1
O
3
and Pr
0.6
Bi
0.4
Mn
0.7
Fe
0.3
O
3
samples at several applied magnetic field changes
As expected, the overall value of entropy change is found to increase with the increasing field. Another notable feature is that increasing field shifts the magnetic transition temperature to higher temperatures. The maximum values of magnetic entropy change, Δ
SM
are 0.47 and 0.37 J/kg/K for
x
= 0.1 and
x
= 0.2, respectively. But this field is not enough to saturate the sample. Compared with Gd 2.8 J/kg/K at 1 T field [
30
], Δ
Smax
value is smaller for the present materials. However, these materials can be easily synthesized with good chemical stability. Another interesting feature in the MCE plot is that it is asymmetric, especially under high field. Similar behavior is observed in Si-substituted Lanthanum calcium manganite [
31
]. It is difficult to determine their RCP because of the non-uniform distribution of the Δ
SM
curves. The non-uniform distribution of Δ
SM
in nanocrystalline manganites is due to the enhanced grain boundary effects and the spread of the ferromagnetic transition temperature in different magnetic clusters caused by the inhomogeneity of the structure and stoichiometry [
31
].
Conclusion
Morphologic, structural, magnetic, and magnetocaloric properties of Pr
0.6
Bi
0.4
Fe
x
Mn
1−
x
O
3
compounds have been investigated. X-ray diffraction showed that all samples crystallize in the orthorhombic system with
Pnma
space group. The FTIR spectra revealed the presence of the stretching and bending modes regardless of the samples. A PM–ferromagnetic transition of the second- and first-order type is observed for our materials. The magnetization versus magnetic field shows a small coercive field and an unsaturated magnetization which indicates that all samples are soft magnetic in nature at room temperature. From the magnetocaloric result, we demonstrate that the Pr
0.6
Bi
0.4
Fe
0.1
Mn
0.9
O
3
and Pr
0.6
Bi
0.4
Fe
0.3
Mn
0.7
O
3
samples present a magnetic entropy change (−Δ
SM
) being 0.47and 0.37 J/kg/K under an applied magnetic field change of 5 T. We can deduce that the presence of supplementary phases has no effect on the properties of manganites.
Acknowledgments
This study has been supported by the Tunisian Ministry of Scientific Research and Technology. This research was also supported by the Centre National de la Recherche Scientifique, CNRS. Laure Vendier is acknowledged for PXRD measurements. The authors are grateful to the “Service Commun de Microscopie Electronique de L’Université Paul Sabatier” (TEMSCAN).
Pecharsky and Gschneidner (1997) Giant magnetocaloric effect in Gd5(Si2Ge2) (pp. 4494-4497) 10.1103/PhysRevLett.78.4494
Khlifi et al. (2011) Structural, magnetic and magnetocaloric properties of the lanthanum deficient in La0.8Ca0.2−xMnO3 (x = 0–0.20) manganites oxides (pp. 7410-7415) 10.1016/j.jallcom.2011.04.049
Oumezzine et al. (2015) Structural, magnetic and magnetocaloric properties of Zn0.6−xNixCu0.4Fe2O4 ferrite nanoparticles prepared by Pechini sol-gel method (pp. 189-195) 10.1016/j.powtec.2015.03.022
Sbissi et al. (2015) The magnetic and magnetocaloric properties of Pr1−x Bi x MnO3 (x = 0.2 and 0.4) manganites (pp. 1433-1438) 10.1007/s10948-015-2985-x
Othmani et al. (2009) New complex magnetic materials for an application in Ericsson refrigerator (pp. 969-972) 10.1016/j.ssc.2009.04.020
Mori et al. (1998) Paired and unpaired charge stripes in the ferromagnetic phase of La0.5Ca0.5MnO3 (pp. 33972-33975) 10.1103/PhysRevLett.81.3972
Cui et al. (2005) Sol-gel synthesis of nanoscaled spinels using propylene oxide as a gelation agent (pp. 175-181) 10.1007/s10971-005-4165-0
Gash et al. (2009) Use of epoxides in the sol-gel synthesis of porous iron (III) oxide monoliths from Fe(III) salts (pp. 999-1007)
Brinker and Scherer (1990) Academic Press
Gaudon et al. (2002) Preparation and characterization of La1−xSrxMnO3+δ (0 ≤ x≤0.6) powder by sol gel processing (pp. 125-133) 10.1016/S1293-2558(01)01208-0
Keshri et al. (2009) Influence of BTO phase on structural, magnetic and electrical properties of LCMO (pp. 501-506) 10.1016/j.jallcom.2009.06.006
Kolat et al. (2007) Effect of B-doping on the structural, magneto transport and magneto caloric properties of La0.67Ca0.33MnO3 compounds (pp. 212-217) 10.1016/j.mseb.2007.05.002
Roy and Bandyopadhyay (1996) Sol-gel synthesis of colloidal silica using cyclohexane (pp. 1872-1874)
Nakamoto (1978) Wiley
Feng et al. (1998) Hydrothermal soft chemical process for synthesis of manganese oxides with tunnel structures (pp. 153-161) 10.1023/A:1009657724306
Zouari et al. (2014) Structural, morphologic and magnetic properties of Pr0.6La0.1Ca0.3Mn1−xFexO3 (0 ≤ x≤0.3) perovskite nanopowder (pp. 16-23) 10.1016/j.ssc.2013.10.017
Nasri et al. (2013) Structural and magnetic properties of Pr0.6Sr0.4Mn1−xFexO3 (0 ≤ x ≤ 0.3) manganites oxide prepared by the ball milling method (pp. 10948-22282)
Borchert et al. (2008) Nanostructured praseodymium oxide: preparation, structure, and catalytic properties (pp. 3054-3063)
Alonso et al. (1997) High oxygen pressure preparation, structural refinement and thermal behaviour of RMn2O5 (R = La, Pr, Nd, Sm, Eu) (pp. 105-112) 10.1006/jssc.1996.7237
Popova et al. (2000) Synthesis of LnMn2O5 (Ln = Nd, Pr) crystals using fused salt electrolysis (pp. 1661-1667) 10.1016/S0025-5408(00)00372-X
Vasylechko (2002) ICDD Grant-in-Aid
Warren (1990) Dover Pub. Inc.
Nadeem et al. (2005) Effects of low frequency near metal-insulator transition temperatures on polycrystalline La0. 65Ca0. 35Mn1KyFeyO3 (where yz 0.05–0.10) ceramic oxides (pp. 431-436) 10.1016/j.ssc.2005.01.020
Troyanchuk et al. (2002) Magnetic phase transitions in the system La1−xBixMnO3+λ (pp. 569-574) 10.1063/1.1496669
Tozri et al. (2010) Effects of vacancy and Na doping on the structural, magnetic and transport properties of La0.8Pb0.1(/Na)0.1MnO3 (pp. 2516-2524) 10.1016/j.jmmm.2010.03.011
Cherif et al. (2014) Magnetic and magnetocaloric properties of La0.6Pr0.1Sr0.3Mn1−x FexO3 (0 ≤ x ≤ 0.3) manganites (pp. 271-276) 10.1016/j.jssc.2014.04.004
Issaoui et al. (2012) Structural and magnetic studies of Ca2−x Smx MnO3 Compounds (x = 0–0.4) (pp. 1169-1175) 10.1007/s10948-011-1386-z
Banerjee (1964) On a generalised approach to first and second order magnetic transitions (pp. 16-17) 10.1016/0031-9163(64)91158-8
Ritter et al. (1997) Influence of oxygen content on the structural, magnetotransport, and magnetic properties of LaMnO3+δ (pp. 8902-8911) 10.1103/PhysRevB.56.8902
Li et al. (2007) Effect of Mn-site Si substitution on magnetic, transport properties and colossal magnetoresistance in La2/3Ca1/3Mn1−xSixO3 (x = 0.05–0.25) system (pp. 10-14) 10.1016/j.ssc.2007.07.033