One-pot hydrothermal synthesis and characterization of magnetic nanocomposite of titania-deposited copper ferrite/ferrite oxide for photocatalytic decomposition of methylene blue dye
Nano-physics, Fouman Faculty of Engineering, College of Engineering, University of Tehran, Fouman, Guilan, 43581-39115, IR
Analytical Chemistry, Fouman Faculty of Engineering, College of Engineering, University of Tehran, Fouman, Guilan, IR
Mathematics, Fouman Faculty of Engineering, College of Engineering, University of Tehran, Fouman, Guilan, IR
Chemical Engineering, Fouman Faculty of Engineering, College of Engineering, University of Tehran, Fouman, Guilan, IR
Abstract
The pure titania (TiO
2
) and the heterogeneous ternary magnetic nanocomposite of copper ferrite/ferrite oxide (CuFe
2
O
4
/Fe
2
O
3
) deposited by titanium dioxide (TiO
2
) were fabricated using a facile one-pot hydrothermal synthesis for the photocatalytic decomposition of methylene blue (MB) dye, under visible light. The nanocomposite was encoded as TCF in this work, where T stands for TiO
2
, C for CuFe
2
O
4
and F for Fe
2
O
3
. Various techniques such as powder X-ray diffraction (PXRD), field emission scanning electron microscopy (FESEM), energy-dispersive X-ray spectroscopy, diffuse reflectance spectroscopy, nitrogen physisorption, and vibrational sample magnetometry (VSM) were used to characterize the prepared samples. The PXRD data showed that the samples had pure anatase structure and the average crystal size of anatase TiO
2
in the pure titania and ternary nanocomposite were calculated 147 Å and 135 Å, respectively. The nitrogen physisorption analysis data showed that the pore diameter was increased from 10.6 nm in pure titania to 16.0 nm in TCF. The pore volume was also increased from 0.316 in titania to 0.383 cm
3
/g in TCF sample. It also increased the typical magnitude of the mesopores’ diameter and volume per weight but it reduced the specific surface area of the samples. The VSM analysis of the ternary nanocomposite showed a considerable magnetic property of the sample (1.99 emu/g), qualifying it as a paramagnetic material. The photocatalytic decomposition efficiency of MB reached 77% and 68% in the presence of pure titania and TCF ternary nanocomposite, after 240-min exposure by the visible light. Active species trapping experiments showed that the major active species responsible for the photodecomposition of MB in the presence of TCF are
O2·-
radicals and holes (h
+
).
Introduction
Increasing human population and industrial development have led to the release of various kinds of pollutants into the environment. Clean water is one of the vital elements of life, so the elimination of pollutants including organic contaminations such as pharmaceutical by-products, agrochemicals, dyes, paper, rubber, plastic, etc. from ground and wastewater has become one of the most important challenges for all countries [
1
].
In general, effluent water comprises about 10–200 mg/L of dyes and other chemicals utilized in dyeing procedures. Dyes are toxic and they resist natural deterioration. Furthermore, they scatter the sunlight passing through the water and consequently prevent the photosynthesis process in aquatic plants [
2
,
3
].
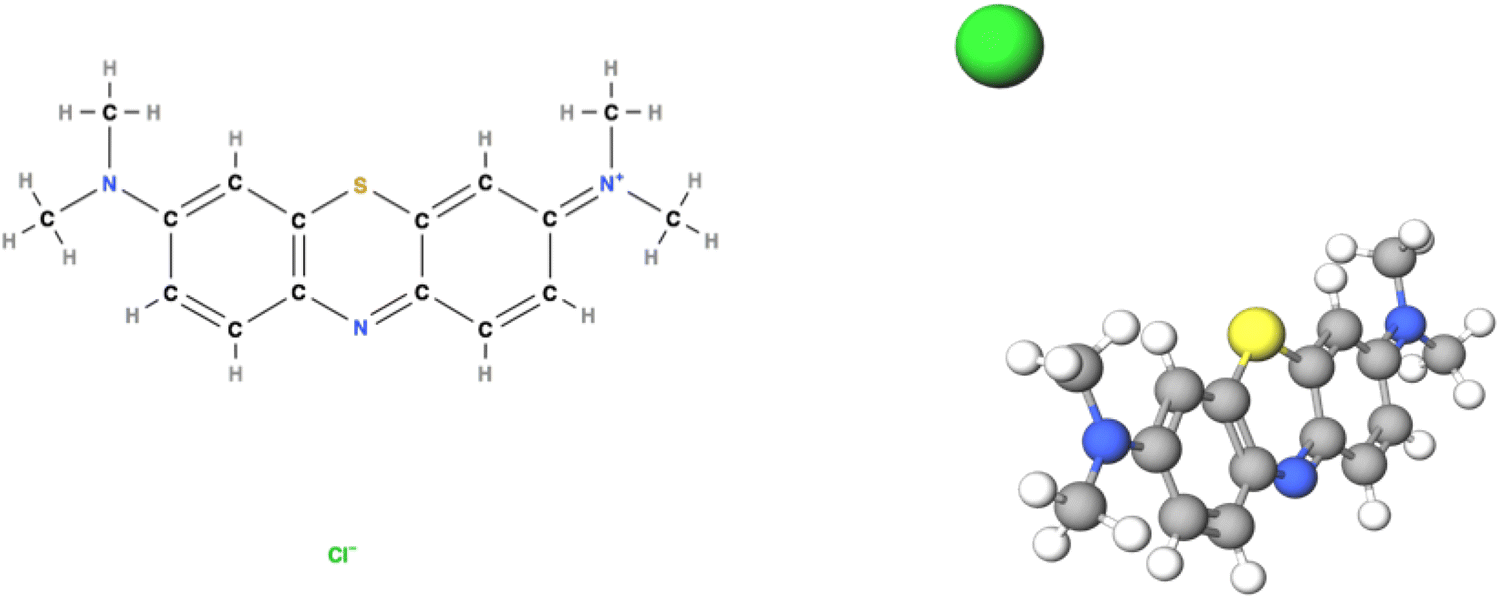
Methylene blue dye (MB) is a well-known organic dye polluting wastewater. MB is the photocatalytic reactant prototype in this research. It has an aromatic heterocyclic chemical structure with the C
16
H
18
ClN
3
S formula shown in Fig.
1
[
4
], and it is one of the cationic water-soluble dyes. It is a dark green and odorless powder that creates a blue solution when mixed with water. Because of various advantages such as low price, high color intensity and brightness, it is one of the common pigments used in the textile and dyeing industries [
5
]. On the other hand, the usual side effects caused by exposure to the MB-tainted wastewater are dizziness, headache, increased sweating, nausea, confusion, vomiting, shortness of breath, and high blood pressure. The other effects include mild bladder irritation, abdominal pain, diarrhea, upset stomach, frequent urination, stomach cramps, and hemolysis [
6
]. As a result, the removal of this chemical from effluent seems imperative.
Fig. 1
Methylene blue chemical structure. On the left side 2D, and on the right side 3D images are shown. The pictures were drawn using the online tool at reference [
4
]
Several approaches, such as biological treatment, membrane-based filtration, ion exchange, adsorption, precipitation, reverse osmosis, electrostatic captivation, and advanced oxidation processes (AOPs) such as photocatalytic decomposition, have been practiced [
7
,
8
]. AOPs can decrease contamination content of water by several orders of magnitude, from hundreds of ppm (particles per million) to a few ppb (particles per billion); therefore, they reduce chemical oxygen demand (COD) and total oxygen demand (TOD) in aqueous environments. The COD is a parameter that indicates the amount of oxygen needed to chemically oxidize all constituent organic materials in the water sample. On the other hand, the biological or biochemical oxygen demand (BOD) shows the amount of oxygen needed to decompose organic compounds by wastewater bacteria. As a result, the parameter TOD that is the sum of COD and BOD, is considered as a standard reference parameter for the evaluation of wastewater organic pollution [
9
]. Among numerous techniques, photocatalytic decomposition is broadly used for water treatment because the procedure is a simple and low cost method of efficiently eliminating organic chemical compounds in aqueous phase, and it produces water and small inorganic by-products that are not environmentally hazardous [
2
,
3
,
7
,
9
,
10
–
11
].
In addition, AOPs are based on in situ production of very reactive species such as hydroxyl radicals (OH
·
) that can unselectively oxidize every compound mixed with water, and consequently, various chemical pollutants can be removed simultaneously. The hydroxyl radicals can be produced in the presence of energy sources (e.g., UV radiation), oxidizing agents (e.g., hydrogen peroxide, ozone, and oxygen), and catalysts (e.g., titanium dioxide) [
9
,
12
,
13
,
14
,
15
–
16
].
Due to its environmental stability and safety, titanium dioxide (TiO
2
) has appeared as a promising heterogeneous photocatalyst under UV beam, as it has a large bandgap energy of around 3.0–3.3 eV. Ultraviolet irradiation can excite and transfer electrons from the valence band to the conduction band and consequently increase of TiO
2
photocatalytic activity. However, only 5% of the solar spectrum lies within the UV range, and a significant part of it is in the visible and infrared frequency domain. Furthermore, via the catalytic photoexcitation, TiO
2
shows a high electron–hole pair (e
−
/h
+
) recombination rate that leads to a low photocatalytic efficiency. To overcome these issues, different methods have been applied to TiO
2
such as metal or nonmetal doping, surface sensitizing, and combination with low bandgap semiconductors [
17
,
18
,
19
–
20
].
Recently, magnetic nanoparticles have been widely used for water treatment [
21
,
22
,
23
,
24
–
25
]. Due to their very small size and large surface-to-volume ratio, they have a high elimination capacity, fast kinetics and significant reactivity towards pollutants removal. More importantly, improvement of the magnetic properties of the catalyst is a useful characteristic, aiding in its separation from water after the contamination decomposition. It is expected that magnetic separation would be cheaper and more appropriate compared to membrane filtration [
7
,
26
,
27
].
Nanoparticles of spinel ferrite have the general formula of [A
+2
][Fe
+3
]
2
O
4
, where A is a divalent cationic metal like nickel (Ni), Mn, or copper (Cu). Structural, electrical, magnetic, and catalytic properties of spinel ferrite depend on the constituent atoms and their distribution in the A metal and iron sites. Reducing the size of magnetic nanoparticles enhances the number of surface atoms that gives rise to the improvement of catalyst magnetic property. Spinel copper ferrite (CuFe
2
O
4
) is one of the heterogeneous groups of magnetic nanophotocatalysts that have hydroxyl groups, chemical and thermal stability, non-carcinogenicity, low bandgap energy, and magnetic properties that cause easy separation from water [
28
].
Metal oxides such as Fe
2
O
3
can electronically modify the photocatalysts and have a dramatic effect on the reactivity of the system. The electron–hole separation and the electron transfer at the interface can be significantly affected by metal oxide modification [
29
,
30
]. The application of super-paramagnetic Fe
2
O
3
nanoparticles as photocatalysts for organic dye decomposition in wastewater looks very encouraging, due to their large surface area leading to large loading capacity, significant stability, cost-effective provision, and eco-friendly properties [
31
]. In addition, a highlighted benefit of using iron oxide is their magnetic properties that make their separation from water much easier compared to other methods, because they are attracted towards the externally applied magnetic field [
32
].
There have been few reports on the synthesis of TiO
2
/CuFe
2
O
4
used for photocatalytic applications [
33
,
34
,
35
–
36
]. In this work, the magnetic recyclable catalyst, TiO
2
/CuFe
2
O
4
/Fe
2
O
3
(TCF), was prepared using the one-pot hydrothermal method. The prepared samples, pure titania and TCF, were characterized by different analyses such as powder X-ray diffraction (PXRD), field emission scanning electron microscopy (FESEM), energy-dispersive X-ray spectroscopy (EDX), diffuse reflectance spectroscopy (DRS), nitrogen physisorption, and vibrational sample magnetometry (VSM). The samples were then used for photocatalytic decomposition of MB.
Experimental details
Chemicals
Chemical materials used for the experiments were of analytical grade and mostly acquired from Merck Company (Germany). They included: titanium tetra isopropoxide (Ti(OCH(CH
3
)
2
)
4
or TIP; Merck No. 821895) and MB (C
16
H
18
ClN
3
S or MB; Merck, No. 115943). Other materials that were consumed for photocatalytic synthesis consisted of ethanol (C
2
H
5
OH, Merck No. 818760), acetylacetone (C
5
H
8
O
2
), copper chloride (CuCl
2
.2H
2
O) and ferric chloride (FeCl
3
.6H
2
O), sodium hydroxide (NaOH), and deionized water. Triethanolamine (or trolamine, C
6
H
15
NO
3
, Merck No. 108372), isopropyl alcohol (C
3
H
8
O, Merck No. 100995) and ascorbic acid (C
6
H
8
O
6
) were used as active species scavengers. All the reagents were applied as purchased without additional purification.
Photocatalyst synthesis
A pure TiO
2
sample was synthesized through a hydrothermal method used by Ebrahimian et al. [
37
]. The magnetic nanoparticles of CuFe
2
O
4
were prepared according to the method reported by Hashemian et al. [
38
], and then they were calcinated at 700 °C for 5 h in air atmosphere. To prepare TCF, a 250-mL glass beaker was filled with 20 mL of TIP, 20 mL of ethanol, 1.6 mL of acetone and blended for 30 min in an ambient condition. Afterwards, another solution consisting of 0.5 g of the prepared CuFe
2
O
4
, 80 mL of ethanol, and 2 mL of deionized H
2
O was poured into the first solution, yielding a grayish white solution. The resultant solution was poured into an autoclave, heated up to 220 °C (3 °C/min), and kept at this temperature for 6 h. Then, it was cooled down to room temperature gradually, washed by ethanol and water and then dried at 80 °C for another 6 h in air atmosphere. The final brown TCF nanocomposite was ground by a mortar to be used for the photodecomposition process.
Characterization
The diffraction patterns were recorded using a Siemens D5000 (Germany), with Cu-K
α
(
λ
= 1.54Å) as the X-ray radiation source, in a 2
θ
range of 20°–70°. The chemical, structural and topographical characteristics of the samples were characterized by FESEM TESCAN MIRA3, complemented by an EDX analyzer. To compute the bandgap energy of the materials, the diffused reflectance spectroscopy (DRS) was carried out by a UV–Vis Scinco 4100 spectrometer in the range of 330–950 nm.
The nitrogen physisorption was measured using a BELSORP-mini II. After outgassing the instrument at 250 °C, the pressure was decreased to less than 5 m bars. Subsequently, the Brunauer–Emmett–Teller (BET) areas were determined by measuring static nitrogen physisorption at the temperature of − 196 °C. Furthermore, the magnetic properties of CuFe
2
O
4
and TCF were measured using a vibrating sample magnetometer (VSM) system (Meghnatis Daghighe Kavir Kashan LBKF, Iran) in the maximum magnetic field intensity of 1 T.
Photocatalytic decomposition of MB
The decomposition of MB was followed by measuring the solution absorbance (
A
) at the maximum absorption wavelength of MB dye (
λmax
= 665 nm) at 30-min intervals. UV–Vis spectra were recorded on a double beam UV–visible spectrophotometer (Rayleigh UV-2601). Before exposure to irradiation, a suspension containing different amounts of the photocatalyst (0.05–0.3 g) and 100 mL of MB aqueous solution (10 ppm) was stirred continuously for 60 min in the dark to reach the adsorption/desorption equilibrium. Then the sample, under magnetic stirring, was illuminated by four UVA lamps (Kr lamp, 500 W, Osram, Germany,
λmax
= 360 nm) or a tungsten lamp (500 W, Halogen, ECO Osram), positioned at 100 cm above the glass beaker. To measure the decline of the MB concentration, a sample of 2 mL was taken with a pipette at prespecified time intervals and centrifuged at 4000 rpm. The percentage of MB decomposition was obtained via Eq. (
1
):
%Decompositionefficiency=(C0-Ct)C0×100,
where
C0
and
Ct
(mg/L) are the initial concentration and the concentration of MB at time
t
, respectively.
Results and discussion
PXRD analysis
The PXRD patterns of the samples were recorded in the 2
θ
= 20° to 70° range with 0.02° scan intervals, and the results are shown in Fig.
2
.
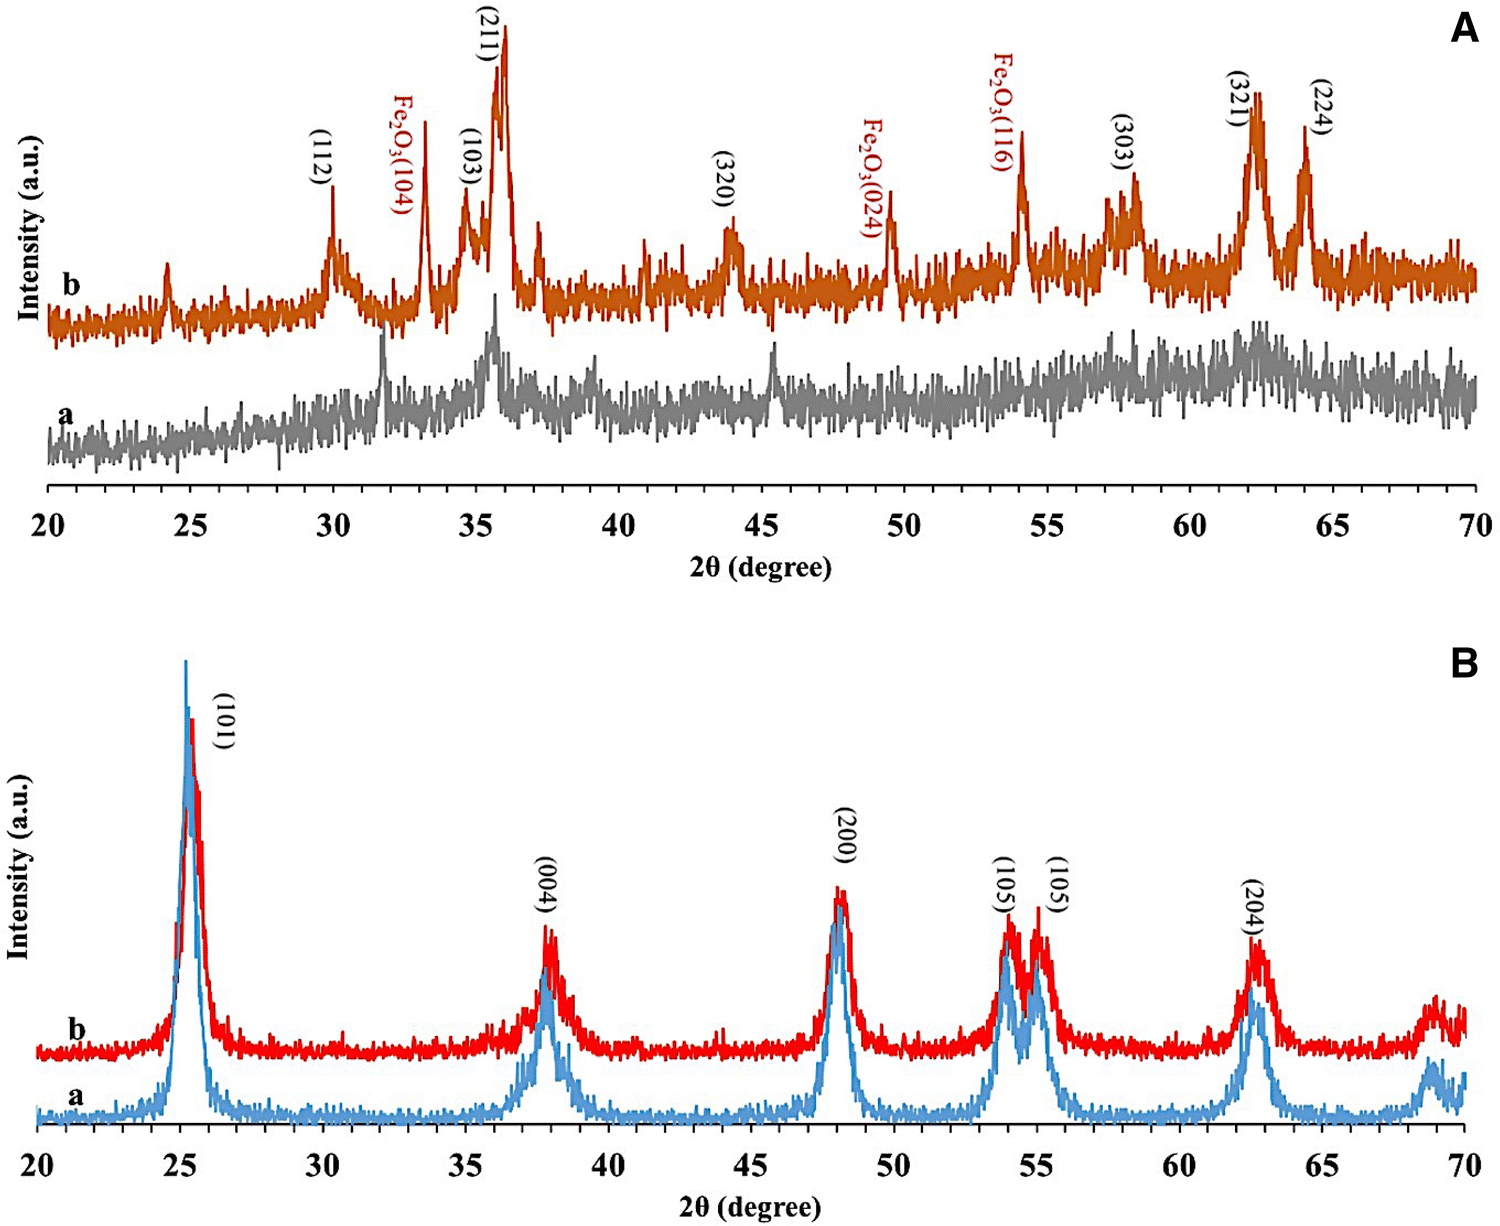
Fig. 2
A
The PXRD patterns of CuFe
2
O
4
(a) before and (b) after calcination, and
B
The PXRD patterns of (a) TiO
2
and (b) TCF samples
Figure
2
A exhibits the PXRD patterns of CuFe
2
O
4
before (a) and after (b) calcination. The pre-calcination pattern indicates that the sample has an amorphous structure, while after calcination the pattern of the sample shows diffraction at 2
θ
= 30.00°, 34.66°, 36.02°, 44.57°, 58.16°, 62.42°, and 64.02° attributed to (112), (103), (211), (320), (303), (321), and (224) crystalline planes. This result is consistent with previous reports [
39
] and indicates that tetragonal copper spinel crystals have been formed. In addition to characteristic diffractions of CuFe
2
O
4
, the diffractions that emerged at 2
θ
= 33.5°, 49.50° and 54.5° reveal that in addition to CuFe
2
O
4
, ferrite oxide (Fe
2
O
3
) nanoparticles have probably been formed during the calcination of the sample at 700 °C, and these diffraction angles correspond to the (104), (024), and (116) planar Miller indices [
40
,
41
–
42
].
In Fig.
2
B (a), the PXRD pattern of the pure TiO
2
sample reveals the diffractions at 2
θ
= 25.46°, 38.00°, 48.16°, 54.12°, 55.26°, and 62.92° corresponding to the crystalline planes with Miller indices of (101), (004), (200), (105), (211), and (204), verifying the anatase crystalline structure of TiO
2
nanoparticles (JCPDS-21-1272) [
43
].
Figure
2
B (b) shows the PXRD pattern of the TCF sample with no indication of CuFe
2
O
4
or Fe
2
O
3
patterns. This can be due to the weight of CuFe
2
O
4
and Fe
2
O
3
nanoparticles being a very small fraction of the weight of TiO
2
nanoparticles, and as a result, not having a substantial effect in the diffraction pattern of TiO
2
. Other possible reasons are the excellent crystallinity of TiO
2
and its probable formation around CuFe
2
O
4
and Fe
2
O
3
nanoparticles leading to the absence of ferrite compound features in PXRD patterns.
Furthermore, both patterns showed sharp peaks indicating high crystallinity of the samples, and the width of the peaks contains information about the sizes of the crystals as well.
According to the Scherrer equation, the TiO
2
crystal size of each sample is related to the full width at half maximum of the diffraction:
Dhkl=Kλβcos(θ),
where
Dhkl
is the average size of the particle and
h,kandl
are plane Miller indices, here equal to 1, 0, and 1.
K
is a dimensionless, constant shape factor (~ 0.89),
λ
is the irradiated X-ray wavelength (0.1542 nm),
2θ
is the angle between the scattered and the incident X-ray plane wave vectors, corresponding to the maximum intensity of the diffraction, and finally,
β
is the diffraction’s full width (in radian) at its half maximum [
44
].
The results of the calculation in Table
1
show that the TiO
2
crystals in both samples have nanoscale dimensions, and the crystal size of TiO
2
in TCF sample is less than the crystal size in pure titania. The presence of CuFe
2
O
4
and Fe
2
O
3
nanoparticles may act as nucleation centers for the formation of TiO
2
crystals, thus preventing the growth of TiO
2
crystals during the hydrothermal synthesis.
Table 1
Structural phase, crystal dimension, lattice parameters and band gap energies of the synthesized samples (calculated from DRS data using Kubelka–Munk function)
Sample
Phase
a = b (Å)
c (Å)
V (Å3)
D (Å)
Band gap (eV)
TiO2
Anatase
3.8
9.8
140.3
147
2.99
TCF
Anatase
3.8
9.3
133.6
135
3.02
Interplanar distance,
dhkl
, can be determined using Bragg’s equation [
45
]:
2dhklsin(θ)=nλ,
where
n
is a positive integer illustrating the reflection order and is assumed to be 1 The anatase phase of TiO
2
has a tetragonal structure (lattice parameters:
a
=
b ≠ c
;
a
,
b
and
c
are the length, width, and height of the rectangular cuboid, respectively.), so
dhkl
is related to the lattice parameters by the following equation [
46
]:
1d2=h2+k2a2+l2c2.
This equation was used to compute the lattice parameters and the cell volume (
V
=
a2c
) shown in Table
2
. To calculate
a
and
c
parameters, the third and first peaks at
2θ
= 30.0° and 25.2° corresponding to Miller indices of (200) and (101), respectively, were used. By comparison of the results of Table
1
with reported data [
47
,
48
–
49
], the anatase structure of titania is verified.
Table 2
Chemical composition of the samples from EDX analysis
Sample
Ti (wt%)
O (wt%)
Cu (wt%)
Fe (wt%)
TiO2
57.52
42.48
–
–
TCF
51.00
43.37
2.62
3.01
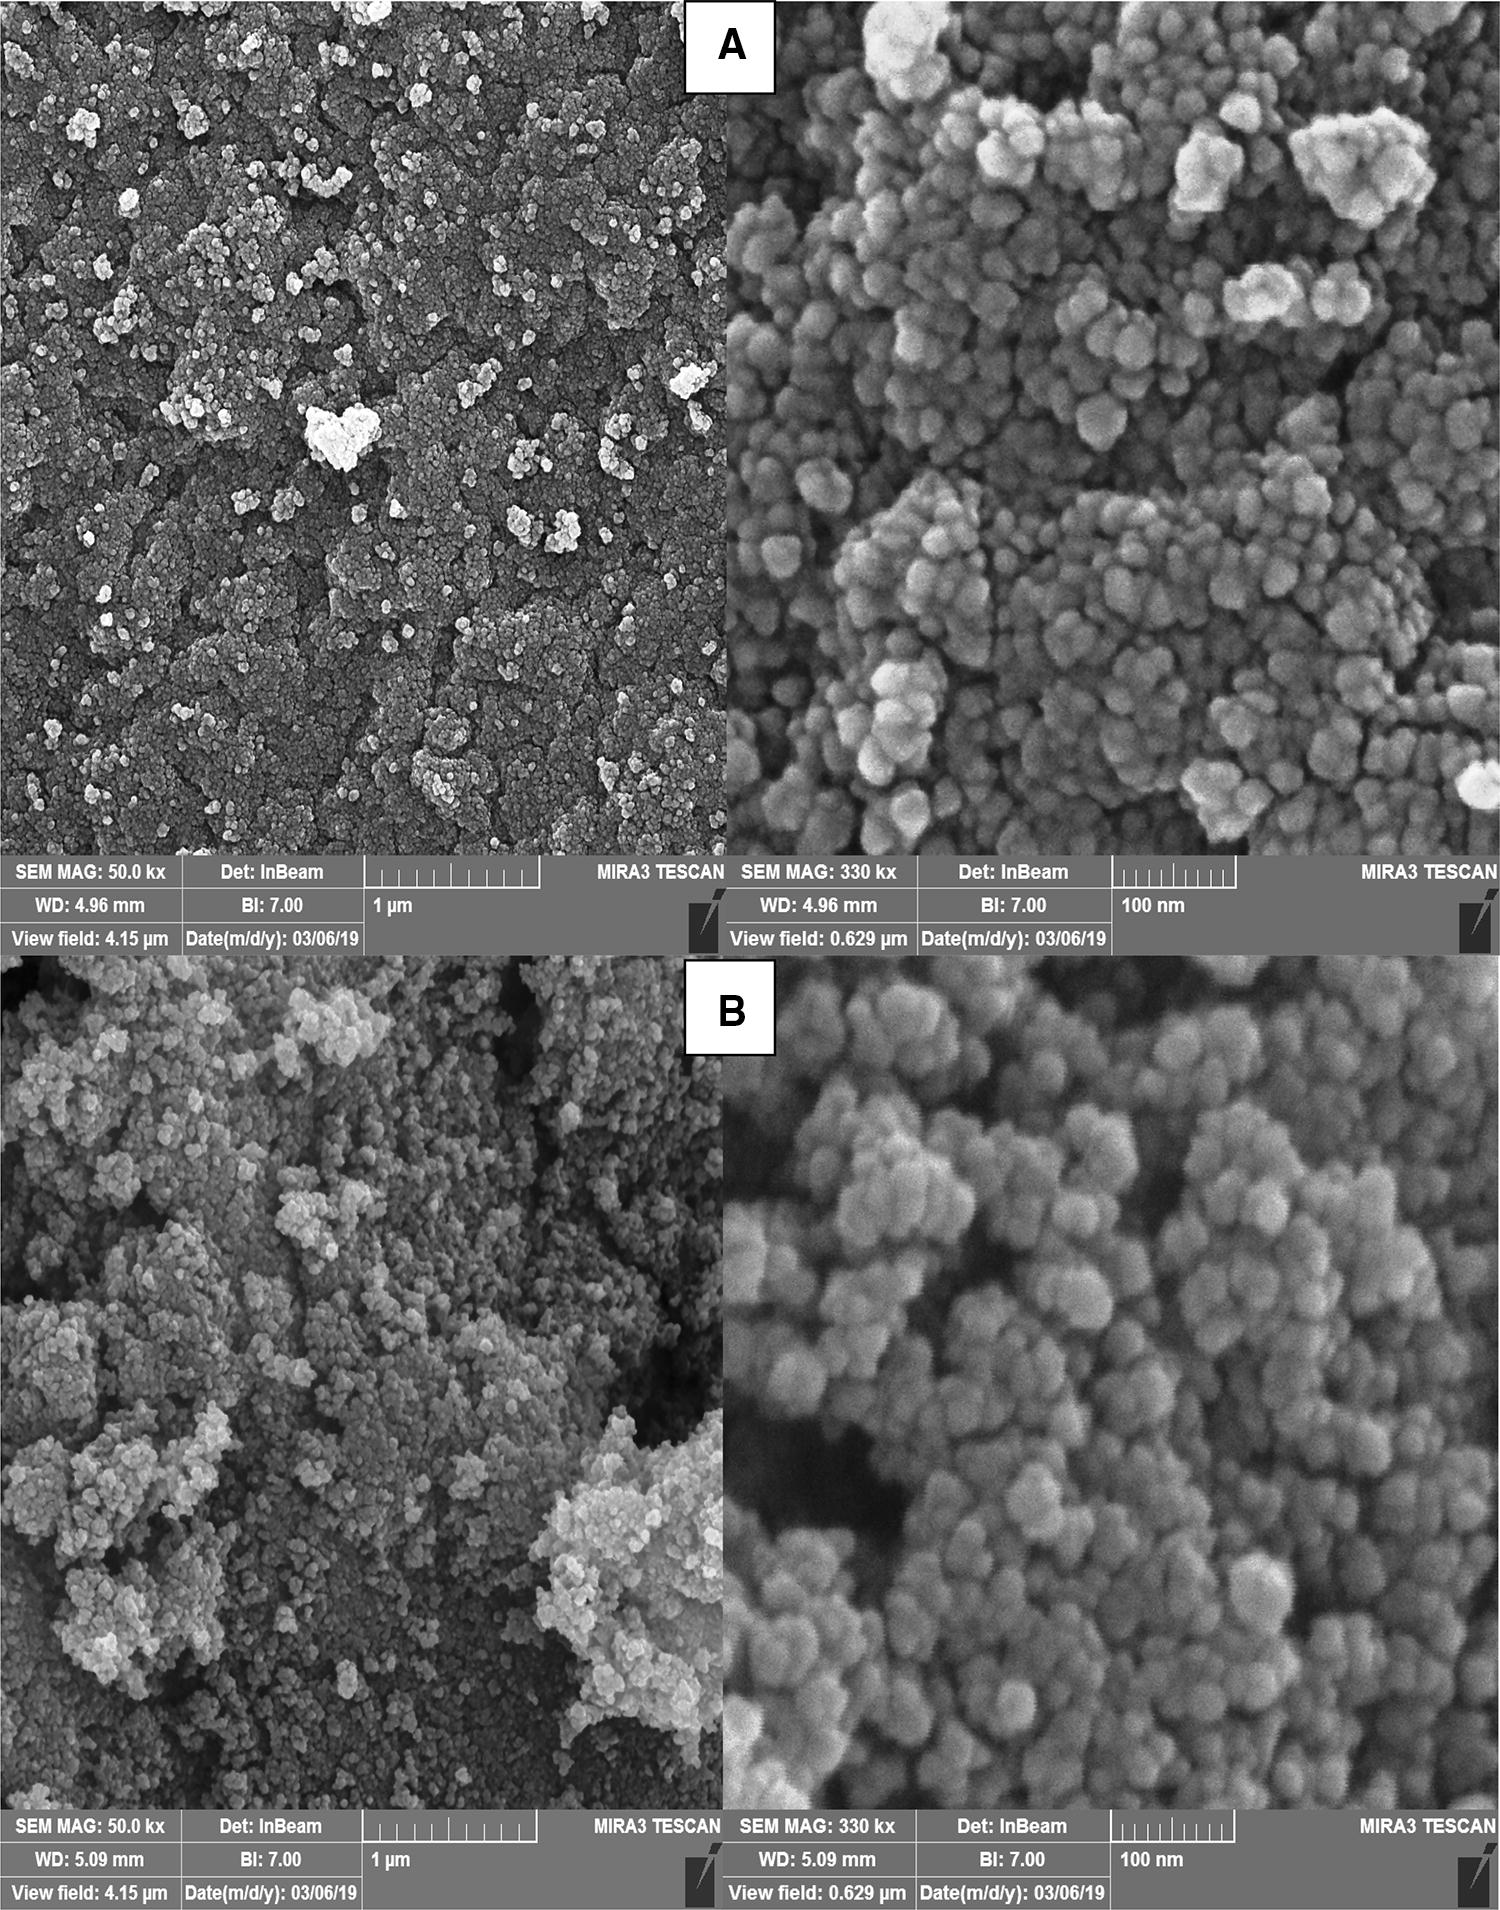
FESEM/EDX analyses
FESEM images of the samples are shown in Fig.
3
with 100 nm and 1 μm scales. The TCF sample shows minor accumulation compared to pure titania.
Fig. 3
FESEM images of the samples with 1-µm and 100-nm scales:
a
TiO
2
and
b
TCF
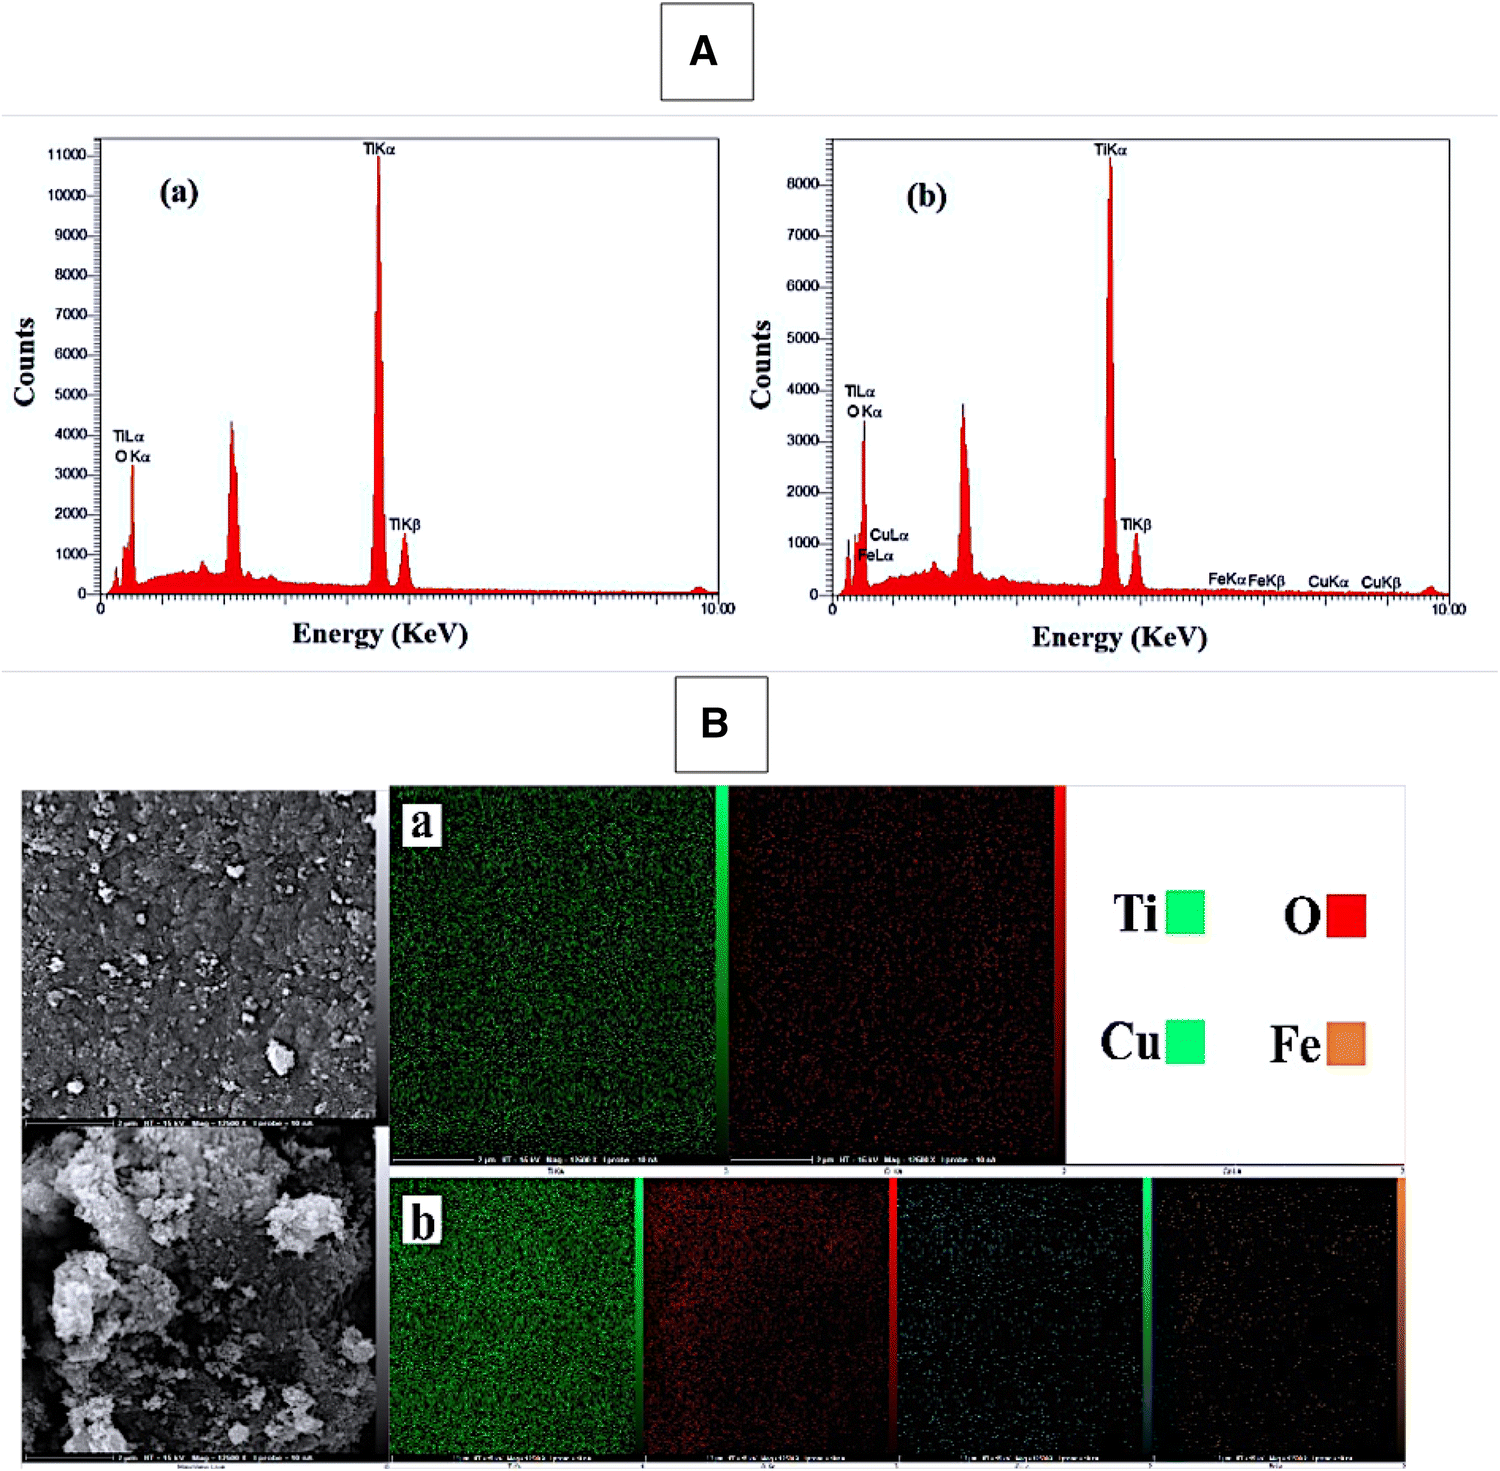
The EDX analysis was carried out to investigate chemical composition of the samples, and the results are shown in Fig.
4
and Table
2
. Despite the PXRD patterns, the elemental analysis and EDX patterns confirmed the presence of Ti, O, Cu, and Fe. In Fig.
4
A, two peaks are seen at 0.2, 4.5 keV, with the highest intensity observed at 4.5 keV. The stronger peak corresponds to the bulk titanium, and the weaker one is related to the surface titanium [
48
]. The peaks of copper are located at 0.7, 8 and 9 keV [
49
], and iron (Fe) peaks are seen at 0.9, 6.1 and 7 keV [
50
].
Fig. 4
A
EDX patterns of (a) TiO
2
and (b) TCF, and
B
elemental mapping images of (a) TiO
2
and (b) TCF
The elemental mapping EDS images (Fig.
4
B) exhibit the immensely and uniformly dispersed CuFe
2
O
4
and Fe
2
O
3
nanoparticles in the TiO
2
host lattice. These images show the presence of CuFe
2
O
4
and Fe
2
O
3
in the composite structure, although in PXRD patterns, the analogous peaks of CuFe
2
O
4
and Fe
2
O
3
are not distinguishable. This illustrates the good interaction between CuFe
2
O
4
/Fe
2
O
3
and TiO
2
particles during the hydrothermal preparation method. Also, we can observe a wide range of particles in the TCF sample that greatly affect different parameters such as blocking temperature, magnetization, etc.
DRS analysis
The DRS analysis was used to determine what effects the combination of copper ferrite spinel/ferrite oxide with titanium dioxide could have on the bandgap energy (
Ebg
) of the photocatalyst. The results are shown in Fig.
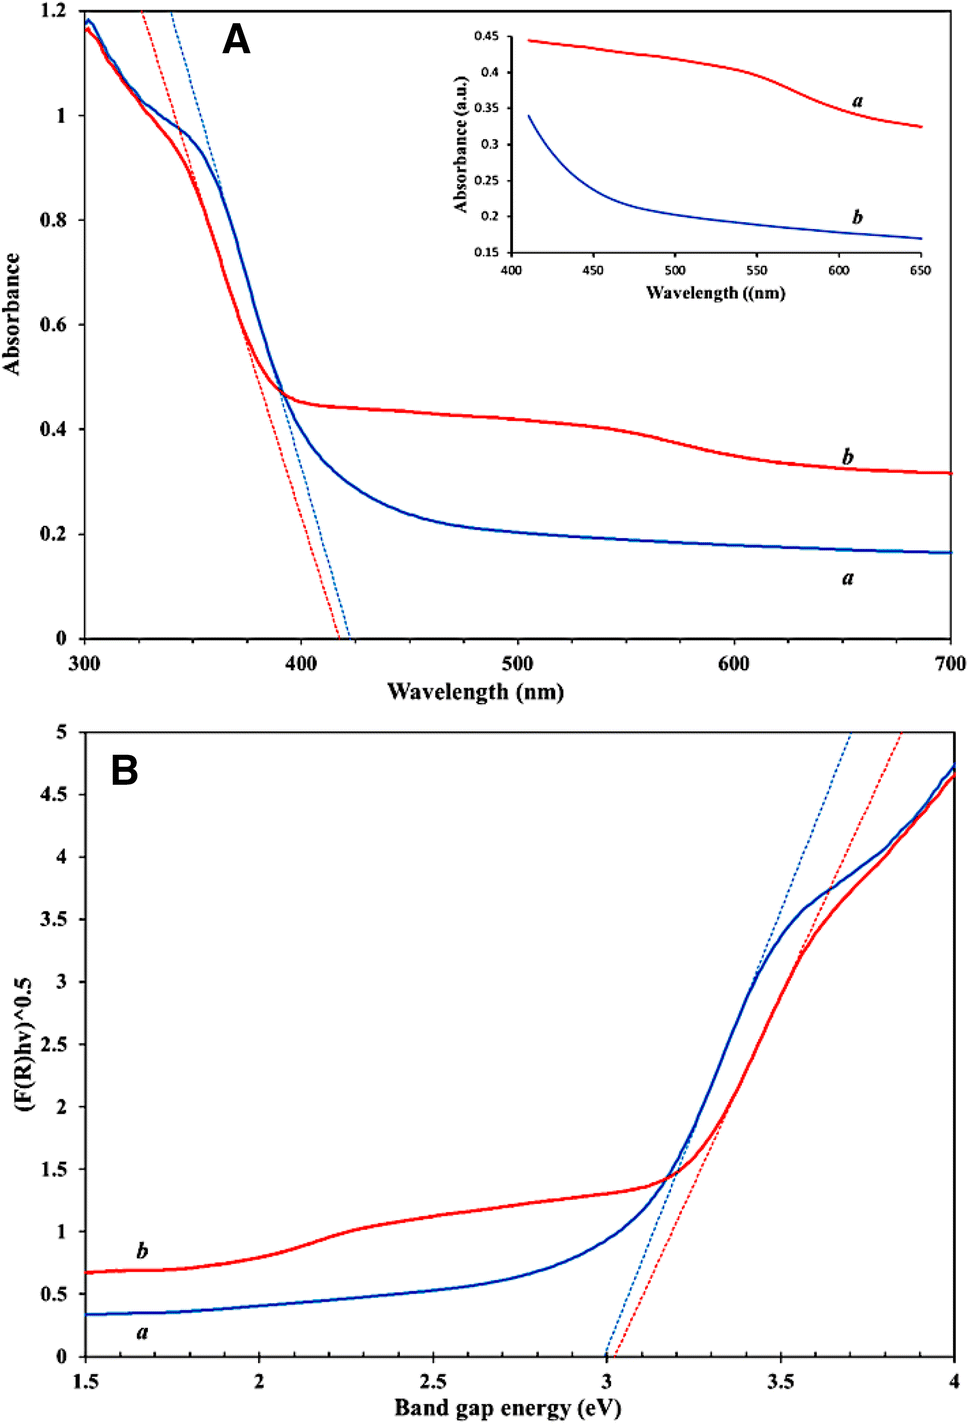
5
.
Fig. 5
A
DR spectra vs wavelength (nm) for (a) TiO
2
and (b) TCF;
B
Kubelka–Munk function of the samples vs energy band gap (eV) (a) TiO
2
and (b) TCF
Figure
5
A shows an intense broad absorption band around 400 nm corresponding to a charge transfer from 2p orbitals of oxide onions valence band to 3d t
2g
orbitals of the Ti
4+
cations [
49
,
51
]. The main absorption of TiO
2
appears in the UV range due to its large E
bg
. As can be seen in the inset graph of Fig.
5
A, there is a newly formed broad band from 450 to 630 nm that could be due to the presence of copper ferrite spinel/ferrite oxide in TCF.
The
Ebg
of the samples were calculated using Tauc’s equation:
(F(R)hν)0.5=A(hν-Ebg).
F
(
R
) is the Kubelka–Munk function,
ν
is the frequency acquired from the DRS spectra,
h
is the Planck constant, and
A
is another constant [
52
]. The results are summarized in Table
1
and Fig.
5
B. The calculated
Ebg
of TCF (3.022 eV) does not show a remarkable change compared to the pure titania
Ebg
(2.991 eV), and this again confirms the formation of TiO
2
around CuFe
2
O
4
/Fe
2
O
3
.
Nitrogen physisorption
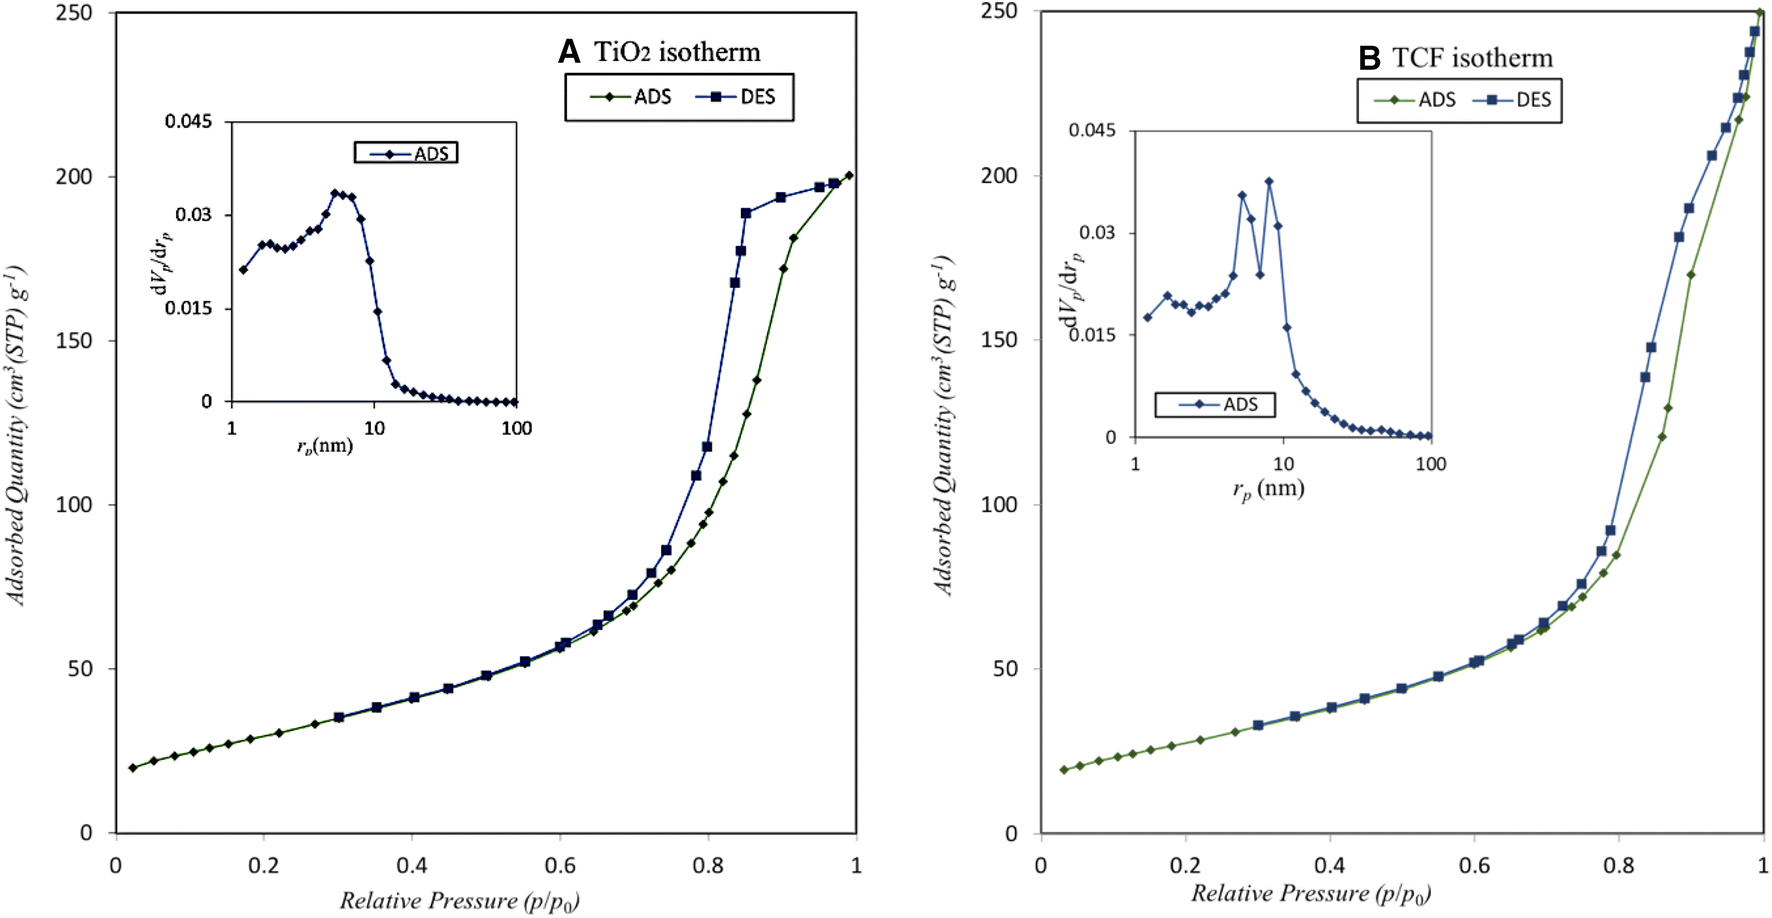
Figure
6
shows the N
2
physisorption isotherms and pore size distribution curves of the prepared samples. Both physisorption isotherms of the samples belong to Group IV of the International Union of Pure and Applied Chemistry (IUPAC) classification scheme. The samples’ specific surface area and average pore size were calculated using the BET method, and the average pore volumes were computed with the Barrett–Joyner–Halenda (BJH) model, using the adsorption branch data. The results are outlined in Table
3
. According to IUPAC classification, materials with pore sizes between 2 and 50 nm are identified as mesoporous [
52
,
53
]. Based on the data shown in Table
3
, both samples have mesopores in their structures. The nanocomposite particles have a larger average pore size, and as a result, they have less specific surface area. This could indicate that TiO
2
has covered CuFe
2
O
4
/Fe
2
O
3
nanoparticle surface leading to the formation of ternary TCF compound [
39
]. Also, the presence of copper ferrite spinel/ferrite oxide gives rise to a significant increase in the pore volume per mass unit of the nanocomposite.
Fig. 6
Nitrogen physisorption isotherms of
a
TiO
2
and
b
TCF samples. The inset graphs show the pore size distribution for each sample
Table 3
Structural parameters of the synthesized samples
Sample
SBET (m2/g)
Average pore diameter (nm)
Pore volume (cm3/g)
TiO2
110.0
10.6
0.316
TCF
102.3
16.0
0.383
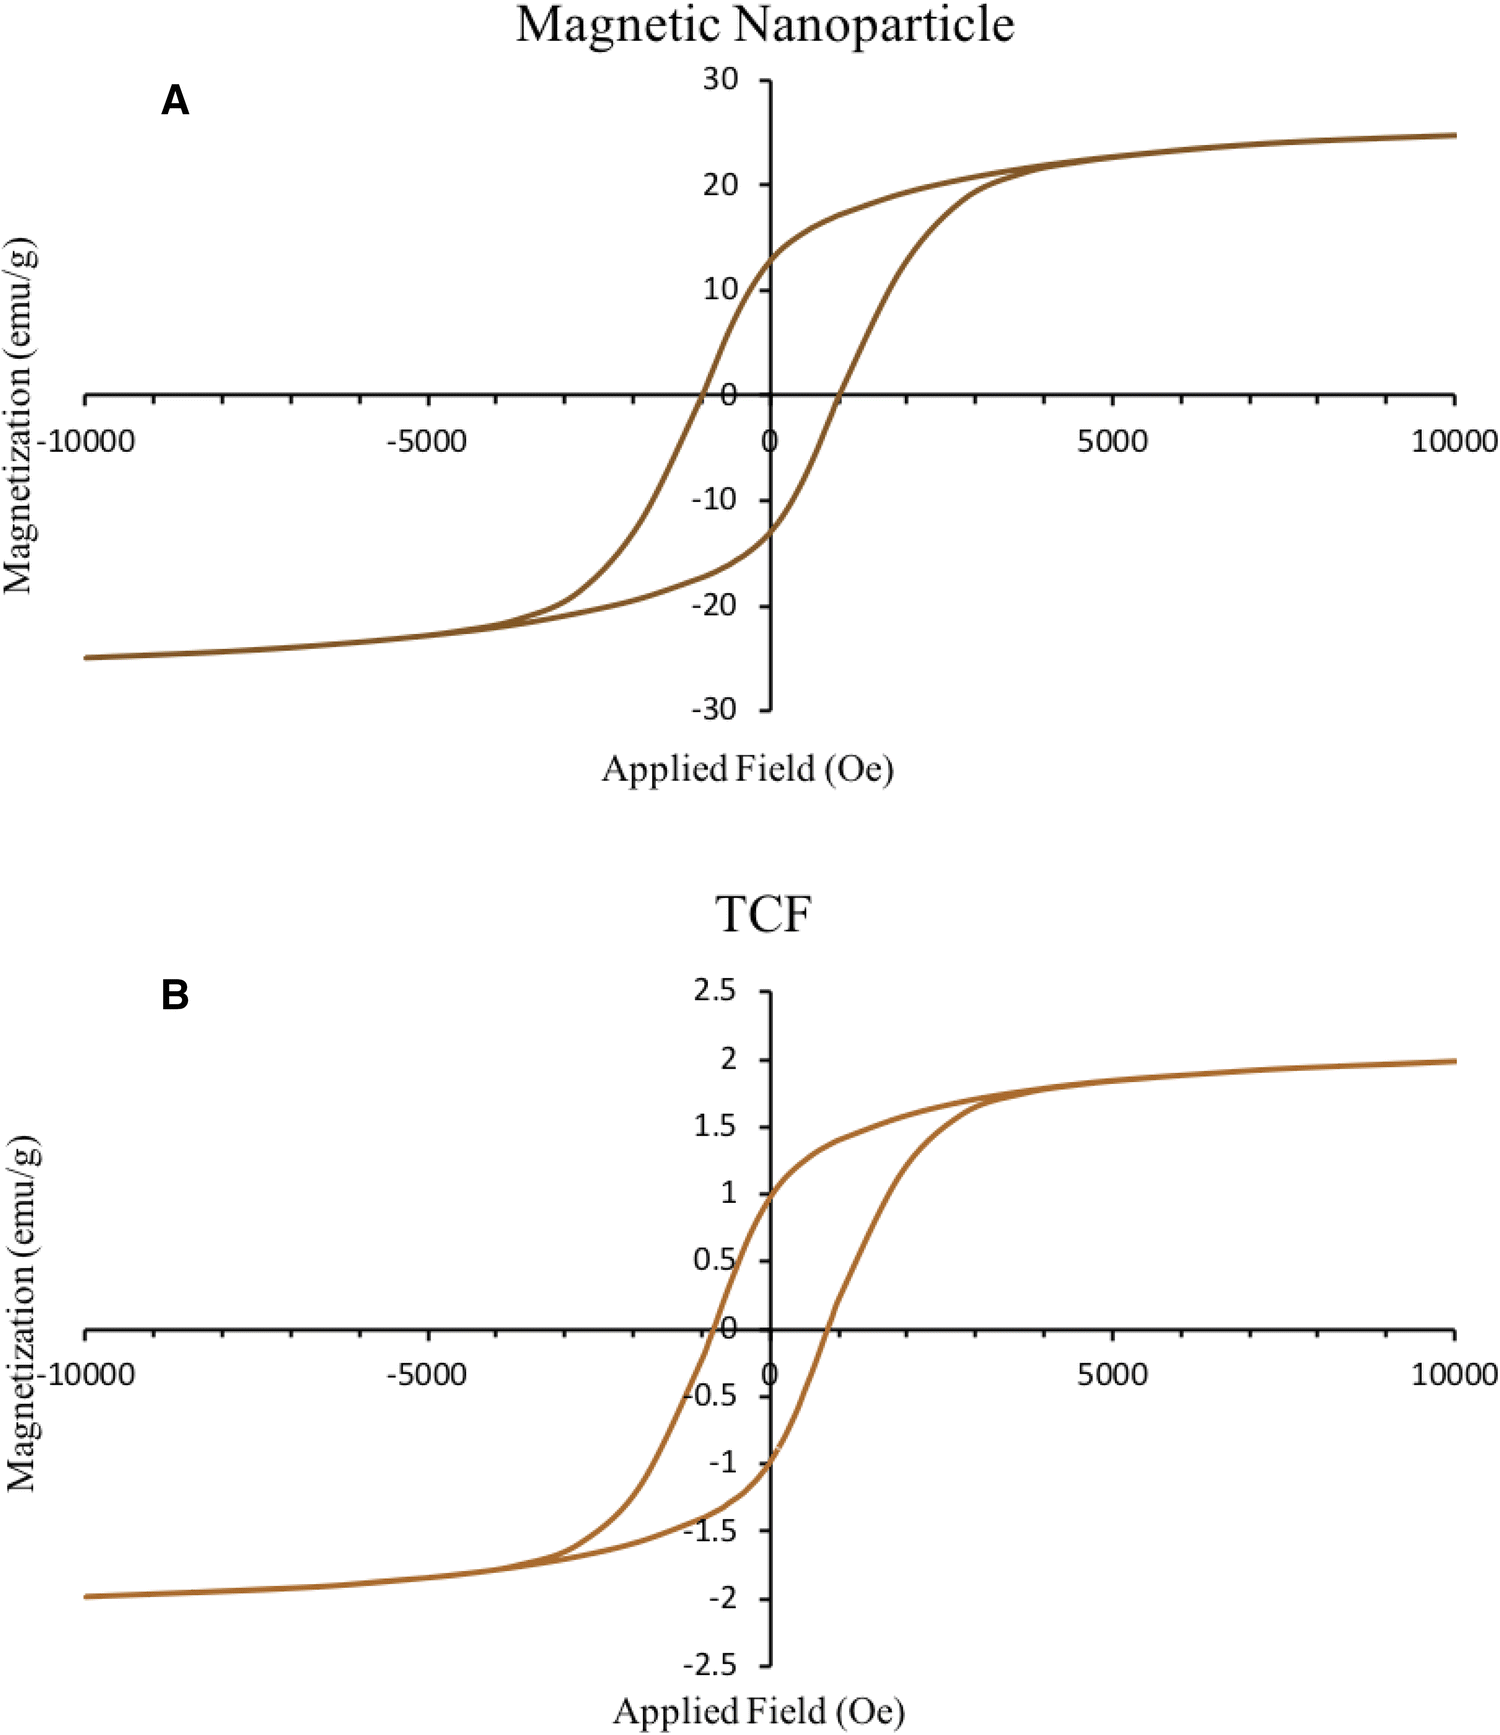
VSM measurements
The magnetization of TiO
2
and TCF were measured using a VSM system at room temperature. The maximum external magnetic field intensity used to magnetize the materials was 1 Tesla. The hysteresis loops shown in Fig.
7
indicate a considerable magnetization value for CuFe
2
O
4
(~ 24.8 emu/g). The ternary TCF nanocomposite exhibits about one order of magnitude less magnetization (~ 1.99 emu/g), which identifies it as a paramagnetic material. TiO
2
particles cover the surface of CuFe
2
O
4
/Fe
2
O
3
grains, leading to less magnetization compared to pure magnetic nanoparticles.
Fig. 7
Magnetization of
a
magnetic nanoparticles and
b
TCF sample vs external applied field
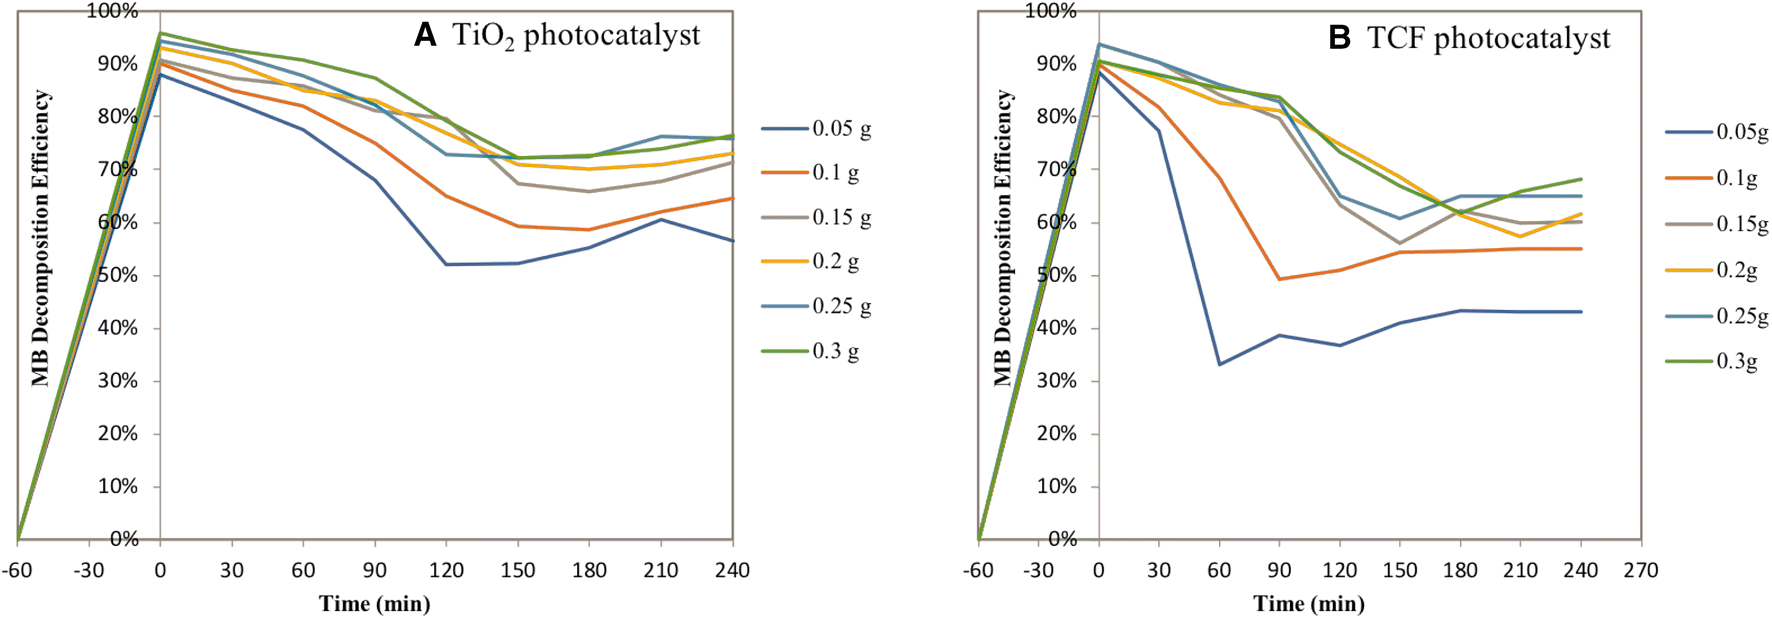
Photocatalytic decomposition of MB
To investigate the photodegradation efficiency of the synthesized samples, a suspension was prepared that consisted of different amounts of the photocatalyst in 100 mL of MB solution, with an initial concentration of 10 ppm and pH 9. To reach the adsorption–desorption equilibrium state, the solution was stirred in the dark for 60 min. Afterwards, it was exposed to tungsten light for 240 min or to UV irradiation.
Under UV radiation, pure titania showed 99% removal in 60 min, and TCF showed 98% removal in the same time period. However, under visible-light illumination, the situation was slightly different. The results for pure titania and TCF are shown in Fig.
8
. For all the different amounts of samples in the suspension, the final decomposition for pure titania is a few percent more. This may be due to the smaller bandgap energy and large crystal size of pure titania compared to those of TCF samples (Table
1
).
Fig. 8
Phtodecomposition efficiency of MB (10 ppm) in the presence of
a
TiO
2
photocatalyst and
b
TCF photocatalyst under the visible light for 240 min
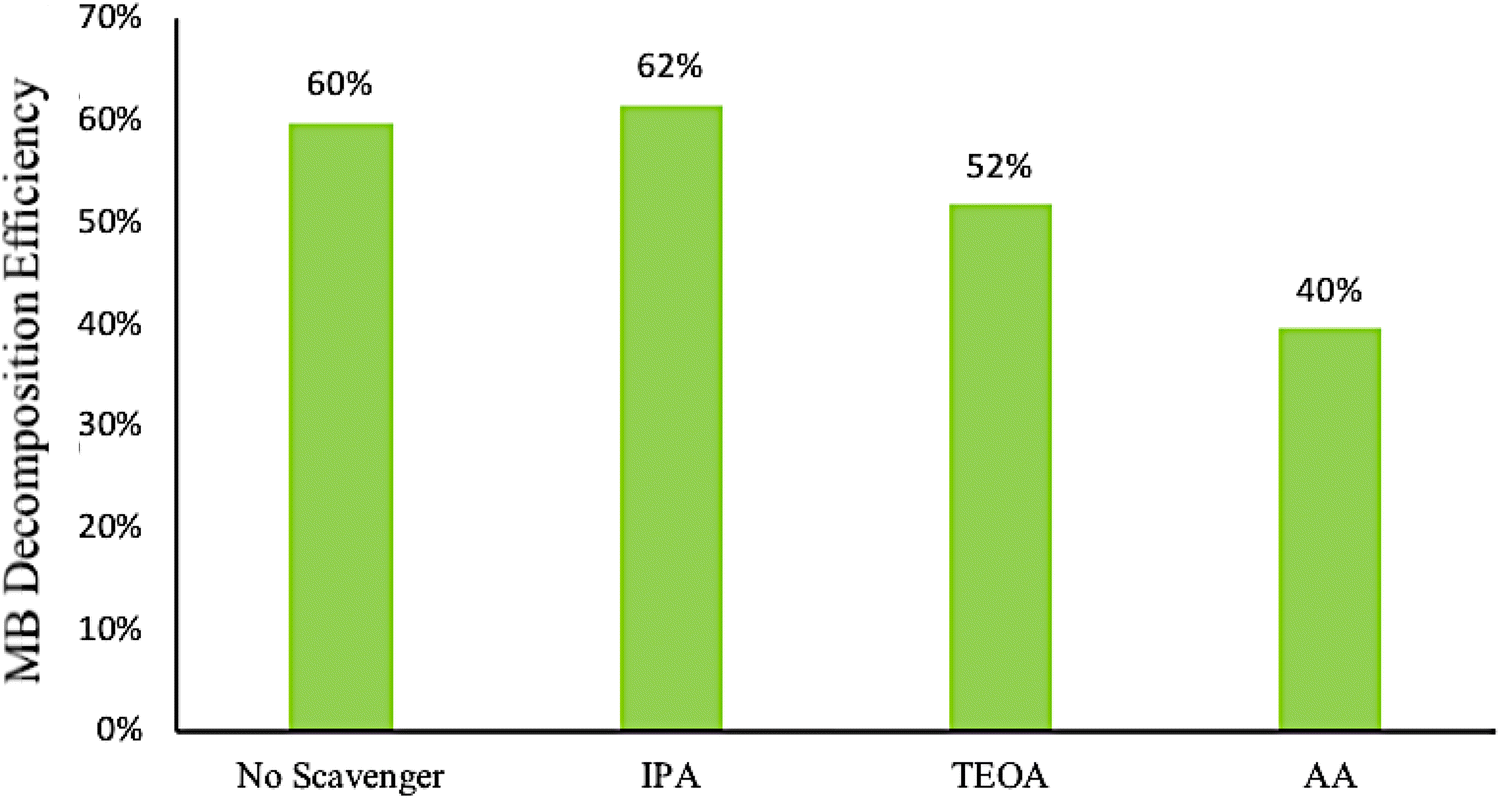
To find the major active species that are involved in the process of photodecomposition of MB in the presence of TCF samples, triethanolamine (TEOA), isopropanol (IPA), and ascorbic acid (AA) were employed as the scavengers of h
+
,
OH·
, and
O2·-
radicals, respectively. As shown in Fig.
9
, the photocatalytic removal of MB was 60% without any scavenger material. The decomposition of MB in the presence of TEOA, IPA, and AA was 52%, 62%, and 40%, respectively. This indicates that
OH·
does not play an appreciable role in the photodecomposition process, and the main species responsible for the decomposition of MB are h
+
and
O2·-
.
Fig. 9
The active species trapping experiments for TCF photocatalyst sample via different scavengers (initial dye concentration: 10 ppm; volume: 100 mL; catalyst dosage: varying between 5 and 30 mg, illumination time: 240 min)
So the mechanism of MB decomposition can be suggested as below [
29
,
54
,
55
]:
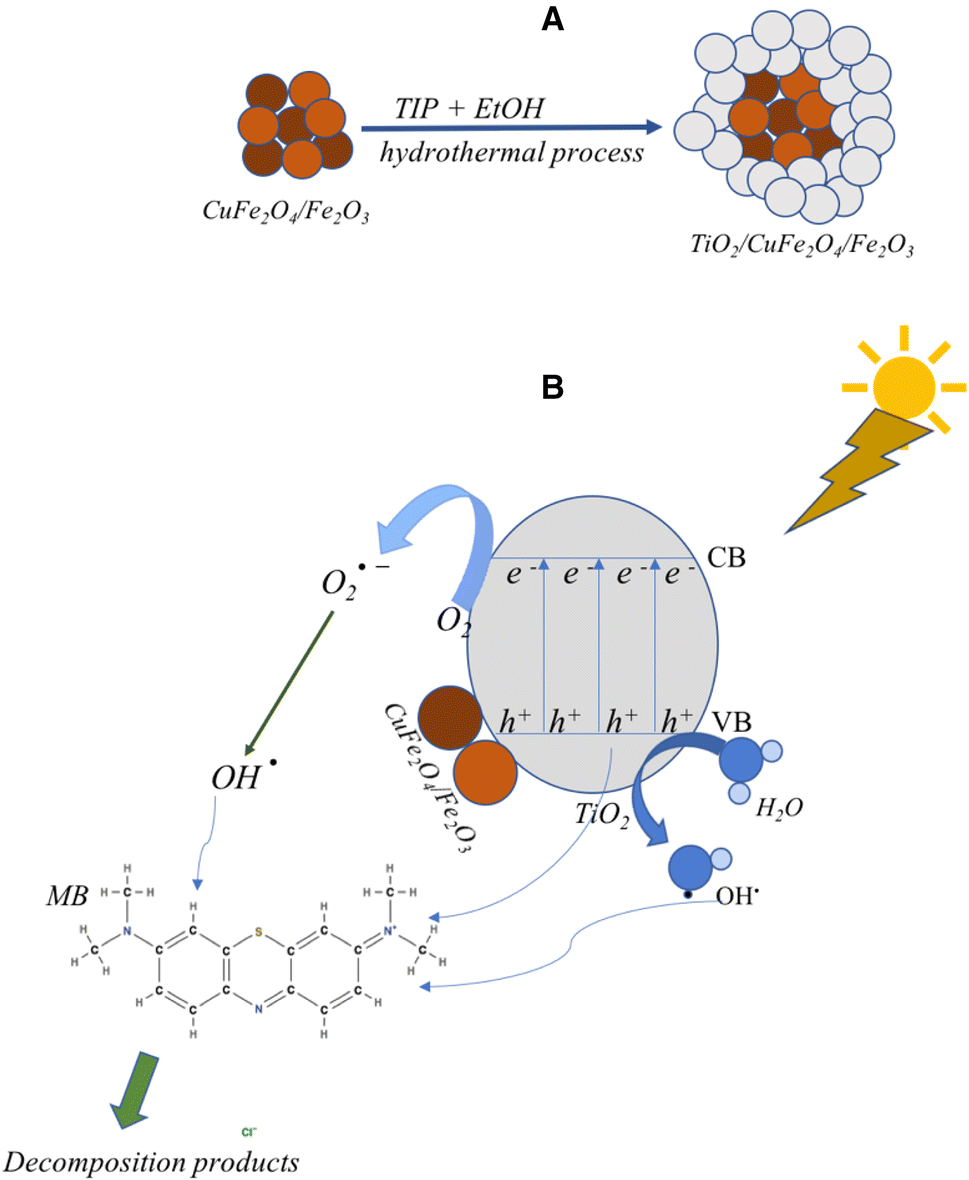
TCF+hν→TCF(eCB-+hVB+),eCB-+O2→O2·-,hVB++H2O→OH·+H+,O2·--H+→HOO·→OH·,h++MB→decompositionproducts,O2·-+MB→decompositionproducts,OH·+MB→decompositionproducts.
Figure
10
shows the schematic formation process of TCF nanocomposite and the proposed mechanism for MB decomposition in the presence of TCF.
Fig. 10
a
Schematic representation of TCF nanocomposite formation, and
b
suggested reaction mechanism for MB photodecomposition in the presence of TCF under visible light
Conclusion
Pure titania and magnetically reclaimable TCF nanocomposite were synthesized via a one-pot hydrothermal method and used for the visible-light photocatalytic decomposition of MB, an organic dye found in wastewater from the textile industry. PXRD analysis indicated that both samples preserved their anatase phased structure, with the average crystal dimension of 13.1 and 14.7 nm. The EDX and elemental mapping analyses confirm the presence of CuFe
2
O
4
/Fe
2
O
3
in the TCF sample, although there is no sign of CuFe
2
O
4
and Fe
2
O
3
phases throughout the whole range investigated; so, we can confidently rule out the presence of any secondary phase within the limits of such detection by PXRD.
Adding CuFe
2
O
4
to TiO
2
did not change the bandgap energy; however, it increased the diameter and volume of the porous structure, which will lead to higher adsorption of pollutants in aqueous environments. In this work, pure titania showed about 10% more MB decomposition compared to the magnetic nanocomposite. The presence of TCF and TiO
2
, increased maximum decomposition of MB up to 68% and 77%, respectively. The critical active species that are involved in photocatalytic decomposition of TCF are h
+
and
O2·-
, but
OH·
radical has no significant effect in the photodecomposition process.
Acknowledgements
The authors would like to thank University of Tehran for financial support of this research.
Publisher's Note
Springer Nature remains neutral with regard to jurisdictional claims in published maps and institutional affiliations.
References
Kümmerer et al. (2018) A path to clean water 361(6399) (pp. 222-224) 10.1126/science.aau2405
Buthelezi et al. (2012) Textile dye removal from wastewater effluents using bioflocculants produced by indigenous bacterial isolates 17(12) (pp. 14260-14274) 10.3390/molecules171214260
Yaseen and Scholz (2018) Treatment of synthetic textile wastewater containing dye mixtures with microcosms 25(2) (pp. 1980-1997) 10.1007/s11356-017-0633-7
Unknown ()
Attia et al. (2008) Removal of methylene blue by carbons derived from peach stones by H3PO4 activation: batch and column studies 76(1) (pp. 282-289) 10.1016/j.dyepig.2006.08.039
Dewachter et al. (2005) Severe anaphylactic shock with methylene blue instillation 101(1) (pp. 149-150) 10.1213/01.ane.0000153497.60047.80
Jadhav et al. (2015) Arsenic and fluoride contaminated groundwaters: a review of current technologies for contaminants removal (pp. 306-325) 10.1016/j.jenvman.2015.07.020
Kabra et al. (2004) Treatment of hazardous organic and inorganic compounds through aqueous-phase photocatalysis: a review 43(24) (pp. 7683-7696) 10.1021/ie0498551
Wang and Xu (2012) Advanced oxidation processes for wastewater treatment: formation of hydroxyl radical and application 42(3) (pp. 251-325) 10.1080/10643389.2010.507698
Santhosh et al. (2016) Role of nanomaterials in water treatment applications: a review (pp. 1116-1137) 10.25112/rco.v1i0.1706
Delsouz Khaki et al. (2017) Application of doped photocatalysts for organic pollutant degradation—a review (pp. 78-94) 10.1016/j.jenvman.2017.04.099
Rauf et al. (2011) An overview on the photocatalytic degradation of azo dyes in the presence of TiO2 doped with selective transition metals 276(1–3) (pp. 13-27) 10.1016/j.desal.2011.03.071
Malato et al. (2016) Decontamination and disinfection of water by solar photocatalysis: the pilot plants of the Plataforma Solar de Almeria (pp. 15-23) 10.1016/j.mssp.2015.07.017
Hoffmann et al. (1995) Environmental applications of semiconductor photocatalysis 95(1) (pp. 69-96) 10.1021/cr00033a004
Yu et al. (2008) Decomposition and mineralization of cefaclor by ionizing radiation: kinetics and effects of the radical scavengers 71(11) (pp. 2106-2112) 10.1016/j.chemosphere.2008.01.020
Ahmad et al. (2016) Photocatalytic systems as an advanced environmental remediation: recent developments, limitations and new avenues for applications 4(4A) (pp. 4143-4164) 10.1016/j.jece.2016.09.009
Chen and Mao (2007) Titanium dioxide nanomaterials: synthesis, properties, modifications and applications 107(7) (pp. 2891-2959) 10.1021/cr0500535
Pelaez et al. (2012) A review on the visible light active titanium dioxide photocatalysts for environmental applications (pp. 331-349) 10.1016/j.apcatb.2012.05.036
Nakata et al. (2012) Photoenergy conversion with TiO2 photocatalysis: new materials and recent applications (pp. 103-111) 10.1016/j.electacta.2012.03.035
Wu et al. (2016) Organic phase syntheses of magnetic nanoparticles and their applications (pp. 10473-10512) 10.1021/acs.chemrev.5b00687
Huang and Keller (2015) EDTA functionalized magnetic nanoparticle sorbents for cadmium and lead contaminated water treatment (pp. 159-168) 10.1016/j.watres.2015.05.011
Baker and Kamat (2009) Photosensitization of TiO2 nanostructures with CdS quantum dots: particulate versus tubular support architectures 19(5) (pp. 805-811) 10.1002/adfm.200801173
Suwarnkar et al. (2014) Enhanced photocatalytic activity of Ag doped TiO2 nanoparticles synthesized by a microwave assisted method 40(4) (pp. 5489-5496) 10.1016/j.ceramint.2013.10.137
Gómez-Pastora et al. (2017) Review and perspectives on the use of magnetic nanophotocatalysts (MNPCs) in water treatment (pp. 407-427) 10.1016/j.cej.2016.04.140
Schneider et al. (2016) Royal Society of Chemistry
Reddy and Yun (2016) Spinel ferrite magnetic adsorbents: alternative future materials for water purification? (pp. 90-111) 10.1016/j.ccr.2016.01.012
Selima et al. (2019) Comparative studies on the impact of synthesis methods on structural, optical, magnetic and catalytic properties of CuFe2O4 45(5) (pp. 6535-6540) 10.1016/j.ceramint.2018.12.146
Sabbaghan and Sofalgar (2016) Single-phase γ-Fe2O3 nanoparticles synthesized by green ionothermal method and their magnetic characterization 42(15) (pp. 16813-168163) 10.1016/j.ceramint.2016.07.172
Zhang and Lei (2008) Preparation of photocatalytic Fe2O3–TiO2 coatings in one step by metalorganic chemical vapor deposition (pp. 2406-2412) 10.1016/j.apsusc.2007.09.067
Yi et al. (2006) Synthesis and applications of magnetic nanocomposite catalysts 18(10) (pp. 2459-2461) 10.1021/cm052885p
Mitra et al. (2010) Soft-templating approach for the synthesis of high surface areaand superparamagnetic mesoporous iron oxide materials 131(1–3) (pp. 373-377) 10.1016/j.micromeso.2010.01.017
Arifin et al. (2019) Synthesis of titania doped copper ferrite photocatalyst and its photoactivity towards methylene blue degradation under visible light irradiation 14(1) (pp. 219-227) 10.9767/bcrec.14.1.3616.219-227
Khan et al. (2016) Preparation and characterization of CuFe2O4/TiO2 photocatalyst for the conversion of CO2 into methanol under visible light 10(10) (pp. 1273-1280)
Kezzim et al. (2011) Visible light induced hydrogen on the novel hetero-system CuFe2O4/TiO2 (pp. 2800-2806) 10.1016/j.enconman.2011.02.014
Yusuf et al. (2018) Facile construction of ternary CuFe2O4–TiO2 nanocomposite supported reduced graphene oxide (rGO) photocatalysts for the efficient hydrogen production (pp. 772-779) 10.1016/j.apsusc.2018.01.282
Ebrahimian Pirbazari et al. (2017) Co/TiO2 nanoparticles: preparation, characterization and its application for photocatalytic degradation of methylene blue (pp. 283-292) 10.5004/dwt.2017.20205
Hashemian et al. (2013) Kinetics and thermodynamics of adsorption methylene blue onto tea waste/CuFe2O4 composite 4(7) (pp. 1-7) 10.4236/ajac.2013.47A001
Thapa et al. (2010) Enhanced magnetization in cubic ferrimagnetic CuFe2O4 nanoparticles synthesized from a citrate precursor: the role of Fe2+ 43(19) 10.1088/0022-3727/43/19/195004
Suresh et al. (2016) Effect of bulk and nano-Fe2O3 particles on peanut plant leaves studied by Fourier transform infrared spectral studies Effect of Fe2O3 particles on peanut plant leaves 7(5) (pp. 739-747) 10.1016/j.jare.2015.10.002
Wu et al. (2015) Peculiar porous α-Fe2O3, γ-Fe2O3 and Fe3O4 nanospheres: facile synthesis and electromagnetic properties (pp. 443-451) 10.1016/j.powtec.2014.09.045
Tronc et al. (1998) Structural and magnetic characterization of e-Fe2O3 139(1) (pp. 93-104) 10.1006/jssc.1998.7817
Ogata (2017) Effect of aliovalent dopants on the kinetics of spinodal decomposition in rutile-type TiO2–VO2 37(9) (pp. 3177-3183) 10.1016/j.jeurceramsoc.2017.03.039
Scherrer (1918) Determination of the internal structure and size of colloid particles by X-rays (pp. 98-100)
Khan and Cao (2013) Cationic (V, Y)-codoped TiO2 with enhanced visible light induced photocatalytic activity: A combined experimental and theoretical study 114(18) 10.1063/1.4831658
Ashcroft and Mermin (1976) Saunders College
Venkatachalam et al. (2007) Enhanced photocatalytic degradation of 4-chlorophenol by Zr4+ doped nano TiO2 266(1–2) (pp. 158-165) 10.1016/j.molcata.2006.10.051
Ghasemi et al. (2009) Transition metal ions effect on the properties and photocatalytic activity of nanocrystalline TiO2 prepared in an ionic liquid 172(2–3) (pp. 1573-1578) 10.1016/j.jhazmat.2009.08.029
Venkatachalam et al. (2007) Sol-gel preparation and characterization of alkaline earth metal doped nano TiO2: efficient photocatalytic degradation of 4-chlorophenol 273(1–2) (pp. 177-185) 10.1016/j.molcata.2007.03.077
Rahman et al. (2017) Single step growth of iron oxide nanoparticles and their use as glucose biosensor (pp. 4451-4456) 10.1016/j.rinp.2017.11.001
Kumar et al. (2014) Achieving enhanced visible-light-driven photocatalysis using type-II NaNbO3/CdS core/shell heterostructures 6(15) (pp. 13221-13233) 10.1021/am503055n
Rouquerol et al. (1994) Recommendation for the characterization of porous solids 66(8) (pp. 1739-1758) 10.1351/pac199466081739
Zdravkov et al. (2007) Pore classification in the characterization of porous materials: a perspective 5(2) (pp. 385-395) 10.2478/s11532-007-0017-9
Ng and Cheng (2016) Photo-polishing of POME into CH4-lean biogas over the UV-responsive ZnO photocatalyst (pp. 127-138) 10.1016/j.cej.2016.04.105
Anuchai et al. (2018) Low temperature preparation of oxygen-deficient tin dioxide nanocrystals and a role of oxygen vacancy in photocatalytic activity improvement (pp. 105-114) 10.1016/j.jcis.2017.10.047