Results and discussion
Morphological analysis
As mentioned before, Rrms evaluation does not give essential information about height scale and makes scientists replace it with another statistical parameter called PSD which describes roughness changes with length scale.
PSD is defined as the square of surface roughness amplitude versus wavelength which is applied to compare surface quality quantitatively [ 14 ]. AFM images are for PSD analysis as presented in Fig. 2 for all tissue. Figure 3 represents the PSD plots of dental hard tissue, i.e. enamel out, inter enamel, dentin, and cementum calculated through FFT algorithm. Moreover, frequency distribution versus frequency are calculated by FFT and finally PSD functions as |F ( x, y )| 2 in which F ( x , y ) are FFT coefficients. On the other hand, normalizing PSD reaches units of (length) 4 [ 15 ].
Microstructure fractal information is obtained by PSD versus spatial frequency [
16
] via AFM data. The following equation describes PSD function [
17
]:
We have
In addition, the power
Moreover, the relation between Df and the slope of log–log plot is given by
β
in Eq. (
6
), which is presented by as follows:
At different scales,
D
determines surface irregularities (Fig.
1
).
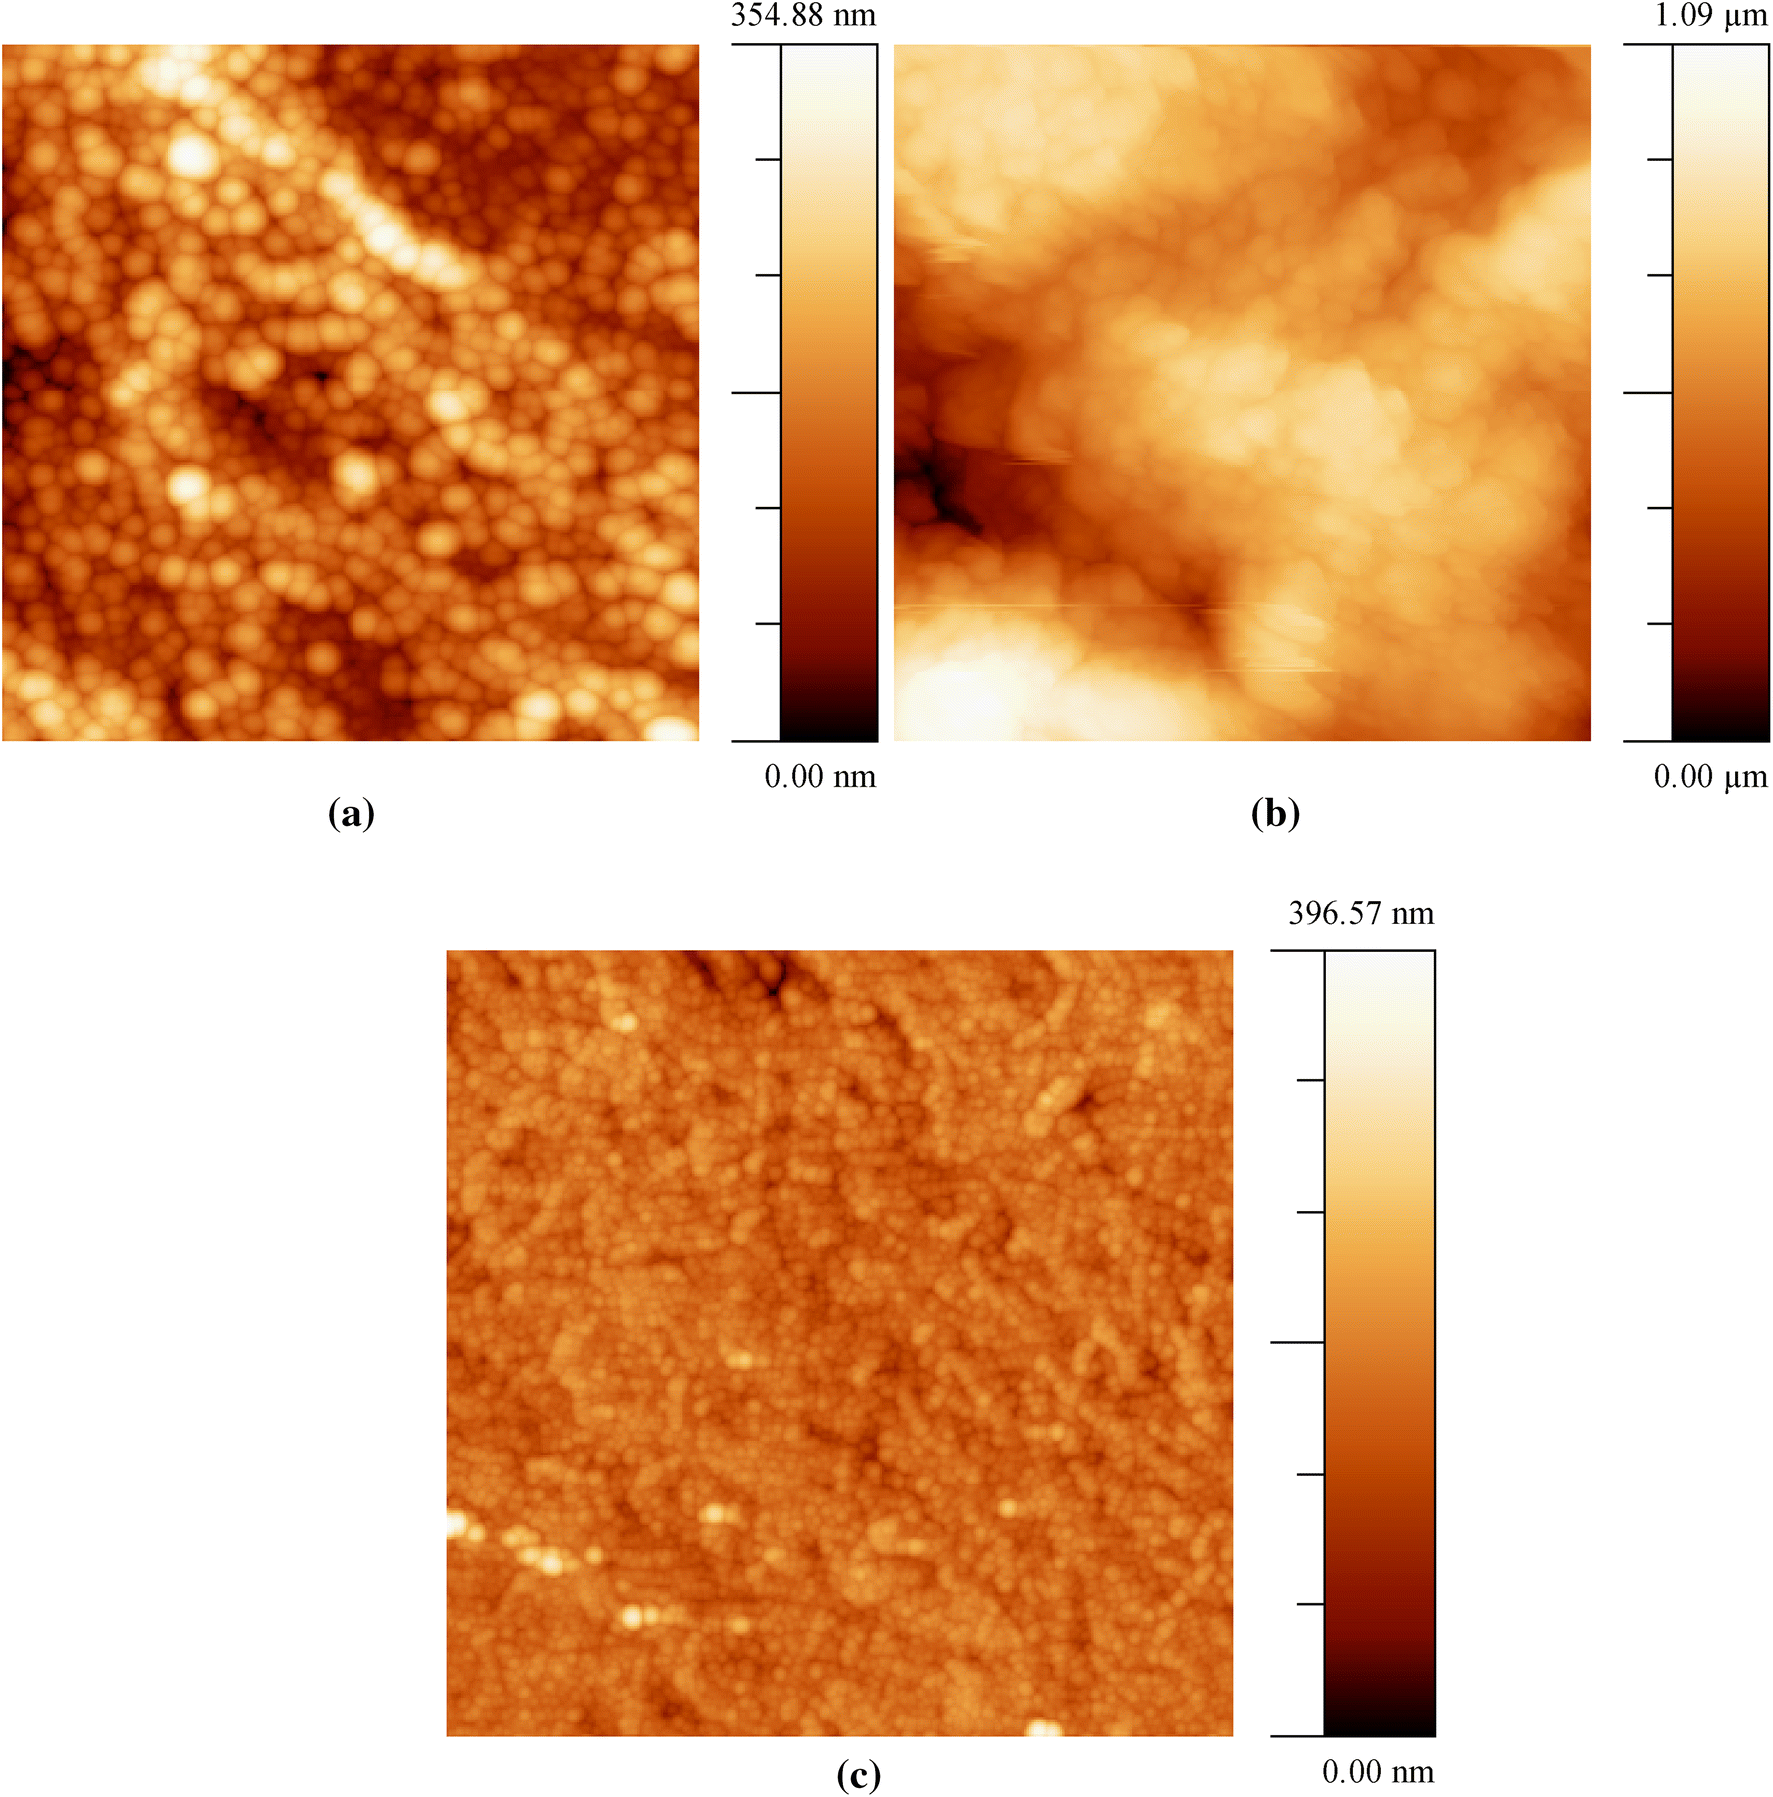
AFM images (1 × 1 µm
2
, 512 × 512 pts) of each dental tissue:
a
enamel,
b
dentin,
c
cementumFig. 1
From another aspect, PSD
ABC
plots can be described by
k
-correlation function which gives information about plot features [
20
] and hence, by considering
f
as the spatial frequency, it is defined as follow:
Here, “ A ” is the magnitude of low spatial frequency, “ B ” is the ‘knee,’ i.e. the slope of connective line between two points of the surface of enamel, dentin, and camentum, and “ C ” with its constant value refers to the nature of roughness.
In Fig.
2
, high spatial frequency region is characterized. While the shapes of curves were similar in both low- and mid-frequency region where the most energy exists, some differences were observed in the specified region. As mentioned before, tooth structures in all tissue are fine and highly organized and they increase by increasing fractal dimension (
D
). The results of Fig.
1
are summarized in Table
1
and it was observed that decreasing slope ends increase of fractal dimension at high-frequency region which occurs by moving from enamel to dentin and cementum.
The spectral log PSD–log
K
plots for each dental tissue and their comparison The values of Df for each tissue extracted from Eq. (
6
) Sample Slope Fractal dimension ( Enamel − 3.420 2.29 Dentin − 3.158 2.42 Cementum − 2.517 2.70Fig. 2
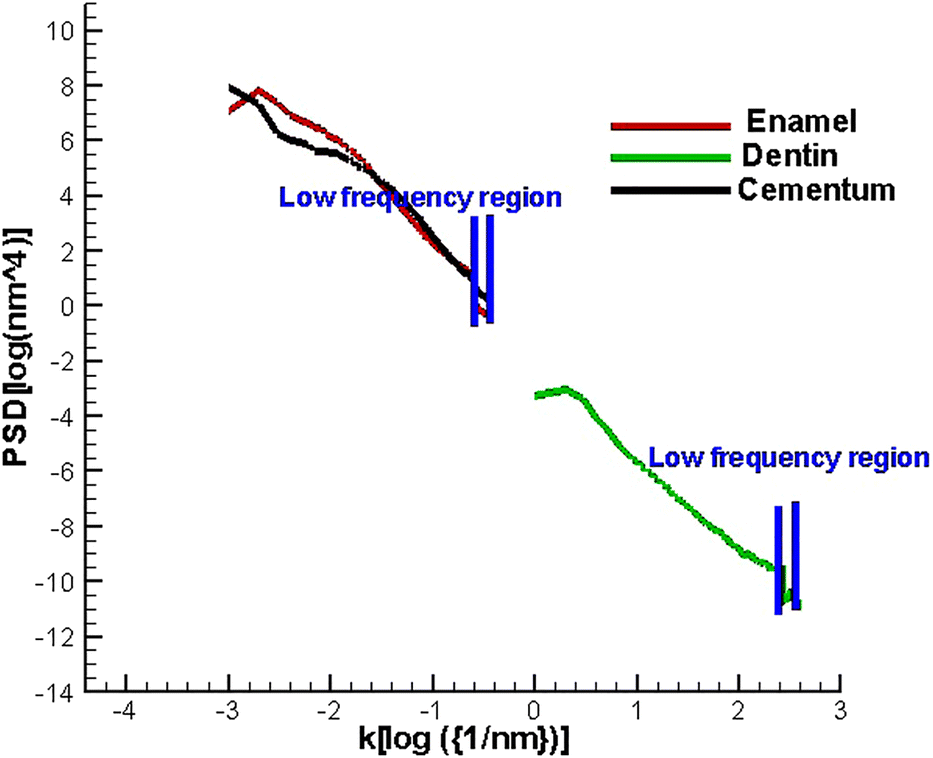
Table 1
In Fig.
3
, the slope variation (
D
) of log PSD–log
K
diagram was estimated for enamel and confirms the dependency of
D
to frequency and spectrum region. In addition, the results of Fig.
3
are presented in Table
2
. As can be seen, the best fitted line in Fig.
3
is line III since slope changes depend directly on spectral range, frequency, and data size [
20
]. Moreover, Tables
3
and
4
describe the dependency of slope and fractal dimension on dentin and cementum. Hence, in enamel, increase of fractal dimension takes place by decreasing slope.
The diagram of log PSD–log frequency which confirms the effect of frequency region on the values of slopes in enamel The values of Df and slopes in specified frequency region of enamel Frequency region Slope Df Low − 4.006 1.99 Mid − 3.826 2.08 High − 3.158 2.42 The values of Df and slopes in specified frequency region of dentin Frequency region Slope Df Low − 3.153 2.42 Mid − 3.132 2.43 High − 3.607 2.20 The values of Df and slopes in specified frequency region of cementum Frequency region Slope Df Low − 3.612 2.19 Mid − 4.005 1.99 High − 2.517 2.70Fig. 3
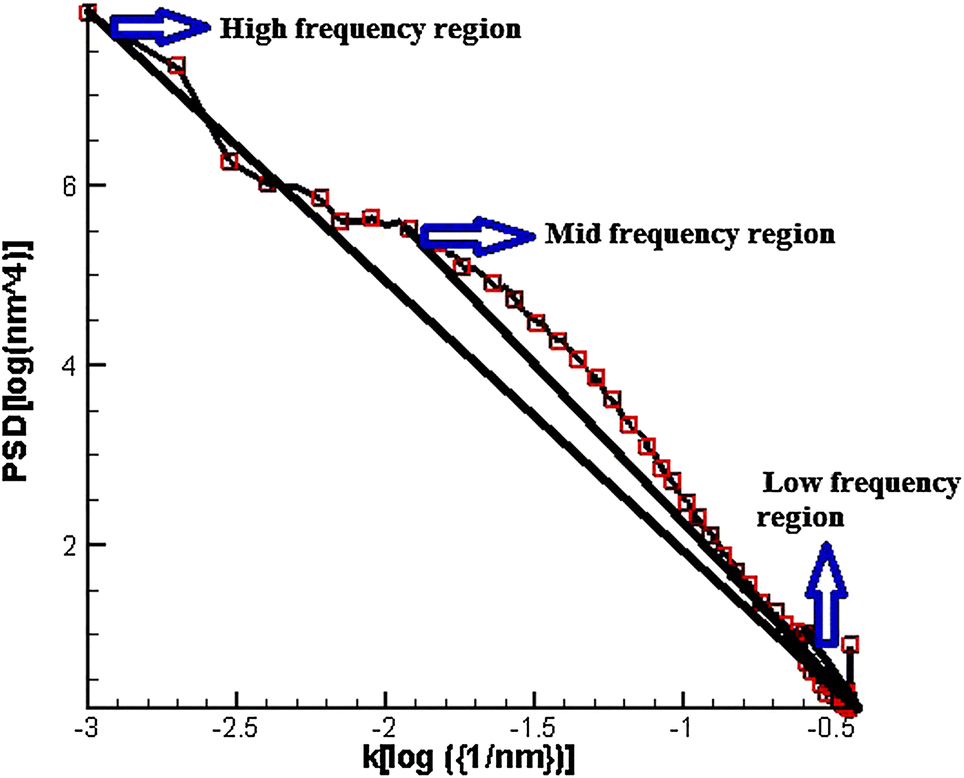
Table 2
Table 3
Table 4
Moreover, Table 3 shows that by decreasing slope from low to mid frequency region in dentin, fractal dimension was increased while by moving to high-frequency region, increasing slope reduces the fractal dimension. In Table 4 , as can be seen for cementum, increasing frequency from low to mid decreases fractal dimension while moving from mid to high-frequency region decreases the slope which finally ends in increase of fractal dimension.
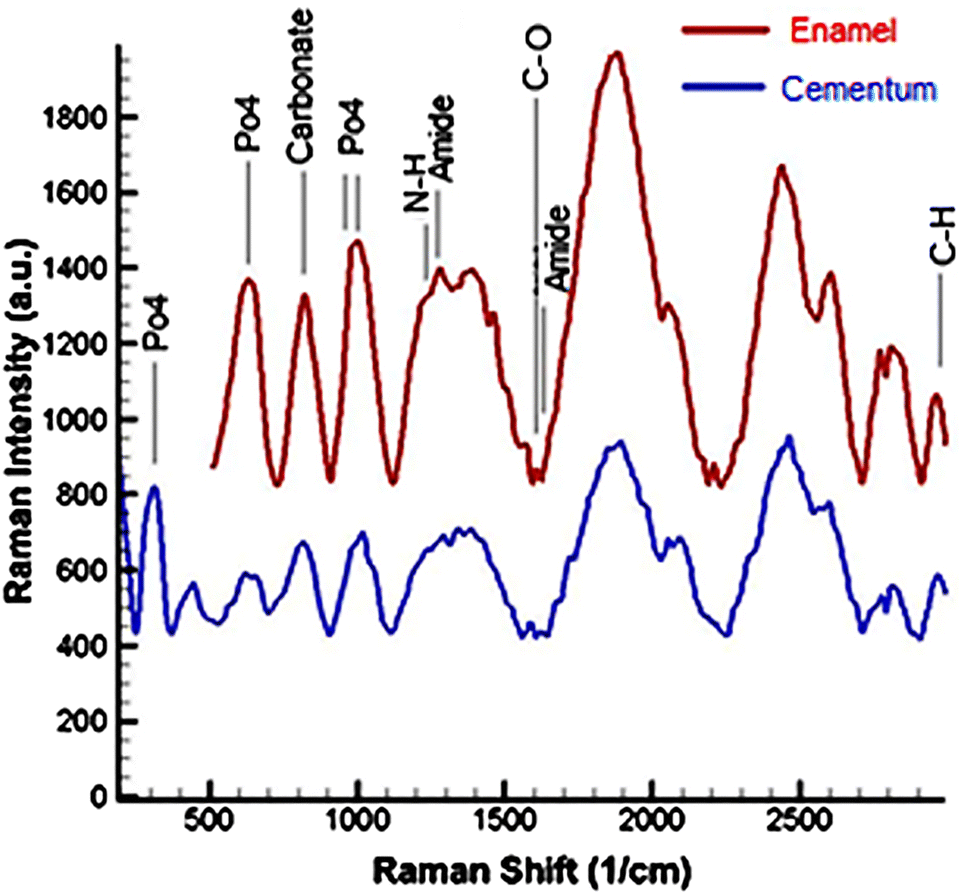
According to Raman spectra of enamel and cementum in Fig.
4
, a large variety of lines are due to mechanical stress whose width confirms their solid nature with a complex structure. Moreover, strong peak at 960 cm
−1
represents HAP structure (PO4 functional group) which is similar in both tissue but with more intensity in enamel. As can be seen, the mentioned peak is surrounded by weak peaks around it. Wide bands are also observed in cementum in the range of 900 cm
−1
to 1100 cm
−1
. There are some similarities in phosphate bands of enamel and cementum. On the other hand, the groups of amides and organic materials are revealed at 1450, and 1245 cm
−1
while double C–O bond is illustrated in the range 1600–1700 cm
−1
.
Raman spectra of cementum (top) and enamel (bottom)Fig. 4