Sri Lanka Institute of Nanotechnology (SLINTEC), Nanotechnology and Science Park, Homagama, LK
Postgraduate Institute of Science, University of Peradeniya, Peradeniya, LK
Department of Chemistry, University of Peradeniya, Peradeniya, LK
Department of Chemistry, Faculty of Science, University of Colombo, Colombo, 00300, LK
Abstract
Photocatalytic semiconductor thin films have the ability to degrade volatile organic compounds (VOCs) causing numerous health problems. The group of VOCs called “BTEX” is abundant in houses and indoor of automobiles. Anatase phase of TiO
2
has a band gap of 3.2 eV and UV radiation is required for photogeneration of electrons and holes in TiO
2
particles. This band gap can be decreased significantly when TiO
2
is doped with nitrogen (N-TiO
2
). Dopants like Pd, Cd, and Ag are hazardous to human health but N-doped TiO
2
can be used in indoor pollutant remediation. In this research, N-doped TiO
2
nano-powder was prepared and characterized using various analytical techniques. N-TiO
2
was made in sol–gel method and triethylamine (N(CH
2
CH
3
)
3
) was used as the N-precursor. Modified quartz cell was used to measure the photocatalytic degradation of toluene. N-doped TiO
2
nano-powder was illuminated with visible light (xenon lamp 200 W,
λ
= 330–800 nm, intensity = 1 Sun) to cause the degradation of VOCs present in static air. Photocatalyst was coated on a thin glass plate, using the doctor-blade method, was inserted into a quartz cell containing 2.00 µL of toluene and 35 min was allowed for evaporation/condensation equilibrium and then illuminated for 2 h. Remarkably, the highest value of efficiency 85% was observed in the 1 μm thick N-TiO
2
thin film. The kinetics of photocatalytic degradation of toluene by N-TiO
2
and P25-TiO
2
has been compared. Surface topology was studied by varying the thickness of the N-TiO
2
thin films. The surface nanostructures were analysed and studied with atomic force microscopy with various thin film thicknesses.
Introduction
Titanium dioxide (TiO
2
) has been known as one of the most popular photocatalytic semiconductor materials [
1
,
2
–
3
] and has attracted a great deal of attention because of its good stability [
4
,
5
], nontoxicity [
6
], high photocatalytic efficiency [
7
] and low cost [
8
,
9
]. However, TiO
2
has a high band gap (
Eg
= 1 eV) in its anatase phase [
10
] and, as a result, it can only absorb radiation in the UV range. This phenomenon limits its practical ability to use as solar energy-driven photocatalyst since the solar radiation has only about 5% of UV radiation. To overcome this barrier of higher band gap, several modifications have been proposed. Doping TiO
2
with other materials, such as non-metals [
11
,
12
] and metals [
13
,
14
], has been investigated for extending the radiation absorption of TiO
2
to the visible range to maximize the use of the visible light region of solar spectrum. In the past few decades, considerable research studies have shown that doping TiO
2
with non-metal elements, such as carbon, boron, fluorine, nitrogen and sulphur, enables the realization of visible light-responsive TiO
2
. Among those studies, nitrogen doping has been proved to be a modest and most effective technique [
15
] to achieve visible light stimulated photocatalytic activities of TiO
2
. However, most of the studies on nitrogen-doped TiO
2
have assumed that the nitrogen doping results in a surface or sub-surface modification making it difficult to narrow down the band gap in the bulk of TiO
2
. Such a surface modification could only improve the visible light absorption in the range of 400–600 nm. These materials have been used in different forms, such as aqueous TiO
2
suspensions [
16
], thin films [
17
] and nanocoatings in different practical applications. Thin films can be easily fabricated using the sol–gel method, dip-coating and by spin-coating techniques which constitute one of the simplest and promising approaches for synthesizing thin film materials with controlled optical, structural and morphological properties. These films have been found to be attractive in heterogeneous photocatalytic degradation (HPD) of volatile organic compounds [
18
,
19
].
The present study investigates the use of nitrogen-doped TiO
2
thin films fabricated by sol–gel method, followed by doctor blading on glass surfaces and subsequent annealing to use in the photocatalytic degradation of VOC compounds in indoor environments. Effect of layer thickness on the degradation effect will also be described. Thin film formation method is very important to maintain right porosity and the required surface roughness for efficient degradation of VOC compounds.
Experimental
Material
P25-TiO
2
(Sigma-Aldrich, Germany), AgNO
3
(> 99% (Titration) Sigma-Aldrich, Germany) and triethylamine (N(CH
2
CH
3
)
3
/Et
3
N) (Sigma-Aldrich, Germany), tetrabutyltitanate [Ti(OC
4
H
9
)
4
, Sigma-Aldrich, Germany], isopropyl alcohol (C
3
H
7
OH), conc. HNO
3
and conc. acetic acid (CH
3
COOH) (Sigma-Aldrich, Germany) were used as received.
Preparation of N-TiO2 nanoparticles
The N-TiO
2
was prepared by the sol–gel method [
20
,
21
] and it was done by following a procedure reported by Wu et al. [
22
] where isopropyl alcohol (C
3
H
7
OH) and Ti(OC
4
H
9
)
4
, in acidic medium, were used to prepare TiO
2
nanoparticles. 5.0 mL of C
3
H
7
OH and Ti(OC
4
H
9
)
4
was mixed with 30.0 mL of 0.20 mol dm
−3
HNO
3
solution. Then, the mixture was aged for 12 h to obtain a transparent nanosol. 2.0 mL of N(CH
2
CH
3
)
3
was added and well mixed and allowed to age for 12 h, with stirring, at ambient temperature. Then, the sol was refluxed, at 100 °C, for 6 h. Continuous stirring was always maintained to prevent the sol from coagulation. Finally, the sol was dried at 120 °C for 6 h and then calcined at 450 °C for 4 h. During the calcination process, sample turned to a light yellowish colour.
Characterization of the N-TiO2 nanoparticles
The N-TiO
2
was examined by scanning electron microscopy (SEM) HITACHI-SU 6600 Analytical Variable Pressure FE-SEM with gold ion sputter, E-1020 microscope, operated at 20 kV in the secondary electron mode. X-ray diffraction (XRD) patterns were collected on Bruker D8 Focus X-ray Powder Diffractometer operated at 40 kV and 40 mA, using Cu K
α
radiation (
λ
= 0.15418 nm) in the thin film mode with a step size of 0.2° and counting time of 1.0 s per step. UV–Vis–NIR spectrophotometer (
UV 3600, Shimadzu, Japan
) was used to determine band gaps of semiconductors using diffuse reflectance mode, using BaSO
4
as reflectance sample, and the kinetics of photodegradation was evaluated in the absorbance mode, with air as the reference. Reflectance spectra were analysed at ambient conditions, in the wavelength range of 200–600 nm. Surface topology and surface roughness of the thin films were obtained by Atomic Force Microscopy (AFM) from Park Systems XE-100 in the non-contact mode, with cantilever tip of 2.8 µm thickness and less than 10 nm tip radius. Light source used was a xenon lamp (200 W) from the solar simulator (US-900) with the intensity of light of 1 Sun (AM 1.5) in the wavelength (
λ
) range from 330 to 800 nm.
Thin film preparation
0.0500 g of N-TiO
2
nano-powder was measured using a microbalance (KERN ALN 120-4n) and mixed with 2 mL of 2% CH
3
COOH solution and ground for 20 min. One drop of Triton-X-100 was added and the mixture was again ground continuously using an agate mortar and pestle. The mixture turned to a slurry paste and this nanosol was ground for another 10 min, until it was ready to cast on the glass slides. It was then pasted on a 1 cm
2
area of a glass slide using the doctor blade method [
23
,
24
]. After the thin films was dried, it was sintered, at 450 °C, for 30 min, using a muffle furnace (Norbertherm-B 180) to remove any organic materials present in the TiO
2
nanoparticles and to have an interconnected matrix of nanoparticles.
Photocatalytic activity
The photocatalytic activities of these semiconductor thin films were determined by measuring the degradation of toluene vapour under illumination using the solar simulator (
US
-
900
) with 1 Sun intensity in the wavelength (
λ
) range in 330–800 nm. The photocatalyst (0.213 g per each plate) was coated on a (1 cm
2
) thin glass plate using the doctor-blade method. The initial volume of toluene added to the modified quartz cell was 2.00 µL. For control test, first, P25-TiO
2
thin film was exposed to toluene vapour in the modified quartz cell and the reaction was carried out in the dark. Then, in the HPD step, P25-TiO
2
thin film was placed as same as in control step. The P25-TiO
2
thin film was exposed to the visible light under identical way. At given time intervals of illumination (5 min per each time interval), the toluene concentration was analysed by a UV–Vis spectrophotometer (
UV
-
3600, Shimadzu, Japan
). When measuring the kinetics of the toluene degradation by N-TiO
2
thin films, the same procedure was followed. The degradation efficiency was calculated using Eq. (
1
).
η(%)=C0-C1C0×100%
The degradation kinetics was measured at static conditions which is prevailing in indoor air. All the experiment trials of VOC degradations were measured with constant volume of 2 μL C
6
H
5
CH
3
and their reaction rates have kept fixed by keeping the constant initial concentration of toluene vapour. The degradation rate was taken as
C
/
C0
, where
C0
is the initial concentration and
C
is the concentration at a given time, and its variation with time is shown in Fig.
4
. Here, the quartz cell covered plastic top also might absorb some amount of C
6
H
5
CH
3
and to prevent this unnecessary absorption; ultrathin aluminium foil was used to cover the plastic top.
Roughness analysis
We reported three main standard statistical parameters to describe the nanostructure of thin film surface: average roughness (
Ra
), root mean squared roughness (
Rq
) and skewness (
Rsk
) [
25
]. For topographical analysis, these parameters were commonly used for understanding the roughness measurements, as well as overall description of the nanoarchitecture of the thin films presented. The degradation rate of toluene vapour has been studied with different thicknesses. A set of experiments using different weighted thin films of N-TiO
2
from 0.71 to 5.00 mg was carried out with initial amount of toluene 2 µL for irradiation of 2 h. Atomic Force Microscope (AFM) from Park Systems XE-100 was used to scan the surface topology of each N-TiO
2
thin films. The amplitude parameters are the principal parameters in characterizing the surface topography. The average roughness (
Ra
) and the root mean square roughness (
Rq
) which were monitored described the surface architecture in vertical dimensions quite well, but offer no insight into the horizontal dimensions of the surface. Skewness (
Rsk
) which gives more descriptive information in horizontal dimensions about the surface structure was also evaluated.
Results and discussion
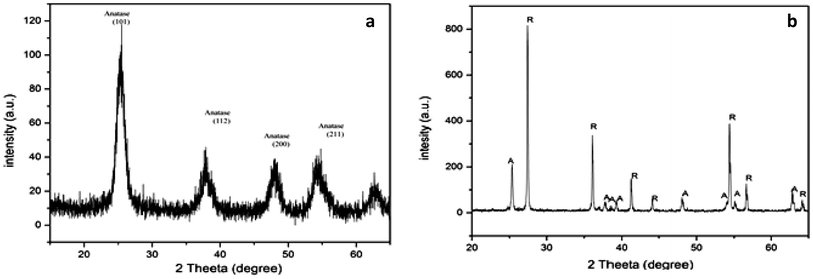
PXRD characterization
Powder X-ray diffractogram of the TiO
2
thin film is shown in Fig.
1
. TiO
2
primarily exists in different phases: anatase and rutile with different band gap values of 3.2 and 3.0 eV, respectively, are the commonest.
Fig. 1
Powder X-ray diffraction patterns of
a
N-doped TiO
2
nanoparticles and
b
P25 TiO
2
nanoparticles (commercial)
P25 is known to have combination of anatase and rutile phases [
26
] which are in the positions (101, 110, 112, 200 and 211) though N-doped TiO
2
shows crystallographic peaks that corresponds only to anatase crystal structure. These Miller Indices are located in 101, 112, 200 and 211 at 2
θ
values of: 25.38°, 38.14°, 48.04° and 55.02°, respectively [
27
]. Mean crystallite size, as analysed by Debye–Scherrer equation, is 55 nm.
UV–visible characterization
According to the Fig.
2
, the band gap energy of N-TiO
2
had been calculated using the Planck’s energy equation [
28
]. A band gap ~ 3.00 eV which is related to the cutoff wavelength of 410.3 nm is obtained for N-doped TiO
2
nanomaterial. Initially, the white powder P25-TiO
2
turned yellow after the N(CH
2
CH
3
)
3
treatment and annealing. N-TiO
2
displayed a strong absorption band at 410.3 nm, which can be attributed to the doped nitrogen in the anatase structure. According to
Lynch
et al. [
29
] doping atoms can be attached to TiO
2
matrix in the substitutional and interstitial modes. Kubelka–Munk transformation provides a conversion of reflectance to Kubelka–Munk (KM) [
30
] units that, under certain circumstances, is directly proportional to the absorbance. The absorption spectrum shows the band gap energy (Fig.
2
) by giving the cutoff wavelength ∼ 410 nm and showing that N-TiO
2
band gap has decreased and hence it can be excited by visible light irradiation for use in photocatalytic degradation processes.
Fig. 2
UV–Visible diffuse reflectance measurement of N-doped TiO
2
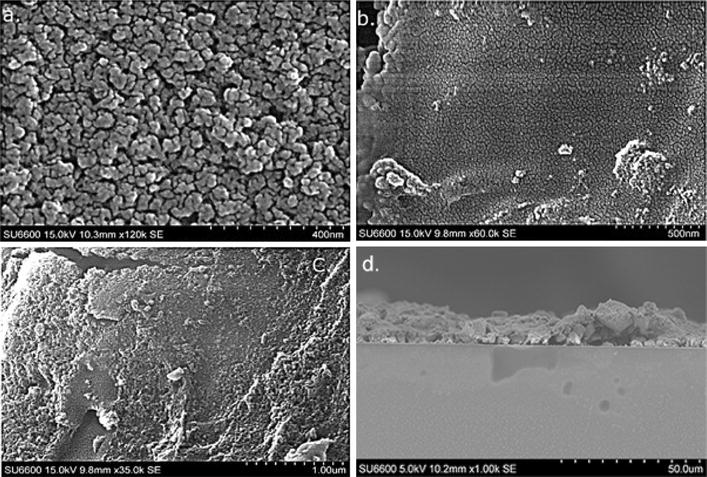
The SEM images of N-TiO
2
nanomaterial at three different magnifications are shown in Fig.
3
. Figure
3
a shows the N-TiO
2
nanomaterial having the majority of spherical granules with average particle size of 40 nm. Nanoparticles which have irregular shapes are scattered on the surface. Powders are smaller aggregated particles, resulting in a high porous volume. Figure
3
d shows the cross-sectional image of the glass substrate and the thin film at 1000 magnification.
Fig. 3
Scanning electron microscopic images of N-TiO
2
thin films under different magnifications;
a
× 120,000,
b
× 60,000,
c
× 35,000 and
d
cross sectional image of the glass substrate and the thin film at × 1000 magnification
Kinetic analysis
In Fig.
4
, line (a) in both graphs a and b, there is a slight reduction of amount of toluene with time. This might be due to the absorption of C
6
H
5
CH
3
by thin film’s nanomaterial or may also be due to leakages or may be due to both. Line (a) in both graphs was taken as control. The reaction under visible light illumination (line: b in Fig.
4
a) shows increased reduction of toluene vapour with time, representing photocatalytic degradation in addition to leakages and adsorptions. The difference of (a) and (b) shows the reduction of toluene by photocatalytic degradation. The HPD of toluene on the N-TiO
2
thin film follows three main stages: (1) the adsorption of C
6
H
5
CH
3
molecules on to the surface of thin coating of N-TiO
2
; (2) formation of OH
•
, O
2•
, HOO
•
and
•
OH which are generally called reactive oxidizing species (ROSs) due to the reaction of electrons in the CB of N-TiO
2
with O
2
in air (3) reactions of these ROSs with toluene and also oxidation of toluene by the holes in the valence band of N-TiO
2
.
Fig. 4
Toluene degradation by P25 TiO
2
(
a
) and
b
N-TiO
2
respectively
a
in the absence of and
b
under illumination of visible light
According to the Fig.
4
, 10% of toluene has degraded by P25-TiO
2
thin film during 185 min. In contrast, 45% degradation of toluene has taken place by N-TiO
2
thin film, during 110 min showing the effectiveness of toluene oxidation by N-TiO
2
when compared to that by P-25.
Effect of the roughness to the heterogeneous photocatalytic degradation (HPD) efficiency
The Photocatalytic degradation rate of toluene vapour has been studied with different thicknesses of photocatalytic films and the results are depicted in Fig.
5
. The degradation rates of toluene for different amounts of N-TiO
2
show that photocatalytic degradation efficiency improved systematically with the amount of N-TiO
2
when the amount of N-TiO
2
in the film is varied from 0.71 to 5.00 mg. When increasing the amount of N-TiO
2
further, the degradation efficiency has also increased but after some optimum thickness, the efficiency decreased, as revealed by the results shown in Table
1
. The thickness of the film containing 1.00 mg of N-TiO
2
is 9.26 µm thickness and it shows the optimum best efficiency of 82.39%.
Fig. 5
a
Effect of N-TiO
2
amount on thin films for toluene vapour degradation and
b
effect of N-TiO
2
thickness on thin films of toluene vapour degradation
Table 1
Information of thickness and efficiency of N-TiO
2
thin films
Sample name
N-TiO2 amount (mg)
Thickness (μm)
Efficiency/η (%)
a
0.71
4.89
42.10
b
0.83
6.38
48.63
c
1.00
9.26
82.39
d
1.25
12.69
64.83
e
1.67
17.35
57.63
f
2.50
23.40
59.91
g
5.00
30.21
39.98
The film:
g
containing 5.00 mg of N-TiO
2
shows the lowest efficiency when compared to the other films. It also reveals that the efficiency increases when the amount of N-TiO
2
in the film is deceased from 5.00 to 1.00 mg. It is possible that when the film is too thick, its particles on the surface get flocculated and agglomerated, thus preventing the penetration of the light into the film. It is likely that the higher the thickness of the layer the more the particles in the film and hence higher is the particle aggregation. As such, the optimum thickness to give high efficiency is the 9.26 μm which has 1.00 mg of N-TiO
2
in the film.
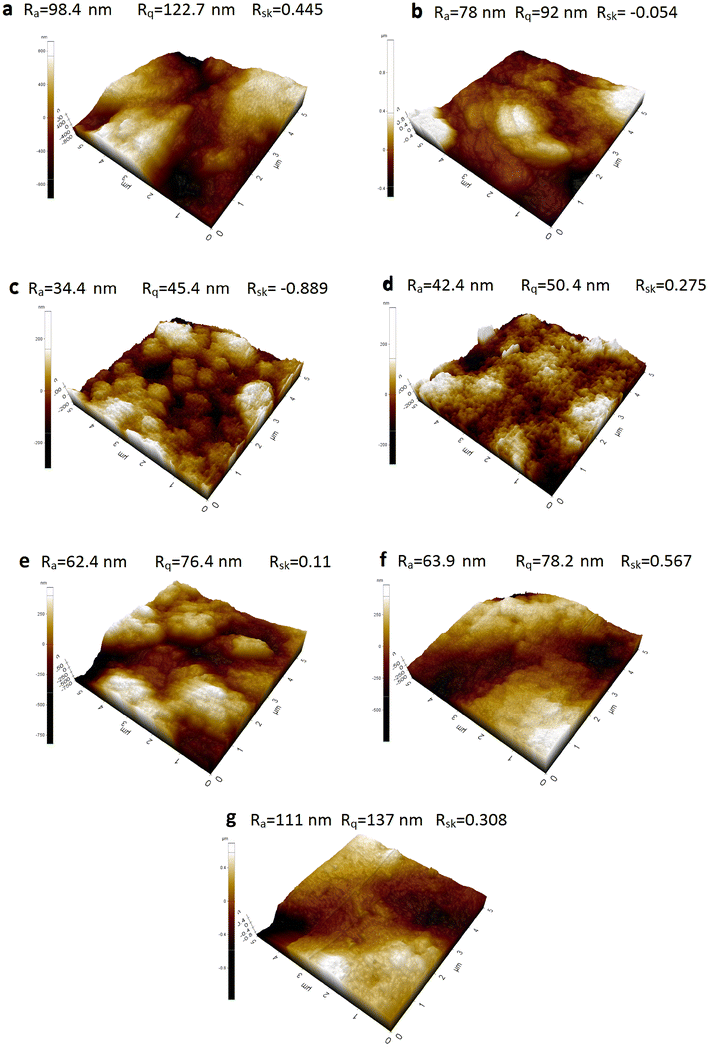
The atomic force microscopic images of N-TiO
2
photocatalytic thin films with different thicknesses are shown in Fig.
6
. The efficiency has shown significant variation with nano-scale roughness of N-TiO
2
thin film and the thin film which has minimum
Ra
(average roughness) value shows the highest efficiency (
η
%) value but other factors such as root mean square (RMS) roughness
Rq
and
Rsk
(skewness) have also effected. When
Ra
values decline, the granules in the surface become smaller and the surface area is significantly increased.
Ra
and
Rq
values are amplitude parameters and are the principle parameters in characterizing the surface topography. Another important functional or statistical parameter is called the skewness (
Rsk
) which gives information about the surface structure.
Rsk
is used to measure the profile symmetry about mean line. Zero
Rsk
indicates the highest symmetrical height distribution. In general, if the height distribution is asymmetrical, and the surface has more peaks than valleys, the skewness moment is positive and if the surface is more planar and valleys are predominant the skewness is negative.
Fig. 6
Three-dimensional AFM images of N-TiO
2
thin film series
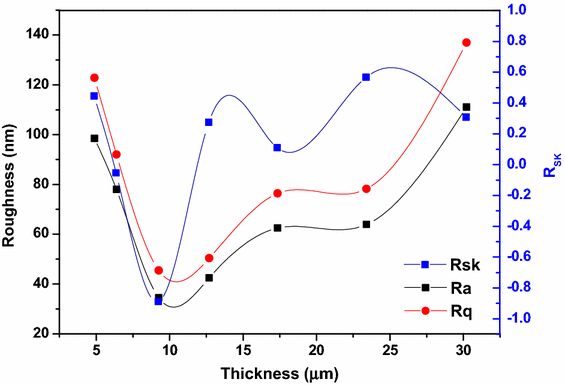
The
Ra
,
Rq
and
Rsk
factors of samples
a
–
g
are illustrated in Fig.
7
. The highest HPD efficiency (
η
%) was found in sample:
c
, which has the smallest amplitude parameters (
Ra
,
Rq
) and also the highest skewness value. It has the smallest granule size in the thin film surface and, consequently, it has the highest surface area to enhance the efficiency (
η
% = 82.39%). The high negative value (
Rsk
= − 0.889) of skewness demonstrates that it has more valleys than peaks and asymmetrical distribution of particles which have collectively benefited to improve the surface area. The minimum efficiency (
η
% = 39.96) is shown by sample
g
which has the highest amplitude parameters (
Ra
= 111 nm,
Rq
= 137 nm) and relatively low skewness (
Rsk
= 0.308). Samples
e
and
f
are almost similar as far as the HPD efficiency is concerned where
η
% are 57.63 and 59.91%, respectively.
Fig. 7
Effect of the amplitude parameters (
Ra
and
Rq
) and skewness (
Rsk
) to the thin film series
Conclusion
We have investigated HPD reaction of toluene by visible light irradiated N-TiO
2
thin films. When TiO
2
nanoparticles doped with nitrogen, their band gap gets significantly decreased and TiO
2
has become visible light responsive. N-TiO
2
thin films were prepared and used to degrade indoor pollutants, namely C
6
H
5
CH
3
, in static air condition. N-doped TiO
2
semiconductor thin films have been shown the higher C
6
H
5
CH
3
degradation rate. N-TiO
2
has high HPD efficiency when compared with P25 standard nanophotocatalyst. The effects of the HPD efficiency of toluene by N-TiO
2
on amount or mass and the thickness of the thin film have been examined and found that the efficiency is first increased when the thickness is increased and then it is decreased. The optimum thickness gives the highest surface area and penetration of light into the film. When the thickness is further increased, agglomeration results in decreasing surface area and preventing light penetration into the film. It was also found that toluene in static air degrades with various efficiencies when the films have multiple roughness. The AFM study reveals that there are some important factors that affect the toluene degradation efficiency. We found that when nanoparticles get smaller in the nanoscopic range, they show improvement of HPD efficiency due to the increment of surface area but the average roughness and other factors such as skewness (
Rsk
) are also important. The asymmetrical distribution of nanoparticles in thin films affects the nano-roughness of the coatings and layers.
Acknowledgements
We would like to thank Ms. Nadeeka Tissera for her contribution in AFM and other studies.
Publisher's Note
Springer Nature remains neutral with regard to urisdictional claims in published maps and institutional affiliations.
References
De Silva et al. (2018) Photocatalytic activity of electrospun MgO nanofibres: synthesis, characterization and applications (pp. 204-210) 10.1016/j.materresbull.2017.10.047
Hashimoto et al. (2005) TiO2 photocatalysis: a historical overview and future prospects 44(12) (pp. 8269-8285) 10.1143/JJAP.44.8269
Zhang et al. (2013) Hydrophilicity, photocatalytic activity and stability of tetraethyl orthosilicate modified TiO2 film on glazed ceramic surface (pp. 141-147) 10.1016/j.apsusc.2012.11.117
Bae et al. (1998) Preparation and thermal stability of doped TiO2 composite membranes by the sol–gel process (pp. 239-245) 10.1016/S0167-2738(98)00100-3
Rzigalinski and Strobl (2009) Cadmium-containing nanoparticles: perspectives on pharmacology and toxicology of quantum dots (pp. 280-288) 10.1016/j.taap.2009.04.010
Park et al. (2011) Indium-free, acid-resistant anatase Nb-doped TiO2 electrodes activated by rapid-thermal annealing for cost-effective organic photovoltaics (pp. 2178-2185) 10.1016/j.solmat.2011.03.021
Yu et al. (2009) An efficient and low-cost TiO2 compact layer for performance improvement of dye-sensitized solar cells (pp. 1319-1324) 10.1016/j.electacta.2008.09.025
Yin et al. (2005) Synthesis of visible-light reactive TiO2−XNY photocatalysts by mechanochemical doping (pp. 1479-1485) 10.1016/j.solidstatesciences.2005.07.004
Chou et al. (2014) Chemical-photo-electricity diagrams by Ohm’s law—a case study of Ni- doped TiO2 solutions in dye-sensitized solar cells (pp. 12-21) 10.1016/j.apenergy.2013.12.012
Tung Lin et al. (2014) Key operating parameters affecting photocatalytic activity of visible-light-induced C doped TiO2 catalyst for ethylene oxidation (pp. 175-183) 10.1016/j.cej.2014.02.085
Tang et al. (2014) Preparation of a Fe-doped visible-light-response TiO2 film electrode and its photoelectrocatalytic activity (pp. 39-45) 10.1016/j.mseb.2014.04.011
Morikawa et al. (2008) Visible-light-induced photocatalytic oxidation of carboxylic acids and aldehydes over N-doped TiO2 loaded with Fe, Cu or Pt (pp. 56-62) 10.1016/j.apcatb.2008.01.034
Zhang et al. (2014) Photocatalytic effects of wool fibers modified with solely TiO2 nanoparticles and N-doped TiO2 nanoparticles by using hydrothermal method (pp. 106-114) 10.1016/j.cej.2014.05.097
Ferrari-Lima et al. (2014) Photodegradation of benzene, toluene and xylenes under visible light applying N-doped mixed TiO2 and ZnO catalysts (pp. 40-46) 10.1016/j.cattod.2014.03.042
Wang et al. (2014) Effective water splitting using N-doped TiO2 films: role of preferred orientation on hydrogen production (pp. 1967-1971) 10.1016/j.ijhydene.2013.11.097
Huang et al. (2012) Low temperature synthesis and photocatalytic properties of highly oriented ZnO/TiO2−xNy coupled photocatalysts 123(124) (pp. 9-17) 10.1016/j.apcatb.2012.04.010
De Silva et al. (2017) Nano-MgO reinforced chitosan nanocomposites for high performance packaging applications with improved mechanical, thermal and barrier properties (pp. 739-747) 10.1016/j.carbpol.2016.10.038
Wijesinghe et al. (2016) Preparation of bone-implants by coating hydroxyapatite nanoparticles on self-formed titanium dioxide thin-layers on titanium metal surfaces (pp. 172-184) 10.1016/j.msec.2016.02.053
Wijesinghe et al. (2017) Urea-assisted synthesis of hydroxyapatite nanorods from naturally occurring impure apatite rocks for biomedical applications (pp. 24806-24812) 10.1039/C7RA02166F
Wu and Long (2011) Realizing visible-light-induced self-cleaning property of cotton through coating N-TiO2 film and loading AgI particles (pp. 4770-4774) 10.1021/am201251d
Li et al. (2005) A novel nanocrystalline TiO2 thin film electrodes prepared at low temperature 16(7) (pp. 967-970)
Özdal et al. (2012) A comparative study on TiO2 doped hybrid solar cells (pp. 5259-5264) 10.1016/j.apsusc.2012.02.009
Webb et al. (2012) Roughness parameters for standard description of surface nanoarchitecture (pp. 257-263) 10.1002/sca.21002
Girginov et al. (2012) Silver doped TiO2 photocatalyst for methyl orange degradation 5(4) (pp. 14-17)
Kim et al. (2002) Photocatalytic degradation of volatile organic compounds at the gas–solid interface of a TiO2 photocatalyst (pp. 437-444) 10.1016/S0045-6535(02)00101-7
Fasakin et al. (2013) Synthesis and characterization of metal organic chemical vapour deposited copper titanium oxide (Cu–Ti–O) thin films from single solid source precursor (pp. 1-6) 10.4236/jmp.2013.412A3001
Lynch et al. (2015) Substitutional or interstitial site-selective nitrogen doping in TiO2 nanostructures 119(13) (pp. 7443-7452) 10.1021/jp512775s
Klanjšek Gunde et al. (1995) Application of the Kubelka–Munk theory to thickness-dependent diffuse reflectance of black paints in the Mid-IR (pp. 623-629) 10.1366/0003702953964165