Department of Chemistry, Manipur University, Imphal Manipur, 795003, IN
Abstract
Self-assembled CaWO
4
:Sm
3+
microspheres were prepared via surfactant (sodium dodecyl sulfate) mediated hydrothermal method. The effect of pH and the concentration of surfactant on the morphology and photoluminescence of the synthesized phosphors have been studied. Samples were characterized by X-ray diffractometry (XRD), scanning electron microscopy (SEM), transmission electron microscopy (TEM) and photoluminescence spectroscopy. The microspheres were found to have an average size of 1–2 µm. They were mesoporous in nature and constituted of nanocrystals of about 10–30 nm dimension. The TEM images revealed the interlinking framework of the nano-sized constituents which consequently lead to the formation of mesoporous microspheres. The lowering of pH causes a slight reduction in the size of microspheres which could have been attributed to loss of OH from the nanoparticle surface and subsequent retardation in the adsorption of growing molecular CaWO
4
:Sm
3+
units. Also, as pH increases, crystallinity decreases. The increase in amount of SDS reduced the crystallinity of the materials, destroyed the monodispersity of microspheres and lowered the luminescence output. It was found that lower pH and higher monodispersity of microspheres are quite favourable for high luminescence output.
Introduction
The synthesis and fabrication of nano- or microstructures with uniformly well-defined size and morphology is highly important. The physicochemical properties of nanomaterials depend on their size and shape [
1
,
2
–
3
]. The frequency of active centres on the exposed facets and the surface energy of nanostructures could induce many novel nanoscale effects and provides technological potentials. For instance, under UV excitation, ellipsoid β-Ga
2
O
3
:Dy exhibits higher emission intensity and quantum yield compared to spindles or microspheres [
4
]. The luminescence intensity of 1-μm hexagonal NaYF
4
:Yb,Er is weaker than that of 80-nm cubic spherical samples [
5
]. The weak intensity of luminescence has been attributed to the presence of non-radiative traps. Spherically fine phosphor microparticles also show high luminescence yield as a result of efficiently high packing densities and low light scattering [
6
].
Alkaline earth tungstates (AWO
4
; A = Ca, Sr, Ba) has been extensively studied as luminescent hosts, scintillation detectors, optoelectronics, lasers and catalysis [
7
,
8
,
9
–
10
]. In photoluminescence, tungstate has been gaining interest due to its physical and chemical stability, low phonon threshold energy, wide band gap semiconducting nature and intrinsic blue emission. The WO
4
group can generate blue emission (≈420 nm) on absorption of ultraviolet (UV) radiation mostly in the short wavelength region. This intrinsic blue emission arises from charge transfer transitions between O 2p → W 5d states within the WO
4
unit. The blue emission can be harnessed for alteration of luminescent properties by doping with rare earth (RE) ions since most of the RE ions can be absorbed in the blue region.
CaWO
4
phosphors are synthesized by several methods such as co-precipitation, solid state reaction, hydro/solvothermal (conventional and microwave), electrospinning, spray pyrolysis, sol–gel route, and pulsed-laser deposition. Of these methods, hydrothermal method is proven to be a promising one for the synthesis of low- and high-order novel architectural designs of nanomaterials through a well-controlled manipulation of appropriate reaction parameters such as temperature, time of hydrothermal ageing, pH of reaction, surfactants or other templates [
11
,
12
–
13
]. It has an added advantage of relatively low-temperature growth and size-controlled synthesis. Certain reports have been made on the importance of surfactants and polymers such as sodium dioctyl sulfosuccinate (AOT), polyethylene glycol (PEG), polypeptides in the self-assembly and morphology control of nano- or micro-dimensional materials [
14
,
15
,
16
–
17
]. Nanotubes and hollow microspheres with high monodispersity can be synthesized using surfactant as soft template via microwave-assisted or conventional hydrothermal method.
In this work, 5 at.% Sm
3+
-doped CaWO
4
(hereafter CaWO
4
:Sm
3+
) microspheres were synthesized by conventional hydrothermal method in the presence of sodium dodecyl sulphate (SDS). The effect of variation of pH of the reaction medium and surfactant concentration on the morphology and photoluminescence of the phosphor materials has been studied. The mode of assembly and the size variation of the microspheres have been found to influence the luminescence properties.
Experimental details
Materials
All chemicals of analytical grades were used as received without further purification. Calcium nitrate tetrahydrate [Ca(NO
3
)
2
·4H
2
O, Himedia, 99% pure], sodium tungstate dihydrate (Na
2
WO
4
·2H
2
O, Sigma-Aldrich, 99.995% pure), samarium nitrate hexahydrate [Sm(NO
3
)
3
·6H
2
O, Sigma-Aldrich, 99.9% pure], sodium dodecyl sulphate (C
12
H
23
SO
4
Na, Sigma-Aldrich, 98.5% pure) were used for the synthesis. Double-distilled water was used as the solvent and reaction medium.
Synthesis of CaWO4:Sm3+ microspheres
In a typical synthesis, 25 mL of 0.02 M SDS solution was mixed with 25 mL of solution containing 0.19 M Ca(NO
3
)
2
·4H
2
O and 0.01 M Sm(NO
3
)
3
·6H
2
O such that the Ca:Sm atomic ratio is 95:5. The mixture was stirred for homogenous complexation of the metal ions with the SDS molecules. To the complex mixture, 25 mL of 0.2 M Na
2
WO
4
·2H
2
O solution was added with constant stirring for an hour to achieve thorough mixing and complete precipitation. The whole mixture was then transferred to a Teflon-lined autoclave and kept in the pre-heated oven at 150 °C for 3 h. The autoclave was then removed and cooled to room temperature. The products were collected by centrifugation, washed with water and acetone. Finally, the products were dried at 40 °C for further analysis. The pH of the reaction was adjusted by addition of NaOH (1 mol L
−1
) or HCl (1 mol L
−1
). For the samples prepared at different SDS concentrations, i.e. 50 and 100 mM, the pH is adjusted to 9. The samples prepared at different pH and 25 mM SDS concentration are labelled as 3H25, 5H25, 7H25, 9H25 and 11H25 corresponding to pH 3, 5.2, 7, 9 and 10.8. The samples prepared at 50 and 100 mM SDS (pH 9) are labelled as 9H50 and 9H100.
Scanning electron microscope (SEM FEI Quanta 250) operating at accelerating voltage of 20 kV was used to record the morphology of the synthesized samples and transmission electron microscope (TEM JEOL JEM-2100, Japan available at SAIF, NEHU) operating at 200 kV was used for studying the shape and size of the materials. For SEM, samples were sputter coated and dispersed uniformly on a carbon grid. For TEM, powder samples were dispersed in methanol under ultrasonication for an hour. A drop of the dispersed particles was put over the carbon-coated copper grid and evaporated to dryness at room temperature. It was mounted inside the sample chamber. The photoluminescence spectra were recorded using Perkin Elmer LS55 spectrophotometer.
Results and discussion
XRD study
Figure
1
shows the XRD patterns of CaWO
4
:Sm
3+
crystals obtained at different pH and varied surfactant concentration in the range of 10°–60° in 2
θ
. Eventually, the CaWO
4
:Sm
3+
crystals have scheelite type tetragonal structure in accordance with the standard diffraction data for bulk CaWO
4
(JCPDS No. 77-2233). The results indicate that the CaWO
4
:Sm
3+
samples are crystalline and free from impurity phases. The absence of impurity phases indicates the successful doping of Sm
3+
ions in the CaWO
4
lattice. Further, the change in pH or the varied surfactant concentration has no adverse effect on the crystal phases. The cell parameters were calculated to be
a
=
b
= 5.252 Å,
c
= 11.371 Å and the unit cell volume,
V
= 313.68 Å
3
. The crystallite size calculated using the Scherer’s formula corresponding to the diffraction peak of plane (112) was found to be 15–20 nm. Comparative studies of the intensities of the (112) diffraction peaks with the change of pH and surfactant concentration have been shown in Fig.
2
a, b. In Fig.
2
a, it was observed that the intensity of the (112) diffraction peak was decreased with the increase in pH of the reaction medium. This indicated that the crystallinity of the samples was lowered with the increase in pH of the medium. In Fig.
2
b, it was observed that the sample prepared at an increasing amount of SDS has lower diffraction intensity. Thus, the crystallinity of the samples was lowered with the increasing SDS concentration. Meanwhile, the sample prepared at higher 100 mM SDS concentration showed a slight shift of (112) diffraction peak towards larger 2
θ
angle.
Fig. 1
XRD patterns of the CaWO
4
:Sm
3+
samples:
a
3H25,
b
7H25,
c
9H25,
d
9H50 and
e
9H100
Fig. 2
XRD patterns showing the change in crystallinity of CaWO
4
:Sm
3+
with
a
change pH,
b
concentration of SDS
SEM and TEM study
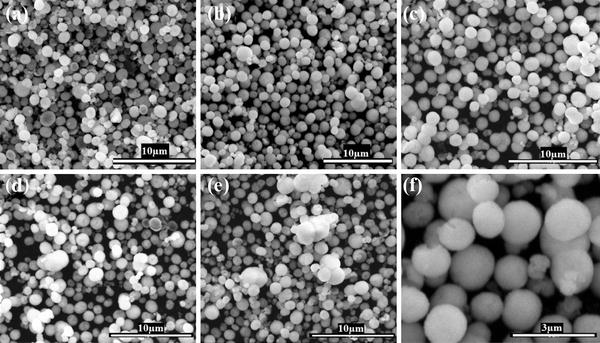
The SEM images of the CaWO
4
:Sm
3+
samples prepared at different pH are shown in Fig.
3
a–f. All the samples have spherical morphology with size less than or equal to 2 µm. The size of the microspheres seemed to become slightly larger with the increasing pH of the reaction medium. However, the monodispersity of the samples prepared at pH 5 and 7 is quite high compared to other samples. Below pH 4, the CMC is decreased [
18
]. As a result of which, the number of SDS per micelle is decreased and the number of Ca
2+
as counter-ions in the Stern layer attaching to the polar head of SDS will be decreased. When the WO
42−
ions approach the Ca ions, only fewer units of CaWO
4
molecules will be formed and merged to obtain CaWO
4
:Sm
3+
nano-/micro-crystals. Above pH 4, the CMC of SDS does not change at all. This is why the CaWO
4
microspheres prepared at pH 3 has smaller size compared to that at pH 5 (absence of HCl and NaOH). At pH 7 and higher, the increasing number of OH
−
ions from NaOH will influence the growth of microspheres. The OH
−
ions will get attached to the surface of the CaWO
4
:Sm
3+
. This explains the growth of slightly larger microspheres at high pH. In Fig.
4
a–f, the SEM images of the samples prepared at different SDS concentrations with pH being 9 are shown. It is quite obvious that particles tend to grow in size randomly as well as the monodispersity is destroyed with increasing surfactant concentration. Larger particles and aggregates of smaller particles were also formed. The change in shape of the CaWO
4
:Sm
3+
particles have been attributed to the change of micellar structure of SDS at different concentrations arising from the intermicellar interactions. Larger micelles could also be formed due to the stronger hydrophobic interactions. That is why the CaWO
4
:Sm
3+
particles prepared at higher SDS concentrations are larger and aggregated particles are obtained.
Fig. 3
SEM images of CaWO
4
:Sm
3+
samples:
a
3H25,
b
5H25,
c
7H25,
d
9H25,
e
11H25 and
f
magnified 5H25
Fig. 4
Low- and high-magnification SEM images of (
a
,
b
) 9H25, (
c
,
d
) 9H50, (
e
,
f
) 9H100
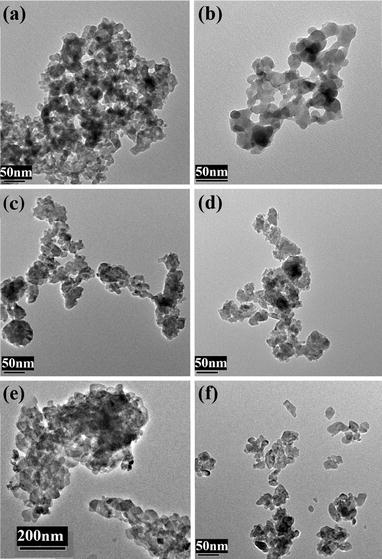
The TEM analysis gives further insight into the morphological construction of the microspheres. Figure
5
a–f shows the TEM micrographs of samples prepared at pH 9 and 11 (at 25 mM SDS) and at 100 mM (pH 9). The TEM images have shown that 9H25 and 11H25 do not contain particles of uniform dimensions in the nanometer regime. They rather have intertwined or interconnected framework of nanodimensional particles. However, the particles of 11H25 assume a more reasonable shape and size although they exist in aggregates. Roughly, the particles have size in the range of 15–30 nm. Thus, it is quite obvious that the microspheres so formed are aggregates or self-assembled from nanodimensional units and mesoporous in nature. While the sample 9H100 consists of rather granular nanoparticles with size ranging from 10 to 30 nm. Hence, it can be concluded that higher pH and higher SDS concentration are not favourable for formation of assembled mesoporous microspheres.
Fig. 5
TEM images of CaWO
4
:Sm
3+
samples: (
a
,
b
) 9H25, (
c
,
d
) 11H25, (
e
,
f
) 9H100
Photoluminescence study
A typical photoluminescence excitation spectrum of CaWO
4
:Sm
3+
microspheres is shown in Fig.
6
. In WO
42−
groups, ligand to metal charge transfer (LMCT) occurs by excitation of electrons from the O 2p states to W 5d states to yield the excitation band at 240 nm [
19
]. The low intense excitation peaks in the region of 300–450 nm corresponds to the f–f transition of Sm
3+
. The exhibition of the LMCT of WO
42−
group in the excitation spectrum when monitoring emission at 645 nm (Sm
3+
emission) indicates an energy transfer from WO
42−
groups to the activator ion (Sm
3+
) [
20
]. The photoluminescence properties of the self-assembled microspheres were studied under UV excitation at 240 nm as shown in Fig.
7
. It is obvious that the activator Sm
3+
ions exhibit their characteristic emission in the material as a result of energy transfer from WO
42−
host to them. The four emission bands at 565, 600, 645 and 707 nm correspond to
4
G
5/2
→
6
H
5/2
,
6
H
7/2
,
6
H
9/2
and
6
H
11/2
transitions in Sm
3+
ions [
21
]. According to Judd–Ofelt theory, the electric dipole transitions occur between energy levels differing in ΔJ by more than one unit (as much as six units in some cases) and the emission centre should not be situated at a centre of inversion [
22
,
23
]. The predominance of the electric dipole transition
4
G
5/2
→
6
H
9/2
(Δ
J
= 2) (which is not commonly observed in other hosts) is due to removal of inversion centre in SmO
8
clusters.
Fig. 6
PL excitation spectra of 9H25 CaWO
4
:Sm
3+
microspheres monitoring emission at 645 nm
In Fig.
7
a, the dependence of luminescence intensity with pH of the reaction medium is shown. It is observed that the intensity has an inverse relationship with pH. This can be attributed to the decrease of luminescent quencher –OH and increasing crystallinity as the pH decreases. It is observed from the XRD pattern in Fig.
2
that the crystallinity of the constituent nanodimensional particles increases with decreasing pH of the reaction medium. Hence, the increasing crystallinity could be a reason for luminescence enhancement [
24
]. During the recombination process in insulators, thinly populated non-stoichiometric defects often occur at the surface of oxide materials as the electrons and holes tend to diffuse through the material towards the surface [
25
]. In CaWO
4
materials prepared by hydrothermal methods, defect-related radiative and non-radiative relaxation channels co-exist in the crystals. The competition between these relaxation channels affect luminescence [
26
]. If the excited emission centre is in the vicinity of the non-radiative channel (quenching centre), the luminescence efficiency is weakened [
5
]. Such quenching centres are highly populated in samples of low crystallinity. This further added an explanation to increased emission intensity of the hydrothermally prepared samples with increasing crystallinity.
Fig. 7
PL emission spectra of CaWO
4
:Sm
3+
samples prepared at
a
25 mM SDS with varying pH and
b
pH 9 with varying SDS amount. The samples are excited at 240 nm
In Fig.
7
b, the emission spectra of CaWO
4
:Sm
3+
samples prepared at different SDS concentrations are shown. The emission intensity is found to decrease with the increasing amount of SDS in the preparation. Several reasons for this observation could be decrease in crystallinity, organic quenching and non-uniform self-assembly of CaWO
4
:Sm
3+
particles. The crystallinity is decreased with the increasing amount of SDS in the reaction medium. Also, adsorption of organic chain onto the particles assembly could serve as a source of energy sink where it is used up in the vibrational relaxation. Further, the uniform self-assembly with quite high monodispersity apparently lowers the surface to volume ratio and hence the surface energy of the nanocrystals. This could reduce the non-radiative channels in the luminescence [
27
]. But in this case, monodispersity is destroyed and self-assembly turns out to be non-uniform with increasing SDS concentration. Hence, these factors are accountable for decreasing emission intensities. Altogether, the mode of self-assembly and morphology could induce variation in packing densities and the amount of light scattered as a result of which emission intensities vary with pH and surfactant concentration.
Conclusions
In summary, this work presents the successful synthesis of CaWO
4
:Sm
3+
microspheres via conventional hydrothermal method using SDS as soft template. Highly monodipersed CaWO
4
:Sm
3+
microspheres were obtained at different pH and 25 mM SDS concentration. The pH range of 5–7 is found to be quite favourable for highly monodipersed microsphere formation. However, higher concentration of SDS decreased the monodispersity of microsphere and crystallinity. The microspheres are found to be mesoporous in nature with the constituting nanodimensional units having the size of 10–30 nm as revealed from the micrographs of SEM and TEM. Since the CMC of SDS does not vary much with increase of pH, all samples prepared at different pH have almost the same size. While the samples prepared at different concentration of SDS have change in the shape. This could be attributed to the change of micellar structure of SDS in the solution. The lowering of crystallinity of the samples has also been determined by the mechanism of self-assembly in the micellar structure of SDS. All the samples showed pink-red emission upon excitation at 240 nm. The emission intensities of the CaWO
4
:Sm
3+
microspheres decrease with higher pH and higher SDS concentration. The monodispersity index can be a factor in luminescence yield as observed from the emission intensity of CaWO
4
:Sm
3+
microspheres prepared at different SDS concentration. Beside these, the mode of self-assembly and morphology can be an indispensable factor controlling luminescence output. Hence, this work represents a simple method to design the synthesis of self-assembled microspheres.
Acknowledgements
Goutam S. N. is grateful to University Grants Commission (UGC, New Delhi) for providing Senior Research Fellowship. The authors acknowledged Physics Department, Manipur University for XRD and SEM facility; SAIF, NEHU, Shillong for TEM facility.
References
Burda et al. (2005) Chemistry and properties of nanocrystals of different shapes (pp. 1025-1102) 10.1021/cr030063a
Yang et al. (2008) Anatase TiO2 single crystals with a large percentage of reactive facets (pp. 638-642) 10.1038/nature06964
Longo et al. (2011) A joint experimental and theoretical study on the nanomorphology of CaWO4 crystals (pp. 20113-20119) 10.1021/jp205764s
Li et al. (2010) Shape-controllable synthesis and morphology-dependent luminescence properties of GaOOH:Dy3+ and β-Ga2O3:Dy3+ (pp. 1449-1457) 10.1021/ic901682x
Sun et al. (2007) Controlled synthesis and morphology dependent upconversion luminescence of NaYF4:Yb, Er nanocrystals10.1088/0957-4484/18/27/275609
Grasser et al. (1982) On the intrinsic nature of the blue luminescence in CaWO4 (pp. 263-272) 10.1016/0022-2313(82)90004-7
Nikl et al. (2000) Excitonic emission of scheelite tungstates AWO4 (A = Pb, Ca, Ba, Sr) (pp. 1136-1139) 10.1016/S0022-2313(99)00569-4
Mikhailik et al. (2004) One- and two-photon excited luminescence and band-gap assignment in CaWO410.1103/PhysRevB.69.205110
Cooper and de Leeuw (2003) A combined ab initio and atomistic simulation study of the surface and interfacial structures and energies of hydrated scheelite: introducing a CaWO4 potential model (pp. 159-176) 10.1016/S0039-6028(03)00362-5
Guan et al. (2008) Facile preparation method for rare earth phosphate hollow spheres and their photoluminescence properties (pp. 8280-8283) 10.1021/la800789x
Lu et al. (2010) Remarkably enhanced photoluminescence of hexagonal GdPO4·nH2O: Eu with decreasing size10.1088/0957-4484/21/36/365709
Chao et al. (2013) Hydrothermal synthesis of ferroelectric PbTiO3 nanoparticles with dominant 001 facets by titanate nanostructure (pp. 8036-8040) 10.1039/c3ce41248b
Chen et al. (2004) AOT-microemulsions-based formation and evolution of PbWO4 crystals (pp. 11280-11284) 10.1021/jp0377681
Nguyen et al. (2011) Biomolecule-assisted route for shape-controlled synthesis of single-crystalline MnWO4 nanoparticles and spontaneous assembly of polypeptide-stabilized mesocrystal microspheres (pp. 1450-1460) 10.1039/C0CE00091D
Wang et al. (2008) Controlled synthesis of calcium tungstate hollow microspheres via ostwald ripening and their photoluminescence property (pp. 19390-19398) 10.1021/jp8074783
Chen et al. (2003) Solvothermal synthesis and characterization of crystalline CaWO4 nanoparticles (pp. 361-365) 10.1016/S0022-0248(03)01089-3
Rahman and Brown (1983) Effect of pH on the critical micelle concentration of sodium dodecyl sulphate (pp. 1331-1334) 10.1002/app.1983.070280407
Shi et al. (2008) Spectroscopic properties and intense red-light emission of (Ca, Eu, M)WO4 (M = Mg, Zn, Li) (pp. 396-399) 10.1016/j.saa.2007.04.012
Jia et al. (2006) Sol–gel synthesis and characterization of SiO2@ CaWO4, SiO2@ CaWO4:Eu3+/Tb3+ core–shell structured spherical particles (pp. 734-742) 10.1088/0957-4484/17/3/020
Ofelt (1962) Intensities of crystal spectra of rare earth ions (pp. 511-520) 10.1063/1.1701366
Zhai et al. (2006) Preparation of crystalline CaWO4 thin films by chemical bath deposition (pp. 647-651) 10.1016/j.jcrysgro.2005.12.062
Benitez et al. (1991) A surface recombination model applied to large features in inorganic phosphor efficiency measurements in the soft x-ray region (pp. 3256-3260) 10.1063/1.350331
Spassky et al. (2012) Luminescence and energy transfer mechanisms in CaWO4 single crystals (pp. 2753-2762) 10.1016/j.jlumin.2012.05.028
Shanta et al. (2012) Re-dispersion and film formation of GdVO4: Ln3+ (Ln3+ = Dy3+, Eu3+, Sm3+, Tm3+) nanoparticles: particle size and luminescence studies (pp. 4404-4412) 10.1039/c2dt12190e