Young Researchers and Elite Club, East Tehran Branch, Islamic Azad University, Tehran, IR
Department of Chemistry, Shahr-e-Qods Branch, Islamic Azad University, Tehran, IR
Department of Chemistry, Science and Research Branch, Islamic Azad University, Tehran, IR
Department of Chemistry, Shahid Beheshti University, Tehran, IR
Abstract
In this study of ethidium bromide, adsorption from aqueous matrices by graphene oxide as adsorbent was investigated. Influencing parameters in the adsorption study included contact time, temperature, and pH. The optimum time was selected 17 min, and the best value of pH was determined at 8. All adsorption experiments were performed at 298 K temperature. The maximum wavelength of ethidium bromide was 475 nm. The Elovich, four types of the pseudo-second-order, the pseudo-first-order, and intra-particle diffusion kinetic adsorption models were used for kinetic study, and the results show that adsorption of ethidium bromide on graphene oxide surface best complied with type (I) of the pseudo-second-order kinetic model.
Introduction
Ethidium bromide (EtBr) is a potent mutagen and a toxic chemical [
1
]. It is also one intercalating common agent employed as a tag of fluorescent (nucleic acid stain) in laboratories of molecular biology for techniques, such as agarose gel electrophoresis [
2
]. Because the unique structure of EtBr resembles DNA, it can easily intercalate into DNA strand. Therefore, in the life science field, it is commonly used as nucleic acid fluorescent tag in various techniques.
Graphene is the thinnest known material, i.e., a sheet of carbon atoms could be arranged in hexagonal cells of only a single atom thick and yet be stronger than diamond [
3
]. Since it was experimentally isolated in 2004, it has been the object of intense theoretical and experimental research [
4
,
5
]. Graphene oxide (GO) is similar to graphene, but presents oxygen-containing functional groups [
5
–
8
].
Recently, many studies have been done on the absorption process and have been compared with classical adsorbents, such as CNTs [
9
,
10
], clay [
11
], activated carbon [
12
], graphene, and graphene derivatives, such as graphene oxide [
13
]. Graphene and graphene derivatives are more attractive recently because of their high selectivity, favorable physicochemical stability, and structural diversity. Extensive experiments have been conducted on the adsorption of organic or inorganic contaminants on graphene and graphene derivatives, such as Formaldehyde Molecule [
14
], Uranium(VI) [
15
], 1-naphthol [
16
], dyes [
17
], and adsorption of Pb(II) and Hg(II) [
18
]. Therefore, graphene and graphene derivatives might be good sorbents for the removal of contamination from water.
In this work, adsorption process was carried out for 17 min, 298 K, and pH 8 for removal ethidium bromide (EtBr) from aqueous matrices by graphene oxide (GO) surface as adsorbent from aqueous matrices. Adsorption of ethidium bromide on graphene oxide surface was interpreted well by type (I) of the pseudo-second-order kinetic model.
Materials and methods
Materials
Ethidium bromide (EtBr) (C
21
H
20
BrN
3
) used here was procured from Sigma-Aldrich Co. at 95% purity, and molecular weight was 394.31. NaOH and HCl were used to regulate the pH of the samples. The single-layer graphene oxide was prepared from Graphene Supermarket, (USA) with the following specifications: aqueous dispersion: concentration: 500 mg/L, 175 ml; composition: carbon (79%), oxygen (20%), flake size: 0.3–0.7 lm; thickness: 1 atomic layer–at least 80%; and brown color in all adsorption experiments as adsorbent. Specific surface area is determined to be 133 m
2
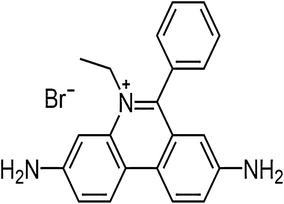
/g (see Fig.
1
).
Fig. 1
Structure of ethidium bromide (EtBr)
Preparing GO surface
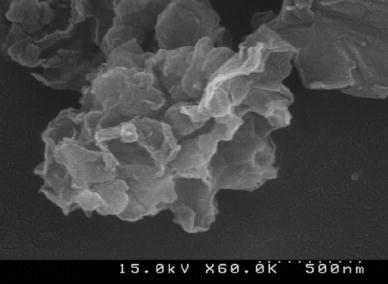
Graphene oxide was prepared from Graphene Supermarket, USA, and scanning electron microscopy of microstructures of GO surface used in this work is shown in Fig.
2
.
Fig. 2
SEM image of graphene oxide surface prepared from graphene Supermarket, (USA)
Adsorption process study
Adsorption experiments were performed by adding 0.5 mg of graphene oxide (GO) surface as adsorbent into 20 mL of ethidium bromide (EtBr) solutions with known concentrations of 0.5 mg L
−1
. The samples were collected, and the concentration of ethidium bromide in the aqueous matrices was determined after a specified period of time at 2, 5, 8, 11, 14, 17, and 20 min by applying the spectrophotometer of UV–VIS (Thermo Electron Corporation, Aquamate) at 475 nm, respectively. Thereupon, to study adsorption kinetic parameter (
qt
), in mg/g, for ethidium bromide at time
t
Eq. (
1
) was used [
19
].
qt=C0-CtW×V,
where
C0
(mg L
−1
) was the initial ethidium bromide concentration,
Ct
(mg L
−1
) was the ethidium bromide concentration at time
t
,
qt
(mg/g) was ethidium bromide adsorption capacity at time
t
,
W
(g) was adsorbent mass, and
V
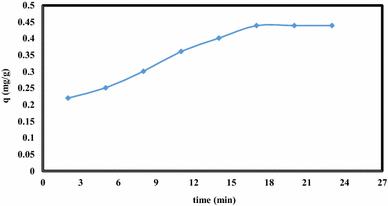
(L) was the volume of ethidium bromide solution. Adsorption time curve for removal of ethidium bromide by GO as adsorbent is shown in Fig.
3
.
Fig. 3
Contact time effect of the adsorption ethidium bromide onto GO surface as adsorbent, initial concentration: 0.5 mg L
−1
; dosage of adsorbent: 0.5 mg; temperature: 298 K and pH: 8
The graphene oxide adsorption experiments were performed using the batch technique to determine the ethidium bromide adsorption capacity. After 17 min, no noticeable change was observed in the amount of absorption capacity of EtBr on the GO surface as adsorbent. Therefore, 17 min was selected as optimum time for removal of ethidium bromide by graphene oxide surface as adsorbent in all adsorption experiments.
Result and discussion
GO characterizations
Graphene oxide surface was prepared from (Graphene Supermarket, USA), and scanning electron microscopy of microstructures of GO surface used here is presented in Fig.
2
.
The effect of pH
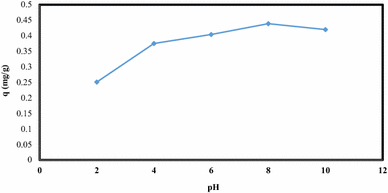
Removal of ethidium bromide from solution by graphene oxide adsorbent was carried out at 17 min as optimum time at temperature 298 K, and to also for find the optimum value of pH, experiments of ethidium bromide adsorption onto graphene oxide surface were performed at different pH values from 2 to 10. With increasing the initial pH value of solution from 2 to 8, removal of EtBr by GO surface as adsorbent increased, and maximum amount of adsorption of (EtBr) on (GO) surface was at pH 8. Then, as shown in Fig.
4
, with increasing initial pH value of solution from 8 to 10, (EtBr) removal by (GO) surface decreased.
Fig. 4
Effect of pH on the adsorption ethidium bromide onto GO surface as adsorbent, initial concentration: 0.5 mg L
−1
; dosage of adsorbent: 0.5 mg; temperature: 298 K and pH: 8
Adsorption kinetics study
Adsorption kinetics experiments were conducted to obtain the resulting kinetic parameters and to investigate the effects of contact time. Figure
3
presents the variation in the adsorption of ethidium bromide by graphene oxide surface as adsorbent and as a function of contact time. It was noticed that after 17 min, no noticeable change was observed in the amount of absorption capacity of EtBr on the GO surface as adsorbent. Therefore, 17 min was selected as optimum time for removal of ethidium bromide by graphene oxide surface as adsorbent in all adsorption experiments. The adsorption kinetics of ethidium bromide was plotted using the Elovich, four types of the pseudo-second-order, the pseudo-first-order, and the intra-particle diffusion kinetic models.
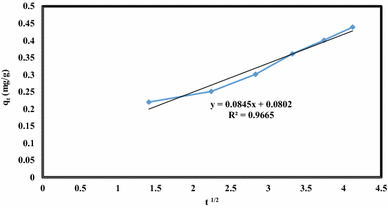
The intra-particle diffusion kinetic model
For kinetic study, the constant rate for intra-particle diffusion is given by [
20
]:
Qt=ki(t)1/2+C,
where ‘
Qt
’ (mg/g) was the amount of ethidium bromide adsorbed on graphene oxide surface at different times
t
;
C
(mg/g) was a constant for the intra-particle diffusion model that gives an idea about the thickness of the boundary layer, and ‘
k
’ (mg/g min
1/2
) was the intra-particle diffusion rate constant [
21
], determined by plotting. Figure
5
shows
qt
versus plot
t1/2qt
.
Fig. 5
Intra-particle diffusion adsorption kinetic of ethidium bromide on GO adsorbent. Conditions: initial concentration: 0.5 mg L
−1
; dosage of adsorbent: 0.5 mg; temperature: 298 K and pH: 8
The Elovich kinetic model
At kinetic study the Elovich model is generally expressed as equation [
22
]:
dqtdt=αexp(-βq2).
Elovich model liner form is expressed as Eq. (
4
) [
22
,
23
]:
Qt=1βln(αβ)+1βlnt,
where ‘
β
’(g/mg) was the extent of surface coverage, ‘
Qt
’(mg/g) was the amount of ethidium bromide adsorbed on graphene oxide surface at different times
t
, and ‘
α
’ (mg/g min) was the initial adsorption rate. The intercept and slope at the linear relationship of the plot of
qt
versus ln
t
were used to determine
α
and
β
. Figure
6
shows the plot of
qt
versus ln
t
.
Fig. 6
Elovich adsorption kinetic of ethidium bromide on GO adsorbent. Conditions: initial concentration: 0.5 mg L
−1
; dosage of adsorbent: 0.5 mg; temperature: 298 K and pH: 8
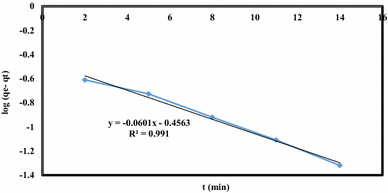
The pseudo-first-order kinetic model
In general, at kinetic studies, the pseudo-first-order kinetic model equation is expressed as [
24
–
26
]
dqtdt=k1(qe-qt).
The integrated form of the pseudo-first-order kinetic model equation is as [
27
]
log(qe-qt)=log(qe)-k1t,
where
qe
and
qt
were the amounts of ethidium bromide removed by graphene oxide adsorbent at equilibrium and
t
time, respectively.
k1
was the constant rate. By plotting values of log (
qe
−
qt
) versus
t
,
qe
and
k1
can be determined from the intercept and slope, respectively. Figure
7
shows the plot of log (
qe
−
qt
) versus
t
.
Fig. 7
Pseudo-first-order kinetic of ethidium bromide on GO adsorbent. Conditions: initial concentration: 0.5 mg L
−1
; dosage of adsorbent: 0.5 mg; temperature: 298 K and pH: 8
The pseudo-second-order kinetic model
In general, at kinetic studies, the pseudo-second-order kinetic model equation is expressed as Eq.
7
presented by Ho in 1995 demonstrated how the rate depended on the adsorption equilibrium capacity [
28
,
29
]:
dqtdt=k(qe-qt)2.
An integrated pseudo-second-order rate can be obtained from Eq. (
7
) for the boundary conditions
qt
= 0 to
qt
=
qt
and
t
= 0 to
t
=
t
, which is given by [
30
]
1(qe-qt)=1qe+kt.
By rearranging, Eq. (
8
) can take a linear form as
tqt=1k2qe2+tqe,
where
k2
(g mg
−1
min
−1
) was the equilibrium rate constant of pseudo-second-order model;
t
(min) was the reaction time;
qe
(mg g
−1
) was the amount of adsorbate at equilibrium; and
qt
(mg g
−1
) was the amount of adsorbate at time
t
.
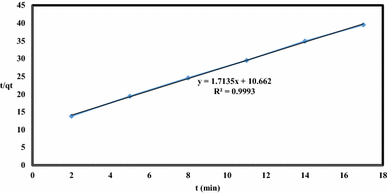
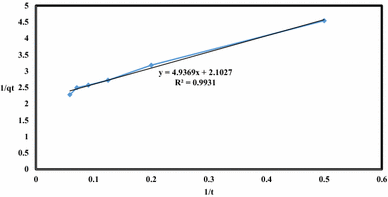
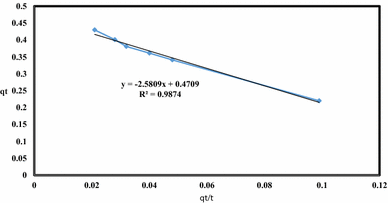
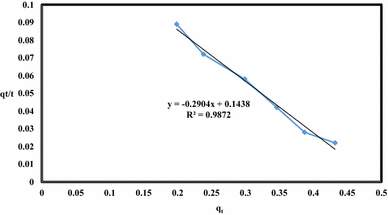
In this study, four types of linear forms of the pseudo-second-order kinetic model [
31
,
32
] were used. Figures
8
,
9
,
10
,
11
show the plots of four types of linear forms of the pseudo-second-order kinetic model.
Fig. 8
Type 1 of pseudo-second-order kinetic of ethidium bromide on GO adsorbent. Conditions: initial concentration: 0.5 mg L
−1
; dosage of adsorbent: 0.5 mg; temperature: 298 K and pH: 8
Fig. 9
Type 2 of pseudo-second-order kinetic of ethidium bromide on GO adsorbent. Conditions: initial concentration: 0.5 mg L
−1
; dosage of adsorbent: 0.5 mg; temperature: 298 K and pH: 8
Fig. 10
Type 3 of pseudo-second-order kinetic of ethidium bromide on GO adsorbent. Conditions: initial concentration: 0.5 mg L
−1
; dosage of adsorbent: 0.5 mg; temperature: 298 K and pH: 8
Fig. 11
Type 4 of pseudo-second-order kinetic of ethidium bromide on GO adsorbent. Conditions: initial concentration: 0.5 mg L
−1
; dosage of adsorbent: 0.5 mg; temperature: 298 K and pH: 8
The Chi-square statistic (
χ2
) was used to evaluate the fitness of kinetic equations to the experimental data [
13
]. Chi-square statistic can be defined as
χ2=∑iNqe,exp-qe,cal2qe,cal.
χ2
will be a small number if the data from the experimental data are similar to the model, and
χ2
will be a large number if they are different.
N
is the number of observations in the experimental data, and the subscripts “calc” and “exp” show the calculated and experimental values, respectively.
According to the results of kinetic study listed in Tables
1
and
2
, removal of ethidium bromide (EtBr) by graphene oxide (GO) surface as adsorbent from solution was well interpreted by pseudo-second-order kinetic model the type (I) because of low value of the Chi-square statistic (
χ2
) and high value of the correlation coefficients (
r2
).
Table 1
Pseudo-first-order, Elovich and intra-particle diffusion kinetic parameters for adsorption ethidium bromide on GO adsorbent
Model
Equation
Parameters
EtBr
q (mg/g)
0.350
Pseudo-first-order
log(qe-qt)=log(qe)-k1t
k1 (1/min)
0.060
r2
0.991
χ2
4.99
α
0.100
Elovich
qt=1βlnαβ+1βlnt
β
10.42
r2
0.988
χ2
5.14
Intra-particle diffusion
C
0.080
qt=kit0.5+C
ki (1/min)
0.084
r2
0.966
χ2
6.71
Table 2
Four types of the pseudo-second-order kinetic of ethidium bromide on GO adsorbent
Type
Linear form
Plot
Parameters
EtBr
qe
0.584
Type (I)
tqt=1kqe2+1qet
t/qt vs. t
k21
0.275
r2
0.999
χ2
2.01
Type (II)
1qt=1kqe21t+1qe
1/qt vs. 1/t
qe
0.476
k22
0.894
r2
0.993
χ2
8.41
qe
0.470
Type (III)
qt=qe-1kqeqtt
qtvs.qt/t
k23
0.825
r2
0.987
χ2
7.70
qe
0.290
Type (IV)
qtt=kqe2-qeqt
qt/tvs.qt
k24
1.700
r2
0.987
χ2
7.26
Conclusions
In summary, adsorption capacity of ethidium bromide (EtBr) on graphene oxide (GO) surface as solution adsorbent was investigated. To remove ethidium bromide by graphene oxide adsorbent, 17 min was selected as optimum time as after 17 min, no noticeable change was observed in the amount of absorption capacity of EtBr on the GO surface. The results of pH effect showed that high amount of adsorption capacity of (EtBr) on (GO) surface was at pH 8; therefore, solution pH was fixed at pH 8. All adsorption experiments were performed at temperature 298 K. For kinetic study and to test adsorption experimental data the Elovich, the pseudo-first-order, the intra-particle diffusion, and the pseudo-second-order kinetic models were used. The results of kinetic study showed that adsorption of ethidium bromide on graphene oxide surface was well interpreted by type (I) of the pseudo-second-order kinetic model because of the low value of the Chi-square statistic (
χ2
) and high value of the correlation coefficients (
r2
).
Acknowledgements
The authors would like to thank the Young Researchers and Elite club, East Tehran Branch, Islamic Azad University for their financial support.
References
Lunn and Sansone (1987) Ethidium bromide: destruction and decontamination of solutions (pp. 453-458) 10.1016/0003-2697(87)90419-2
Stevenson et al. (1995) Comparison of isometamidium chloride and homidium bromide as prophylactic drugs for trypanosomiasis in cattle at Nguruman, Kenya (pp. 257-258) 10.1016/0001-706X(94)00080-K
Najafi and Rajabi (2015) Thermal gravity analysis for the study of stability of graphene oxide–glycine nanocomposites (pp. 187-190) 10.1007/s40089-015-0154-7
Yari et al. (2016) Removal of Pb(II) ion from aqueous solution by graphene oxide and functionalized graphene oxide-thiol: effect of cysteamine concentration on the bonding constant 57(24) (pp. 11195-11210) 10.1080/19443994.2015.1043953
Choi et al. (2010) Synthesis of graphene and its applications: a review (pp. 52-71) 10.1080/10408430903505036
Najafi et al. (2015) Thermodynamics of the adsorption of nickel ions from aqueous phase using graphene oxide and glycine functionalized graphene oxide (pp. 106-113) 10.1016/j.molliq.2015.04.033
Dreyer et al. (2010) The chemistry of graphene oxide (pp. 228-240) 10.1039/B917103G
Rajabi et al. (2015) Adsorption of methyl orange dye from water solutions by carboxylate group functionalized multi-walled carbon nanotubes 6(3) (pp. 227-240)
Robati et al. (2015) Raman spectroscopy and TGA studies for the synthesis of multiwalled carbon nanotube-functionalized thiol (MWCNT-SH) nanocomposites: study of effect of concentration (pp. 179-182) 10.1007/s40089-015-0152-9
Demiral and Güngör (2016) Adsorption of copper(II) from aqueous solutions on activated carbon prepared from grape bagasse (pp. 103-113) 10.1016/j.jclepro.2016.02.084
Robati et al. (2016) Removal of hazardous dyes-BR 12 and methyl orange using graphene oxide as an adsorbent from aqueous phase (pp. 687-697) 10.1016/j.cej.2015.08.131
Chi and Zhao (2009) Adsorption of formaldehyde molecule on the intrinsic and Al-doped graphene: a first principle study (pp. 1085-1090) 10.1016/j.commatsci.2009.05.017
Li et al. (2012) Uranium(VI) adsorption on graphene oxide nanosheets from aqueous solutions (pp. 539-546) 10.1016/j.cej.2012.09.030
Zhao et al. (2011) Kinetic and thermodynamic study of 1-naphthol adsorption from aqueous solution to sulfonated graphene nanosheets (pp. 185-190) 10.1016/j.cej.2011.07.072
Fan et al. (2013) Synthesis of magnetic-cyclodextrin–chitosan/graphene oxide as nanoadsorbent and its application in dye adsorption and removal (pp. 601-607) 10.1016/j.colsurfb.2012.11.023
Zhang et al. (2014) Adsorption of Pb(II) and Hg(II) from aqueous solution using magnetic CoFe2O4-reduced graphene oxide (pp. 177-182) 10.1016/j.molliq.2013.12.015
Kim et al. (2015) Adsorption isotherms and kinetics of cationic and anionic dyes on three-dimensional reduced graphene oxide macrostructure (pp. 1191-1196) 10.1016/j.jiec.2014.05.033
Mishra and Ramaprabhu (2011) Functionalized graphene sheets for arsenic removal and desalination of sea water (pp. 39-45) 10.1016/j.desal.2011.01.038
Rajabi et al. (2016) Adsorption of malachite green from aqueous solution by carboxylate group functionalized multi-walled carbon nanotubes: determination of equilibrium and kinetics parameters (pp. 130-138) 10.1016/j.jiec.2015.11.001
Açıkyıldız et al. (2015) A comparative examination of the adsorption mechanism of an anionic textile dye (RBY 3GL) onto the powdered activated carbon (PAC) using various the isotherm models and kinetics equations with linear and non-linear methods (pp. 279-284) 10.1016/j.apsusc.2015.07.021
Robati et al. (2016) Effect of electrostatic interaction on the methylene blue and methyl orange adsorption by the pristine and functionalized carbon nanotubes (pp. 1-6) 10.1016/j.physe.2016.04.005
Alia et al. (2016) Potential of using green adsorbent of heavy metal removal from aqueous solutions: adsorption kinetics, isotherm, thermodynamic, mechanism and economic analysis (pp. 317-332) 10.1016/j.ecoleng.2016.03.015
Yari et al. (2015) Kinetics of the adsorption of Pb(II) ions from aqueous solutions by graphene oxide and thiol functionalized graphene oxide (pp. 50-57) 10.1016/j.molliq.2015.05.022
Fu et al. (2015) Adsorption of methylene blue by a high-efficiency adsorbent (polydopamine microspheres): kinetics, isotherm, thermodynamics and mechanism analysis (pp. 53-61) 10.1016/j.cej.2014.07.101
An et al. (2016) Removal of sulfonated humic acid from aqueous phase by modified coal fly ash waste: Equilibrium and kinetic adsorption studies (pp. 264-271) 10.1016/j.fuel.2015.10.069
Lee (2016) Equilibrium, kinetic and thermodynamic parameter studies on adsorption of acid yellow 14 using activated carbon 54(2) (pp. 255-261) 10.9713/kcer.2016.54.2.255
Wongrueng et al. (2016) Kinetic adsorption of fluoride from an aqueous solution onto a dolomite sorbent 20(3) (pp. 1-9) 10.4186/ej.2016.20.3.1
Koçer and Acemioğlu (2016) Adsorption of Basic green 4 from aqueous solution by olive pomace and commercial activated carbon: process design, isotherm, kinetic and thermodynamic studies 57(35) (pp. 16653-16669) 10.1080/19443994.2015.1080194
Al-Jabari (2016) Kinetic models for adsorption on mineral particles comparison between Langmuir kinetics and mass transfer (pp. 27-37) 10.1016/j.eti.2016.04.005
Hafeznezami et al. (2016) Adsorption and desorption of arsenate on sandy sediments from contaminated and uncontaminated saturated zones: Kinetic and equilibrium modeling (pp. 290-301) 10.1016/j.envpol.2016.05.029