Results and discussion
Powder X-ray diffraction (PXRD) analysis
Phase characterization of the obtained materials was investigated using PXRD technique with CuKα radiation at the range of 10°–90° and the step of 0.05°. Figures
1
,
2
and
3
show the X-ray diffraction (XRD) patterns of the obtained alumina nanomaterials. Figure
1
shows the XRD pattern of the obtained material without using any fuel to synthesize alumina annealed at 950 °C for 4 h. As shown in Fig.
1
, the main phase for the synthesized material is beta (JCPDScard number: 100414) and gamma (JCPDS card number: 011307) nano-alumina. Also, Fig.
2
shows the PXRD pattern of the obtained material using urea as fuel for the synthesis of nano-alumina at 820 °C for 4 h. The figure shows that the main phase is actually gamma (JCPDS card number: 040858) nano-alumina. Moreover, Fig.
3
shows the PXRD pattern of the obtained material using glycine as fuel to synthesize alumina at 820 °C for 4 h. The figure shows that the main phase is gamma (JCPDS card number: 291486) nano-alumina. As shown in Figs.
1
,
2
and
3
, it is clear that with using fuel for the synthesis of nano-alumina, the obtained phase is nearly pure gamma alumina. However, when the reaction was performed without using any fuel, the obtained phase was a mixture of beta and gamma nano-alumina. But the ratio of gamma to beta phase was 0.89. It shows that the ratio of gamma phase in the synthesized nanomaterial is about 45 %.
PXRD pattern of the synthesized a multi-phase beta and gamma nano-alumina via a solution combustion method without using fuel at 950 °C for 4 h PXRD pattern of the synthesized gamma nano-alumina via a solution combustion method using urea as fuel at 820 °C for 4 h PXRD pattern of the synthesized gamma nano-alumina via a solution combustion method using glycine as fuel at 820 °C for 4 hFig. 1
Fig. 2
Fig. 3

Morphology analysis
Figure
4
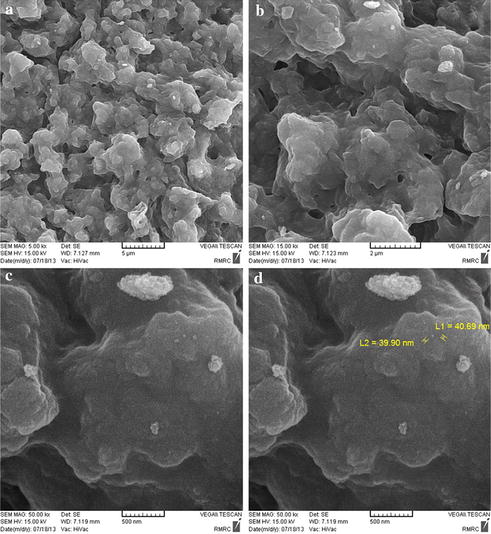
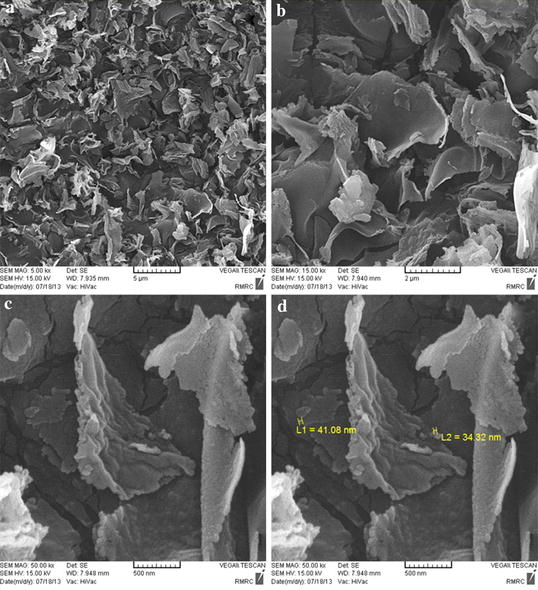
shows the scanning electron microscopic (SEM) images of the synthesized nanomaterials via a combustion method without using fuel, annealed at 950 °C for 4 h. Figure
4
a shows the low-magnification image of the synthesized material. It is clear that the sample is in a porous-like structure. It shows that the porosity distribution is nearly homogeneous. Figure
4
b shows that the porosity is in micro-porosity range. It shows that the porosity diameter is in a range of about 50–200 nm. Figure
4
c and d shows the high-magnification image of the synthesized nanomaterials. It is clear that there are small particles, as uncus, on the synthesized materials. It shows that the particle sizes are in a range of about 40–200 nm in diameter.
SEM images of the obtained materials from the combustion method without using fuel annealed at 950 °C for 4 hFig. 4
Figure
5
shows the SEM images of the synthesized nanomaterials via a combustion method without using fuel, annealed at 820 °C for 4 h. Figure
5
a shows the low-magnification image of the synthesized material. It is clear that the sample is in a grain-like structure. It shows that the size and morphology distribution is nearly homogeneous. Figure
5
b shows that there is porous structure in the analyzed sample. Figure
5
c shows that the porosity size is in micro-porosity range. It also shows that the porosity diameter is in a range of about 100–150 nm. Figure
5
d shows the high-magnification image of the synthesized nanomaterials. It is clear that the large particle’s diameter is in the range of about 200–500 nm, and the small particles, as uncus on the synthesized materials, are in a range of about 25–50 nm in diameter.
SEM images of the obtained materials from the combustion method without using fuel annealed at 820 °C for 4 hFig. 5

Figure
6
shows the SEM images of the synthesized nanomaterials via a combustion method using urea as fuel, annealed at 820 °C for 4 h. Figure
6
a and b shows the low-magnification image of the synthesized material. It is clear that the sample is in a flake-like structure. It shows that the size and morphology distribution is nearly homogeneous. Figure
6
c shows that the size of the thickness of the flakes is about 50–80 nm. Figure
6
d shows the high-magnification image of the synthesized nanomaterials. It is clear that the length of the flakes is in the range of about 2–3 µm.
SEM images of the obtained materials from the combustion method using urea as fuel annealed at 820 °C for 4 hFig. 6
Figure
7
shows the SEM images of the synthesized materials via a combustion method using glycine as fuel, annealed at 820 °C for 4 h. Figure
7
a and b shows the low-magnification image of the synthesized material. It is clear that the sample is a porous-like structure with small particles on the sample. It shows that the size and morphology distribution is nearly homogeneous. Figure
7
c and d shows the high-magnification image of the synthesized material. It is clear that the size of the diameter of the pores is in the range of about 70–100 nm, and the particle sizes are in a range of about 30–50 nm.
SEM images of the obtained materials from the combustion method using glycine as fuel annealed at 820 °C for 4 hFig. 7

Figure
8
a–b shows the Fourier transform infrared (FTIR) spectra of the synthesized nanomaterials via a combustion method at different conditions. The FTIR spectrum of the synthesized nanomaterial annealed at 950 °C is shown in Fig.
8
. The peaks at 1625–1650 cm
−1
are assigned to the bending vibrations of the hydroxide. The weak peaks at 1508 and 2340 cm
−1
are assigned to nitrate and carbonate. Figure
8
b shows the FTIR spectrum of the synthesized nanomaterial annealed at 820 °C for 4 h. The peaks at 400 to 900 cm
−1
are assigned to Al–O vibrations [
22
]. The peaks at 500–570 cm
−1
are assigned to AlO
6
, and the peaks at 675–775 cm
−1
are assigned to AlO
4
. Also, the peaks at 1635 cm
−1
are assigned to the bending vibrations of hydroxide vibrational mode, and the peak around 3480 cm
−1
is assigned to the stretching vibration of hydroxide.
FTIR spectrum of the synthesized nanomaterial via a combustion method without using any fuel at
a
820 °C,
b
850 °C,
c
using urea as fuel at 820 °C and
d
using glycine as fuel at 820 °C for 4 hFig. 8