Kashan Branch, Islamic Azad University, Kashan, IR
Najafabad Branch, Islamic Azad University, Najafabad, IR
Department of Chemical Engineering, Hamedan University of Technology, Hamedan, IR
Abstract
This paper presents a methodology for determination of the optimal material and processing parameters (i.e., nanoclay content, melt temperature, feeding rate, and screw speed) to maximize simultaneously tensile modulus and tensile strength of injection-molded PA-6/clay nanocomposites through coupling response surface method and genetic algorithm. The tensile tests on PA-6/clay nanocomposites are conducted to obtain tensile modulus and tensile strength values, and then analysis of variance is performed. The predicted models for tensile modulus and tensile strength are created by response surface method, and then the functions are optimized by a genetic algorithm code implemented in MATLAB. Acceptable agreement has been observed between the values of the process parameters predicted by the response surface method and genetic algorithm and those of the process parameters obtained through experimental measurements. This study shows that the response surface method coupled with the GA can be utilized effectively to find the optimum process variables in tensile test of PA-6/NC nanocomposites.
Introduction
During the past decade, polymer nanocomposites have emerged relatively as a new, novel, and rapidly developing class of composite materials and attracted considerable investment in research and development worldwide. Recent and ongoing research on polymer nanocomposites [
1
–
5
] has shown remarkable improvement of tensile modulus and tensile strength compared with pure polymer and their conventional microcomposites, even at very low filler content. The properties of nanocomposites are greatly influenced by the properties of the individual components (nanofiller and polymer), their size scale, degree of mixing, morphology, and interfacial characteristics. Modeling the mechanical properties of nanocomposites has become very interesting to many researchers in both academia [
6
,
7
] and industry [
8
,
9
]. Tensile modulus and tensile strength are the most important mechanical properties which are considered in designing material, and their modeling particularly in the presence of nanoparticle is very important.
Several parameters such as nanoclay content, screw speed, melting temperature, and feeding rate are influential in the extrusion process and can change the final properties of the prepared samples. Several methods can be used for modeling and analysis of a system that is affected by different parameters. One is response surface method (RSM) [
10
] which refers to a set of statistical techniques and algorithms of gathering information, which is employed for improvement, extension, and optimization of processes. On the other hand, genetic algorithm (GA) [
11
] is a heuristic optimization method that searches for the optimal solution, with high speed, when the analytical model which obtained from response surface method (RSM) is at hand. GA goal is to optimize response variables over a range of independent variables. This method is easy, precise, efficient, and economically attractive. However, in most cases, the relationship between response and independent variables is unknown. In RSM, a proper estimation is considered for the relationship between response and independent variables which is usually a polynomial.
The combination of RSM and GA has been addressed in literature to successfully find the optimum conditions. Most of these works have been carried out in the field of injection molding. For example, the effectiveness of the optimization method was demonstrated by industrial injection production of a LCD TV panel [
12
]. In a study [
13
], efficient minimization of warpage on thin shell plastic parts by integrating finite element analysis, statistical design of experiment method, RSM, and GA is investigated. In another study [
14
], efficient minimization of warpage on thin shell plastic parts by integrating finite element analysis, DOE method, RSM, and GA is investigated. In a paper [
15
], it is shown that the combination of RSM and GA proposed is useful for the optimization of injection molding process parameters and for minimizing the molding warpage. In a recent research [
16
], RSM and GA technique were used to develop the statistical models of dimension shrinkage and find the optimal injection molding conditions for minimum overall dimension shrinkage variations. In a more recent study [
17
], a hybrid method including back-propagation neural network (BPNN), GA, and RSM are used to determine an optimal parameter setting of the injection molding process of short glass fiber and polytetrafluoroethylene reinforced polycarbonate composites. In another more recent study [
18
], optimization of process parameters using RSM and GA was proposed to generate the optimal process parameter settings of multiple-quality characteristics. Their experimental results show that the proposed optimization model is very successful and can be used in industrial applications. In a latest study [
19
], a real case of a thermoplastic injected part is analyzed.
On the other hand, there have been some works in which the combination of GA and RSM is extended to other techniques such as ANN or finite element analysis. For example, a paper [
20
] presented the comparative studies between ANN–GA and RSM in fermentation media optimization. A study [
21
] used RSM to establish the mathematical models of relations between the welding process parameters and the weld strength. Then the desirability function coupled with genetic algorithm is used to carry out the multi-objective optimization. Their results demonstrate that the predicted results of the optimization are in good agreement with the experimental results.
With reference to the published literature, it is clear that currently the usage of the GA technique for the polymer processing is given less consideration by researchers. Much of the optimization study has been done on injection molding, but none has been done on mechanical properties of PA-6/clay nanocomposites. The increasing acceptance of PA-6/clay nanocomposites by industry has necessitated a polymer processing producing the maximum tensile modulus and tensile strength. Therefore, it is necessary to know the optimum conditions for processing of PA-6/clay nanocomposites, which can produce acceptable mechanical properties.
While the effects of chemical structures of polymer and nanoclay (NC) on mechanical properties of polymer nanocomposites (PNCs) have been studied extensively, few studies [
22
–
35
] consider the optimization of material and processing parameters. Therefore, the main objective of this study is using a powerful method to optimize material and processing conditions in the twin-screw compounding of PA-6/NC nanocomposites and evaluating their effects on mechanical properties which is not considered in detail in other reports. Moreover, notwithstanding the vast number of papers concerning PNCs, a few works have been devoted to investigate modeling the effect of different parameters on PNC mechanical properties [
36
,
37
]. More importantly, the studies that have dealt with mechanical properties were barely systematic, using the inefficient one-factor-at-a-time (OFAT) approach and missing the interaction between factors. In this study, genetic algorithm method has been employed to propose a design method based upon genetics [
38
], for the mechanical properties of the PA-6 nanocomposites in which the target was set to find the optimum design. To make the problem quietly intelligible, the optimum criterion defined as the case for which the maximum tensile modulus and tensile strength were also feasible simultaneously. At first, a total number of 27 samples, formulated based on a four-factor three-level Box–Behnken design, were prepared in a twin-screw extruder. By studying the interaction between NC content and each of the other factors, we demonstrate how the increase in NC content changes the mechanical properties. RSM is employed in modeling of tensile modulus and strength, and the obtained functions from RSM optimized by GA.
Materials and methods
Material preparation
PA-6 (B5, with melt volume flow rate of 8 cm
3
/10 min at 275 °C, load 5 kg) was purchased from BASF and used as received. NC (Nanofil9
®
, organically modified by stearyl benzyl dimethyl ammonium chloride with good adhesion to PA-6) was purchased from Southern Clay Products, a subsidiary of Rockwood Specialties.
Sample preparation
PA-6 pellets and NC powder, pre-dried at 90 °C for 12 h, were tumble-blended at dry conditions. The samples were prepared via melt intercalation in a laboratory-scale corotating twin-screw extruder (ZSK25, L/D = 40, Germany). The extruder was equipped with a circular die. After melt mixing, dry pelletized samples were injection-molded into standard tensile bars (ASTM D638) using a 3-ton Engel injection molding machine. Afterward, the injection-molded specimens were sealed and placed in a vacuum desiccator for a minimum of 24 h prior to mechanical testing under dry conditions.
Sample characterization
Standard tensile properties of PA-6 and PA-6/NC samples were determined according to ASTM D638 method using injection-molded dumbbells in a constant loading speed of 50 mm/min. Tensile modulus and strength values were obtained from averaging five specimen test results.
Design of experiments using RSM
The main objective in design of experiment is to study the relationship between the response and variables. The design of experiment is a method to minimize the number of experiments in order to reach optimum conditions. To explore the relationship between the response and the independent variables, the required data are obtained experimentally. To reduce the number of experiments, the number of data was kept at minimum. A response surface is an analytical function such as a polynomial that relates the behavior of one or more response variables to several independent variables. RSM has many applications in design, development, and optimization. An important step in response surface modeling is to define an appropriate approximation for the actual relationship between the response and the set of independent variables [
10
].
Conventionally, a first-order polynomial model [
39
], being the simplest model, is used. In order to employ the linear regression model for the true response surface, it can be written as Eq. (
1
).
y=b0+b1x1+…+bkxk+ε
where the parameters b
j
,
j
= 0, 1…
k
, are called the regression coefficients.
A quadratic linear regression model [
39
] is used to predict the responses which are dependent on NC content (NC), melt temperature (MT), feeding rate (FR), and screw speed (SS):
y=b0+∑i=1kbixi+∑i=1kbiixi2+∑∑i=1kbijxixj,i<k.
Optimization of process conditions
Most researchers have used traditional optimization techniques to solve problems. The traditional methods of optimization and search do not fare well over a broad spectrum of problem domains. Traditional techniques are not efficient when the practical search space is too large. These algorithms are not robust. Numerous parameters can make the optimization problems more complicated. Traditional techniques such as geometric programming, dynamic programming, branch-and-bound techniques, and quadratic programming found it hard to solve these problems. They are, furthermore, inclined to obtain a local optimal solution. GA comes under the class of the non-traditional search and optimization techniques.
GA methods are a class of stochastic search methods that mimic the metaphor of natural biological evolution. These methods operate on a population of potential solutions, applying the principle of survival of the fittest to produce better and better approximations to a solution, just as in natural adaptation. A great advantage of GA methods over other algorithms is that they need a type of primary guess in relation to the solution, which is significantly effective on the final result. GA needs a search range which is presented according to the initial information of the physical properties. GA searches the total solution space superficially without computing the performance function for all the points. This type of search does not fall in the local optimum valley. GA consists of the following steps: production of the initial population; selection of the parent chromosomes from the population according to their fitness; crossing over the parents to create new offspring; mutating the new offspring at each locus (new offspring replace weak offspring); repeating the algorithm until the final condition is satisfied; and returning the best solution in the current population [
38
].
Objective function and decision variables
The main goal of the present paper is to determine the optimal input parameters (NC content, melt temperature, feeding rate, and screw speed), leading to maximum tensile modulus and tensile strength. In this regard, the obtained response functions from RS are defined in the standard multi-objective optimization problem framework which can be solved by a numerical optimization GA algorithm. GA algorithm requires objectives and variables. In view of the multi-objective optimization, two new fitness functions, tensile modulus and tensile strength (the minus sign indicates finding the maximum of tensile modulus and tensile strength in optimization process), are to be optimized.
GA implementation and optimization parameters
The multi-objective optimization problem was solved taking advantage of effective genetic algorithm codes produced in MATLAB. The parameters of the proposed genetic algorithm have remarkable effects on the quality and effectiveness of the algorithm. Based on the previous investigations and the experience of the authors, a double-vector and uniform function was set as the population type and mutation. Therefore, in order to adjust the parameters, DOE was employed. The results of DOE, which are not presented in this paper, indicate that if the population size is set to 100, the mutation rate is assigned to 0.05, the crossover function and rate are set to intermediate and 0.8, and the number of generation is assigned to 400, better results are attained.
Results and discussion
As mentioned earlier, there are two response variables including tensile modulus (
M
) and tensile strength (
S
), and four independent variables, namely NC, MT, FR, and SS, each at three levels chosen based on the primary experiments. As a first variable, NC content has been taken at three levels of 2, 4, and 6 phr. As a second variable, the levels of screw speed are 450, 600, and 750 rpm. Melt temperature has been changed from 235 to 245 and 255 °C. As a last one, feeding rate has been varied from 7 to 9 and 11 rpm. In this work, 27 samples based on Box–Behnken design of the experiments were produced using a twin-screw extruder and processing conditions reported in Table
1
. Then, RSM can fit the surfaces of response variables to find the effects of variables on response variables and can make the relation between response variables and variables. Therefore, M and S will be obtained as a function of four variables (NC, MT, FR, and SS). The obtained functions can be optimized through GA, and the optimum variables can be attained as presented in the following sections.
Table 1
Processing conditions and obtained data from experiments for modeling of the tensile properties
Sample
Processing conditions
Obtained data
NC content (phr)
Melt temperature (°C)
Feeding rate (RPM)
Screw speed (RPM)
M (MPa)
S (MPa)
S1
4
245
7
450
3351
85.2
S2
4
235
11
600
3120
82.6
S3
6
255
9
600
3498
86.7
S4
4
245
7
750
3370
89.4
S5
4
245
11
750
3477
91.2
S6
4
245
9
600
3361
83.7
S7
6
245
11
600
3985
93.5
S8
2
245
9
750
3012
87.0
S9
6
245
9
450
3843
87.3
S10
2
245
7
600
3201
86.6
S11
4
235
9
750
3625
89.2
S12
4
235
9
450
3488
88.7
S13
2
245
11
600
3200
90.3
S14
4
235
7
600
3850
90.3
S15
4
245
9
600
3659
92.5
S16
4
245
9
600
3474
88.7
S17
2
235
9
600
3293
86.2
S18
6
235
9
600
3984
89.8
S19
2
255
9
600
3350
88.7
S20
4
255
11
600
3640
89.6
S21
4
255
9
450
3492
87.4
S22
4
255
9
750
3400
92.6
S23
6
245
9
750
3458
89.9
S24
4
245
11
450
3464
87.1
S25
2
245
9
450
3210
83.5
S26
4
255
7
600
3678
89.2
S27
6
245
7
600
3938
90.4
Fitted models from RSM
The mechanical properties of PA-6/NC nanocomposites were evaluated as tensile modulus (
M
) and tensile strength (
S
). The fitted linear models obtained from RSM are described in Eqs. (
3
) and (
4
):
M=b0+43427.49×NC-1871.68×MT-306.14×FR+2321.47+14.92×NC2-0.13×NC.MT+6.78×NC.FR-0.15×NC.SS+0.56×MT2+8.65×MT.FR-0.03×MT.SS+9.57×FR2-0.005×FR×0.004×SS2S=c0+361.22×NC-18.76×MT-1.24×FR-27.13×SS-0.16.NC2-0.02.NC.MT-0.07.NC.FR-0.03×NC.SS+0.0007×MT2+0.0004×MT.FR+0.10×MT.SS+0.0007×FR2-0.14×FR.SS-0.00008×SS2
The obtained data from the experiments are compared with RSM prediction, which are presented in Table
2
. The RSM model is comparatively in acceptable agreement with the experimental data.
Table 2
Comparison of RSM predictions with the experimental data
No.
M (MPa) exp.
M (MPa). RSM
Error (%)
S (MPa) exp.
S (MPa) RSM
Error (%)
5
3477
3353
−3.56
91.2
90.53
−0.73
12
3488
3718
6.59
88.7
89.3
0.67
16
3474
3578
2.99
88.7
88.62
−0.00
23
3458
3668
6.07
89.9
91.15
1.39
Effect of NC content
To study the effect of NC content, three factors (i.e., melt temperature, screw speed, and feeding rate) through which residence time, shear intensity, and polymeric chains diffusion could be changed were chosen as follows:
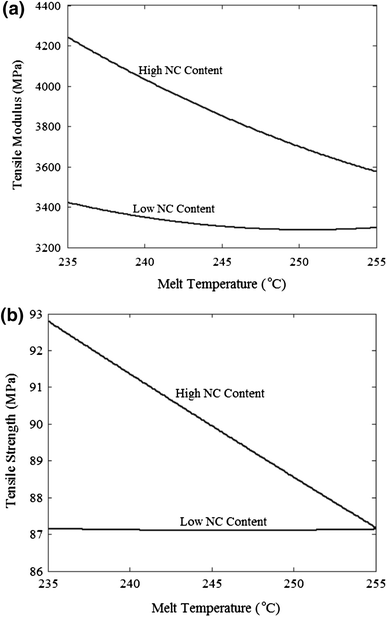
Melt temperature
Figure
1
shows the effect of melt temperature on the tensile modulus and tensile strength at low and high NC content. At high NC content, the increase in melt temperature reduces the tensile modulus and tensile strength. Although the increase in melt temperature increases the mobility and diffusion of polymeric chains, it is not enough to compensate for the decrease in melt viscosity that in turn causes a loss in shear intensity imposed on NC stacks, which is highly essential for breaking them down.
Fig. 1
Tensile properties as a function of melt temperature at low and high NC content:
a
tensile modulus,
b
tensile strength
However, in low NC content by increasing the melt temperature, the tensile modulus and tensile strength remained almost unchanged. From this can be concluded the effects of mobility of polymeric chains and melt viscosity are equal approximately.
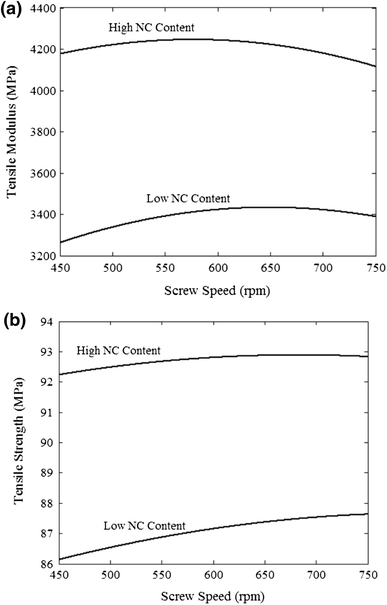
Screw speed
Figure
2
shows the effect of screw speed on the tensile modulus and tensile strength of different samples at low and high NC content. As can be seen, at low NC content, an increase in screw speed improves the tensile modulus and tensile strength. In fact, by increasing screw speed, the shear stress increases and causes to break NC stacks and consequently polymeric chains can diffuse between NC layers. In addition, the higher screw speed makes better dispersion compared with lower screw speed.
Fig. 2
Tensile properties as a function of screw speed at low and high NC content:
a
tensile modulus,
b
tensile strength
On the other side, at high NC content by increasing screw speed, the tensile modulus and tensile strength remained almost unchanged. From these results, it can be concluded that at high NC content, the changes of shear stress caused by the screw speed are not enough to improve diffusion of polymeric chains in NC layers. As can be seen in Fig.
2
, an increase in NC content led to increase in the tensile modulus and tensile strength.
Feeding rate
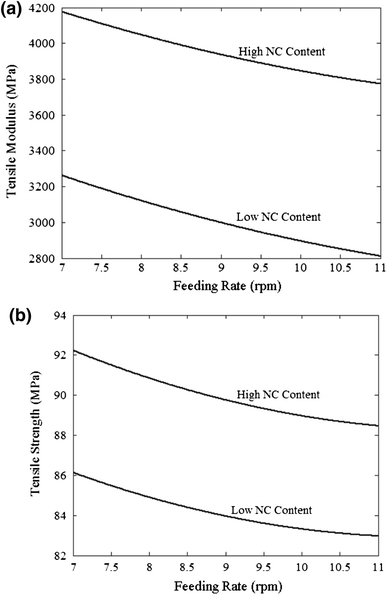
Figure
3
shows the effect of feeding rate on the tensile modulus and tensile strength at low and high NC content. At both levels of NC content, an increase in feeding rate reduces the tensile modulus (Fig.
3
a) and tensile strength (Fig.
3
b) because increasing feeding rate deteriorates NC dispersion. On the other hand, at high NC content, the tensile modulus and tensile strength are greater compared with low NC content.
Fig. 3
Tensile properties as a function of feeding rate at low and high NC content:
a
tensile modulus,
b
tensile strength
Analysis of variance
Analysis of variance (ANOVA) is an appropriate statistical method to recognize which parameters affect the response of the inquired process through the series of experimental results. The analysis of variance is employed to investigate the influence of input variables on the tensile modulus and tensile strength. ANOVA is carried out for a level of significance of 5 %, i.e., for a level of confidence of 95 %.
Table
3
shows ANOVA results for tensile modulus. The last column in Table
3
indicates the percentage of contribution of each factor to the total variation, indicating the degree of influence on the results. It can be revealed from Table
3
that NC content (51.73 %) and screw speed (1.79 %) are significant factors. Analysis of normal probability plot of residuals for tensile properties reveals that the residuals lie reasonably close to a straight line, and no departure points exist as data follow normal distribution.
Table 3
ANOVA for tensile modulus (TM) and strength (TS)
Source
DF
Seq ss
Ms
F
P
Contribution (%)
TM
TS
TM
TS
TM
TS
TM
TS
TM
TS
NC (phr)
2
986141
19.696
493074
9.762
14.83
1.34
0.000
0.286
51.73
2.64
MT (°C)
2
39882
4.573
12922
2.300
0.39
0.32
0.684
0.733
1.49
5.13
FR (rpm)
2
84108
8.852
29679
2.116
0.89
0.29
0.427
0.751
0.99
2.93
SS (rpm)
2
69149
30.363
34575
15.181
1.04
2.09
0.374
0.153
1.79
8.12
Error
18
598446
131.037
33247
7.280
29.92
59.87
Total
26
1777726
194.521
Table
3
displays the ANOVA results for tensile strength (S). According to Table
3
, screw speed (8.12 %) and melt temperature are significant factors. Like tensile modulus, from analysis of normal probability plot of residuals, it can be concluded that the residuals lie reasonably close to a straight line, and no departure points exist. It can be clearly observed that the data follow normal distribution.
Validation
The performance of the GA method descried earlier was tested along with comparison of the values of the GA with the experimental results in the optimal condition. The obtained error was in the acceptable range. The optimum conditions are at 235 °C as the melting point, 577 rpm as the screw speed, and 7 rpm as the feeding rate, which result in tensile modulus of 4259 MPa and tensile strength of 92.75 MPa. This means that an acceptable agreement is observed between the predicted values and the
M
and
S
obtained from the experimental measurements. This fact indicates that RSM coupled by constrained GA can be an effective optimization tool that obviates the need for either development of an analytical model or estimation of an empirical expression.
Conclusion
The main goal of this study has been multi-objective optimization of tensile modulus and tensile strength in the tensile tests of PA-6/NC nanocomposite samples. Based on the presented experimental results, the main findings are as follows:
The minimum tensile modulus (
M
= 3012 MPa) was achieved at NC content of 2 phr, melt temperature of 245 °C, feeding rate of 7 rpm, and screw speed of 750 rpm, and the maximum tensile modulus (
M
= 3985 MPa) was achieved at NC content of 6 phr, melt temperature of 245 °C, feeding rate of 11 rpm, and screw speed of 600 rpm.
The minimum tensile strength (
S
= 82.6 MPa) was achieved at NC content of 4 phr, melt temperature of 235 °C, feeding rate of 11 rpm, and screw speed of 600 rpm, and the maximum tensile strength (
S
= 93.5 MPa) was achieved at NC content of 6 phr, melt temperature of 245 °C, feeding rate of 11 rpm, and screw speed of 600 rpm.
Analysis of variance (ANOVA) for tensile modulus and tensile strength has showed that NC content and screw speed are the most significant factors for tensile modulus and tensile strength, respectively.
In conclusion, RSM can be employed reliably, successfully, and accurately in modeling of tensile modulus and tensile strength, and prediction of their values in tensile tests of PA-6/NC nanocomposites. The proposed model has been the result of coupling two RSM models with genetic algorithm. This model has been applied to select the optimal process variables in tensile tests from the experimental data. Good agreement has been observed between the values of the process parameters predicted by the RSM and GA and those of the process parameters obtained through experimental measurements. This study indicates that the response surface method coupled with the GA can be utilized effectively to find the optimum process variables in tensile test of PA-6/NC nanocomposites.
References
Tien and Wei (2001) High-tensile-property layered silicates/polyurethane nanocomposites by using reactive silicates as pseudo chain extenders (pp. 9045-9052) 10.1021/ma010551p
Brune and Bicerano (2002) Micromechanics of nanocomposites: comparison of tensile and compressive elastic moduli, and prediction of effects of incomplete exfoliation and imperfect alignment on modulus (pp. 369-387) 10.1016/S0032-3861(01)00543-2
Ji et al. (2002) Tensile modulus of polymer nanocomposites (pp. 983-993) 10.1002/pen.11007
Fornes et al. (2002) Effect of organoclay structure on nylon 6 nanocomposite morphology and properties (pp. 5915-5933) 10.1016/S0032-3861(02)00400-7
Chavarria et al. (2007) Effect of melt processing conditions on the morphology and properties of nylon 6 nanocomposites (pp. 1847-1864) 10.1002/pen.20894
Garofalo et al. (2009) Modelling of mechanical behaviour of polyamide nanocomposite fibres using a three-phase Halpin-Tsai model (pp. 1-16)
Molajavadi and Garmabi (2011) Predicting the Young’s modulus of intercalated and exfoliated polymer/clay nanocomposites (pp. 1-12)
Liu et al. (2012) Ultrasonic stirring effect on the microstructure of A356 alloys (pp. 120-127)
Nouri et al. (2012) Fabrication and mechanical property prediction of carbon nanotube reinforced Aluminum nanocomposites (pp. 1-14) 10.1016/j.matdes.2011.07.047
Khuri and Mukhopadhyay (2010) Response surface methodology (pp. 128-149) 10.1002/wics.73
Haupt and Haupt (2004) Wiley
Li et al. (2009) Optimal design of heating channels for rapid heating cycle injection mold based on response surface and genetic algorithm (pp. 4317-4323) 10.1016/j.matdes.2009.04.016
Kurtaran and Erzurumlu (2006) Efficient warpage optimization of thin shell plastic parts using response surface methodology and genetic algorithm (pp. 468-472) 10.1007/s00170-004-2321-2
Ozcelik and Erzurumlu (2005) Determination of effecting dimensional parameters on warpage of thin shell plastic parts using integrated response surface method and genetic algorithm (pp. 1085-1094) 10.1016/j.icheatmasstransfer.2004.10.032
Unknown ()
Chen et al. (2011) Experimental investigation of designed parameters on dimension shrinkage of injection molded thin-wall part by integrated response surface methodology and genetic algorithm: a case study (pp. 534-540) 10.1080/10426914.2010.530331
Tzeng et al. (2012) A study of optimization of injection molding process parameters for SGF and PTFE reinforced PC composites using neural network and response surface methodology (pp. 691-704) 10.1007/s00170-012-3933-6
Chen et al. (2012) A two-stage optimization system for the plastic injection molding with multiple performance characteristics (pp. 1220-1223) 10.4028/www.scientific.net/AMR.472-475.1220
Natalini et al. (2013) Comparison of numerical and experimental data in multi-objective optimization of a thermoplastic molded part (pp. 84-106) 10.3139/217.2699
Desai et al. (2008) Comparison of artificial neural network (ANN) and response surface methodology (RSM) in fermentation media optimization: Case study of fermentative production of scleroglucan (pp. 266-273) 10.1016/j.bej.2008.05.009
Unknown ()
González et al. (2012) Amorphous polyamide/maleated styrene–ethylene–co-butylene–styrene nanocomposites: effects of clay loading and compatibilizer content on morphology and mechanical properties (pp. 294-300) 10.1038/pj.2011.124
Keramati et al. (2012) Microcellular foaming of PP/EPDM/organoclay nanocomposites: the effect of the distribution of nanoclay on foam morphology (pp. 1-17)
Domenech et al. (2013) The importance of specific mechanical energy during twin screw extrusion of organoclay based polypropylene nanocomposites (pp. 7-14) 10.1016/j.compscitech.2012.11.016
Paggi et al. (2013) Process optimization for PA12/MWCNT nanocomposite manufacturing by selective laser sintering (pp. 1977-1985) 10.1007/s00170-012-4474-8
Moghri et al. (2013) Effect of nanoclay content on nanoclay dispersion mechanism: diffusion-controlled mechanism versus shear-controlled mechanism (pp. 1956-1965) 10.1177/0731684413493950
Alexandre and Dubois (2000) Polymer-layered silicate nanocomposites: preparation, properties and uses of a new class of materials (pp. 1-63) 10.1016/S0927-796X(00)00012-7
Dennis et al. (2001) Effect of melt processing conditions on the extent of exfoliation in organoclay-based nanocomposites (pp. 9513-9522) 10.1016/S0032-3861(01)00473-6
Fornes et al. (2001) Nylon 6 nanocomposites: the effect of matrix molecular weight (pp. 09929-09940) 10.1016/S0032-3861(01)00552-3
Ray and Okamoto (2003) Polymer/layered silicate nanocomposites: a review from
preparation to processing (pp. 1539-1641) 10.1016/j.progpolymsci.2003.08.002
Chavarria et al. (2007) Effect of melt processing conditions on the morphology and properties of nylon 6 nanocomposites (pp. 1847-1864) 10.1002/pen.20894
Moghri and Garmabi (2008) Investigation of the effects of formulation and processing parameters on properties of PA 6 nanocomposites using Taguchi method of experimental design (pp. 430-438) 10.3139/217.2132
Huynh et al. (2012) Role of interfacial chemistry on the rheology and thermo-mechanical properties of clay-polymer nanocomposites for building applications (pp. 519-531) 10.2478/s11696-011-0118-y
Kutvonen et al. (2012) Influence of nanoparticle size, loading, and shape on the mechanical properties of polymer nanocomposites10.1063/1.4767517