Result and discussion
Powder X-ray diffraction analysis (PXRD)
Tables
1
and
2
show the crystallographic data of the
S
1
and
S
2
, respectively. The data in Table
1
shows the XRD peaks in the range of 2
θ
= 4°–70°. The five intensive peaks that are corresponded to the pure La
2
Ce
2
O
7
phase are in agreement with the literature [
12
,
17
–
19
]. As shown in Table
2
, there are five peaks similar to those of Table
1
that are corresponded to the pure La
2
Ce
2
O
7
. However, there is a blue shift in the 2
θ
values indicating an expansion in the unit cell of
S
2
compared to
S
1
. Besides, there are several additional XRD peaks at around 15.77°, 27.41°, 31.73°, 48.72° and 54.23° which are related to La
2
O
3
[
27
–
29
]. Comparison of the data in Tables
1
and
2
show that by changing the conditions from deionized water to basic solution the crystals’ growth has increased but the material was not obtained as a pure phase.
Crystallographic data for
S
1 Entry 2 Intensity (counts) Miller indices (hkl) 1 28.62 3.12 347 111 2 32.72 2.73 145 200 3 47.04 1.93 155 220 4 56.27 1.63 122 311 5 57.41 1.60 74 222 Crystallographic data for S
2 Entry 2 Intensity 1 15.72 5.62 271 2 27.41 3.25 260 3 28.11 3.171 368 4 31.68 2.81 108 5 32.35 2.76 87 6 39.60 2.27 187 7 47.35 1.91 100 8 48.72 1.86 184 9 54.20 1.68 64 10 56.37 1.63 100Table 1
Table 2
Table
3
shows the cell parameter refinement data of the obtained materials. It is clear that with changing the solution pH, the parameter
a
was increased and so there was an expansion in the unit cell. The data were in good agreement with the interplanar spacing calculated by a Bragg’s equation. Besides, Table
3
shows the standard deviations of the cell parameters and cell volume for S
1
and S
2
. It shows that the values are small enough until we can compare the
a
parameter and volume value for S
1
and S
2
without doubt.
Cell parameter refinements of
S
1
and
S
2 Cell parameter Volume (Å3) Standard 5.570 172.809 5.4198 159.20 Standard deviation 0.0814 2.392 5.6061 176.19 Standard deviation 0.1932 6.073Table 3
The crystal phases of the hydrothermally synthesized nanomaterials at 180 °C for 48 h in deionized water and aqueous NaOH solutions were examined by powder X-ray diffraction technique. Figure
1
shows the PXRD data which confirms that the La
2
Ce
2
O
7
was crystallized in a cubic crystal structure with Fd3-m space group. According to the PXRD data, it was clear that with using deionized water solution, the pure La
2
Ce
2
O
7
phase was prepared but when NaOH solution was used, there was a mixture of two phases namely La
2
Ce
2
O
7
and La
2
O
3
. Also, using the sharpest peak at hkl = 111, interplanar spacing was calculated using Bragg’s equation as follows: Δ
d
=
d
(
S
2
) −
d
(
S
1
) = 3.171 − 3.117 = 0.054 Å. So, it showed that with changing the reaction condition, there was an expansion in the unit cell. The crystal size of
S
1
was calculated via Scherrer equation
PXRD patterns of the hydrothermally synthesized La
2
Ce
2
O
7
nanomaterialsFig. 1
Morphology analysis
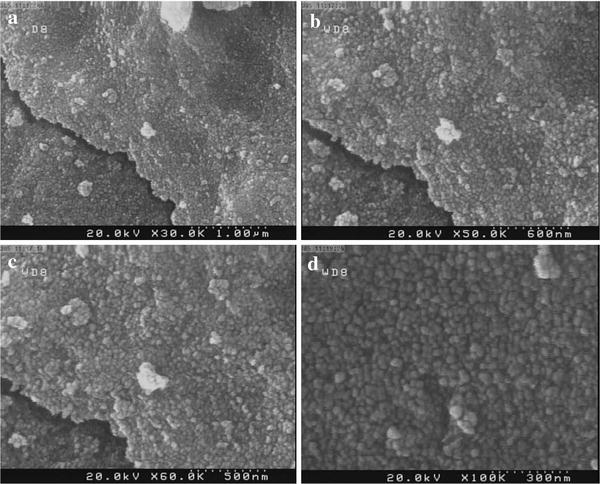
Figure
2
represents the field emission scanning electron microscopy (FESEM) images of the synthesized La
2
Ce
2
O
7
nano materials. It is clear that the obtained materials are in grain structure. According to Fig.
2
a–c, it is clear that the morphology of the obtained materials is homogeneous. Figure
2
d shows that the size distribution of the obtained materials is also homogeneous. As shown in the figure, it is clear that the diameter size of the grain nanostructures is about 30–50 nm.
FESEM images of S
1Fig. 2
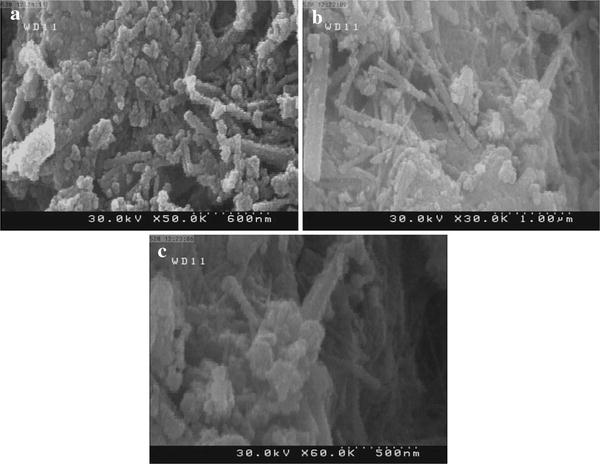
Figure
3
represents the FESEM images of the synthesized La
2
Ce
2
O
7
nanomaterials. It shows that with changing the reaction condition and using basic solution instead of deionize water, the morphology of the obtained materials were changed from non-homogeneous grain-like structures to non-homogeneous rod structures. Figure
3
a, b shows that the morphology of the obtained materials are a mixture of rod and particle structures that according to the XRD pattern, it might be due to the existence of two phases in the obtained material. As shown in Fig.
3
b, it is clear that the size of the obtained materials is non-homogeneous and the length size of the rod structures is between 700 nm–1.5 µm and the thickness size of the materials is about 60–100 nm. However, it was found that there was bulk materials formed via the process condition. It confirmed the incomplete phase formation according to the PXRD patterns shown in Fig.
1
.
FESEM images of S
2Fig. 3
Optical properties
Figure
4
shows the FTIR spectra of La
2
Ce
2
O
7
nano-powders in the wave number range of 400–1200 cm
−1
. Several characteristic absorption bands can be observed at about 472, 592, 653.82, 669, 698, 752, 794, 838, 904, 1051 and 1112 cm
−1
. As shown in Fig.
4
b, there is a peak at 653 cm
−1
which could be attributed to the presence of free La
2
O
3
and its La–O stretching vibrations [
27
]. The signals are in agreement with previously reported FTIR data for La
2
Ce
2
O
7
.
The FTIR spectra of
S
1
and
S
2
.
Asterisk
is due to the presence of La
2
O
3
and
hash
is the peak positionsFig. 4
Figure
5
a, b show the photoluminescence (pL) spectra of S
1
and S
2
, respectively. As seen in Fig.
5
a, there are some peaks at about 480, 510; a weak peak at about 590 and a broad and intensive peak at 650–750 nm. Figure
5
b also shows peaks at about 490, 530, 610 and a shoulder at about 650–720 nm. The broad and intensive peak at 650–750 nm in Fig.
5
a is due to the oxygen deficiency in the crystal structure which is typical of the A
2
B
2
O
7
pyrochlores. Figure
5
b also shows similar band at this region, but this band is much weaker which means that S
2
is not a pure La
2
Ce
2
O
7
phase. These data are in accordance with the PXRD data [
30
,
31
].
The pL spectra of
a
S
1
(
λ
ex
= 200 nm) and
b
S
2
(
λ
ex
= 200 nm)Fig. 5
Figure
6
a shows the ultraviolet visible spectra (UV–Vis) spectrum of
S
1
. Two main absorption bands could be observed at around 240 and 295 nm. The calculated band gap using the absorption edge for
S
1
was 3.1 eV which is lower than the band gap of pure CeO
2
(3.5 eV) [
30
,
31
]. Figure
6
b shows only one peak at about 265 nm which is different from that of
S
1
. These data also confirm that
S
2
is not a pure pyrochlore structure.
The UV–Vis spectrum of
S
1Fig. 6