Department of Inorganic Chemistry, Faculty of Chemistry, University of Tabriz, Tabriz, IR
Department of Chemistry, Semnan University, Semnan, IR
Department of Physics Engineering, Istanbul Technical University, Maslak, 34469, TR
Abstract
Li
2
SiO
3
nanopowders were synthesized via a non-stoichiometric 2:3 (S
1
), 1:3 (S
2
), 1:4 (S
3
) and 1:5 (S
4
) Li/Si molar ratios via hydrothermal reaction for 72 h at 180 °C in an aqua solution using Li
2
CO
3
and H
2
SiO
3
as raw materials. The synthesized materials were characterized by powder X-ray diffraction (PXRD) technique and Fourier transform infrared spectroscopy. PXRD data showed that the crystal structure of the obtained materials is orthorhombic with the space group of Cmc2
1
. Also, to investigate the effect of the Li/Si molar ratio on the morphology of the obtained materials, the morphologies of the synthesized materials were studied by field emission scanning electron microscopy. The technique showed that with changing the Li/Si molar ratio from S
1
to S
4
, the morphology of as-prepared samples changed from flower structures to microrod–microsphere and then to a non-homogenous layer-like structure. Ultraviolet–visible spectra showed that the nanostructure lithium silicate powders had good light absorption properties in the ultraviolet light region. It showed that with changing the Li/Si molar ratio from S
1
to S
4
, the calculated band gap was decreased. Also, cell parameter refinement showed that with changing the Li/Si molar ratio from S
1
to S
4
the cell parameters decreased. Photoluminescence analysis of the obtained materials was studied at the excitation wavelength of 247 nm. It showed that the emission spectra of the obtained materials had a blue shift from S
1
to S
4
.
Introduction
Lithium silicates are important phases in silicate glass ceramics [
1
]. They are attracted because of their applications as CO
2
captures [
2
–
8
], lithium battery cathode materials [
9
], fast ion conductors [
10
], optical waveguides [
11
] and tritium breeding materials [
12
,
13
]. Different methods have been reported to synthesize Li
2
SiO
3
nanomaterials including solid state, precipitation, sol–gel, extrusion–spherodisation, rotating/melting, combustion, electrochemical and via hydrothermal. However, most of the time, a mixture of Li
2
SiO
3
, Li
2
Si
2
O
5
, Li
4
SiO
4
and SiO
2
was obtained [
9
,
11
,
14
–
21
,
23
]. Recently, we have reported the synthesis of lithium metasilicate nanomaterials through a hydrothermal method at 180 °C in a mixture of LiNO
3
, SiO
2
and NaOH at 2:3 Li/Si molar ratio [
24
]. Also, in our another work, with using Li
2
CO
3
, H
2
SiO
3
and NaOH raw materials at 1:2 Li/Si molar ratio at 180 °C for 48 and 72 h, the main phase was Li
2
Si
2
O
5
[
25
]. In the present study, a hydrothermal route was explored successfully to synthesize nanostructure Li
2
SiO
3
powders in an aqua solution using Li
2
CO
3
and H
2
SiO
3
as raw materials.
In the present study, a hydrothermal route was explored successfully to synthesize nanostructure Li
2
SiO
3
powders in a mixture of Li
2
CO
3
, H
2
SiO
3
and NaOH at 2:3, 1:3, 1:4 and 1:5 Li/Si molar ratios. To the best of our knowledge, there is no report on the synthesis of nanostructure Li
2
SiO
3
crystallites by these raw materials and Li/Si molar ratios. The effects of Li/Si molar ratio on the final products in phase composition and particle morphology were investigated, and the band gap energy of the as-prepared Li
2
SiO
3
samples was initially estimated from UV–visible spectra. Also, cell parameter refinement and photoluminescence analysis of the obtained materials were studied.
Materials and methods
All chemicals were of analytical grade, obtained from commercial sources, and used without further purification. Phase identifications were performed on a powder X-ray diffractometer D5000 (Siemens AG, Munich, Germany) using CuKα radiation. Also, FT-IR spectra were recorded on a Tensor 27 (Bruker Corporation, Germany). Absorption and photoluminescence spectra were recorded on a Jena Analytik Specord 40 (AnalytikJena UK, Wembley, UK) and a PerkinElmer LF-5 spectrometer (PerkinElmer, Waltham, MA, USA), respectively. The morphology of the obtained materials was examined with a field emission scanning electron microscope (Hitachi FE-SEM model S-4160). Also, cell parameter refinement was reported by celref software version 3.
Experimental
In a typical synthetic experiment, 0.300 g (4.00 m mol) of Li
2
CO
3
(Mw = 73.82 g mol
−1
) and 1.06 g (8.69 m mol), 1.46 g (24.4 m mol), 1.95 g (32.0 m mol) or 2.44 g (40.6 m mol) of H
2
SiO
3
(Mw = 60.08 g mol
−1
) were added to 60 mL of hot aqueous solutions of 0.3 0.8, 1.06 or 1.4 M NaOH under magnetic stirring at 80 °C, respectively. The resultant solution was stirred further for 15 min. The resultant solution was transferred into a 100-mL Teflon lined stainless steel autoclave. The autoclave was sealed and heated at 180 °C 72 h. When the reaction was completed, it was cooled to room temperature by water immediately. The prepared powder was washed with distilled water and dried at 110 °C for 20 min under normal atmospheric conditions. Finally, it was allowed to cool slowly to room temperature to collect a white powder.
Results and discussion
Powder X-ray diffraction analysis
The crystal phases of the hydrothermally synthesized nanomaterials at 180 °C with different Li/Si molar ratios were examined by powder X-ray diffraction technique. As shown in Fig.
1
, with the Li/Si molar ratios of 2:3, 1:3, 1:4 and 1:5 in the reaction mixture, a pure highly crystalline phase of Li
2
SiO
3
(space group of Cmc2
1
[
10
,
21
–
24
]) is obtained after 72 h. Interplanar spacing (
d
) in the crystalline material was calculated via Bragg’s equation (
nλ
= 2
dhkl
sin
θ
). So, compared to nanoparticles of pure lithium silicates, with changing the Li/Si molar ratios from 2:3 to 1:5, the diffraction lines in the powder XRD patterns of the nanoparticles of lithium metasilicate shift to a higher 2
θ
values (Δ2
θ
= 18.82 (S
4
) − 18.80 (S
1
) = 0.02° and Δ
d
= 4.714526 Å (S
1
) − 4.70954 Å (S
4
) = 0.005 Å. So, according to above measurements, there is a contraction in the unit cell with changing the Li/Si molar ratio from 2:3 to 1:5. Also, the crystal sizes were calculated by Scherrer equation at the peak with the miller indices (200)
t=kλB1/2cosθ
where
t
is entire thickness of the crystalline sample,
λ
(0.154 nm) is the X-ray diffraction wavelength,
k
(0.9,
B1/2
) is the Scherrer constant and is of the full width at half its maximum (FWHM) intensity, and
θB
is the half diffraction angle at which the peak location is. The data summarized in Table
1
are in a good agreement with the interplanar spacing in the crystalline material measured via Bragg’s equation.
Fig. 1
PXRD patterns of the synthesized Li
2
Si
2
O
5
nanoparticles, where
a
(S
1
) is at 2:3 Li/Si,
b
(S
2
) is at 1:3,
c
(S
3
) is at 1:4, and
d
(S
4
) is at 1:5 Li/Si molar ratios
Table 1
Scherrer data information for pure Li
2
SiO
3
nanomaterials obtained after 72 h at 180 °C
Data information
2θ
θ value
B1/2 (°)
B1/2 (radian)
cosθb
Crystal size (nm)
S1
18.80
9.400
0.3193
0.00557
0.98657
25.20
S2
18.81
9.405
0.3190
0.00556
0.98655
25.25
S3
18.93
9.465
0.2754
0.00480
0.98639
29.25
S4
18.82
9.410
0.3193
0.00557
0.98654
25.22
Morphology analysis
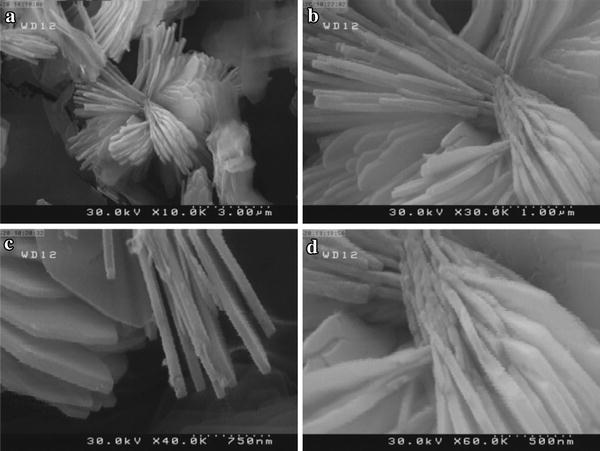
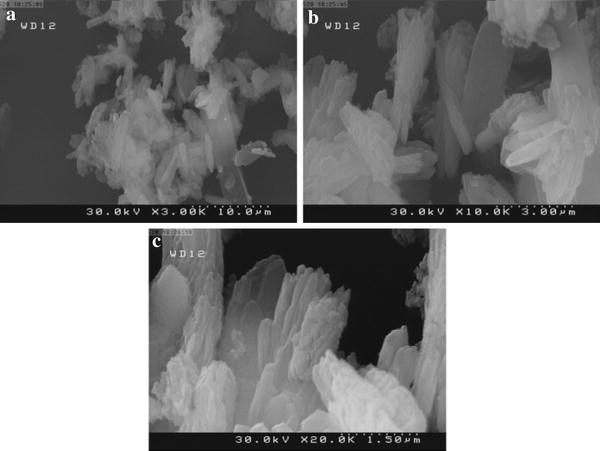
Figure
2
shows the FESEM images of lithium metasilicate nanomaterials (S
1
) after 72 h at 180 °C. Figure
2
a shows the low-magnification image of the obtained material. It shows that the morphology of the material is a flower structure. Figure
2
b, c shows that the petals of the flowers have a regular edge shape joined in a point until they form a flower structure. Figure
2
d shows the high-magnification image of the material. It shows that the petal thickness size is about 50 nm and the length size is about 2 µm.
Fig. 2
SEM images of the hydrothermally synthesized Li
2
SiO
3
nanomaterials obtained at 2:3 Li/Si molar ratio (S
1
) after 72 h at 180 °C
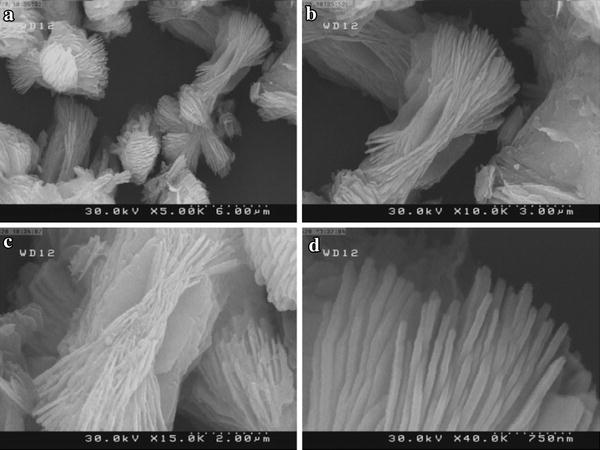
Figure
3
shows the FESEM images of lithium metasilicate nanomaterials (S
2
) after 72 h at 180 °C. With low magnification at Fig.
3
a, b, it is clear that with changing the Li/Si molar ratio from 2:3 to 1:3, the morphology of the obtained material changed to another kind of flower-like structure. It shows that the flowers are in straw bundle-like forms to which the petals join in a certain point. With high magnification in Fig.
3
c, d, it is obvious that the whole size of the flower is in about 5–7 µm, the petal thickness size is in about 60–70 nm, and the length size is in about 3 µm. Figures
2
and
3
show a general but different type of flower structure morphologies.
Fig. 3
SEM images of the hydrothermally synthesized Li
2
SiO
3
nanomaterials obtained at 1:3 Li/Si molar ratio (S
2
) after 72 h at 180 °C
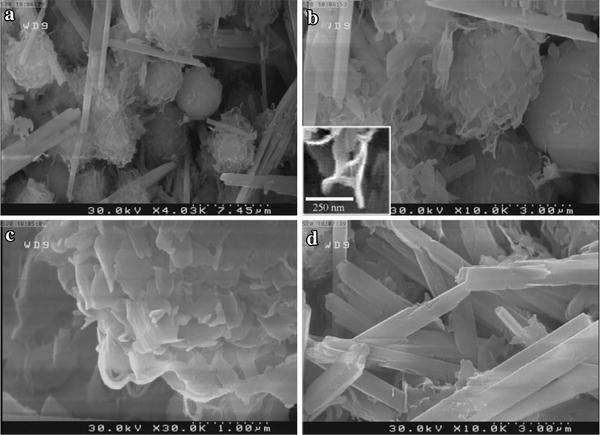
Figure
4
shows the FESEM images of the obtained materials (S
3
) after 72 h at 180 °C. It shows that with changing the Li/Si molar ratio, the morphology changed from flower-like structure to a mixture of morphologies. Figure
4
a shows the low-magnification image of the material. It shows that the material has formed from a mixture of microrod and microsphere structures. Figure
4
b, c shows that there are layer-like structures covered on the surface of the sphere particles. It shows that the sphere sizes are nearly homogenous and are about 2 µm. Also, the layer thickness sizes are about 50–70 nm (inset in Fig.
4
b). Figure
4
d clearly shows the rod-like structures. The thickness sizes of the rods are about 300–500 nm, and the length sizes are in about 5–8 µm.
Fig. 4
SEM images of the hydrothermally synthesized Li
2
SiO
3
nanomaterials obtained at 1:4 Li/Si molar ratio (S
3
) after 72 h at 180 °C
Figure
5
shows the FESEM images of the obtained materials (S
4
) after 72 h at 180 °C. It shows that with changing the Li/Si molar ratio to 1:5, the morphology changed from a mixture of sphere- and rod-like structure to a nearly layer-like structure with no certain orientation and regular shape. Figure
5
c shows that the layers have no regular edge shape and the thickness sizes are about 100–120 nm. According to the data, from Figs.
2
,
3
,
4
and
5
, by changing Li/Si molar ratio from S
1
to S
4
, it was found that the thickness of the flower petals is 50 nm for S
1
, 60–70 nm for S
2
, respectively; thickness of the rods is in about 300–500 nm for S
3
, and the thickness of the layer-like structure is about 100–120 nm. However, the crystal structure of the obtained materials is the same, and all of the obtained materials are pure phase. It shows that with decreasing the Li/Si molar ratio, the morphology of the obtained materials changed to a non-uniform structure and the thickness of the materials decreased.
Fig. 5
SEM images of the hydrothermally synthesized Li
2
SiO
3
nanomaterials obtained at 1:5 Li/Si molar ratio (S
4
) after 72 h at 180 °C
Table
2
shows the cell parameter refinement data of the obtained materials at different Li/Si molar ratios. It is clear that with changing the Li/Si molar ratio from 2:3 to 1:5, parameters a, b and c decreased. However, compared to S
4
, parameter b for S
3
is larger than that for S
4
and parameters a and c are smaller than those for S
4
.
Table 2
Cell parameter refinement plot of Li
2
SiO
3
showing an contraction along
a
and
b
directions in the unit cell
a
b
c
Standard sample (pdf number 14-0322)
9.3920
5.3970
4.6600
S1
9.3834
5.4018
4.6682
SD
0.0062
0.0032
0.0042
S2
9.3762
5.3998
4.6678
SD
0.0076
0.0035
0.0036
S3
9.3483
5.4039
4.6611
SD
0.0085
0.0035
0.0022
S4
9.3767
5.3996
4.6653
SD
0.0087
0.0039
0.0048
Optical properties
Figure
6
shows the pL spectra of the obtained materials. It is clear that with changing Li/Si molar ratio from 2:3 to 1:5, the emission spectra shift to higher wavelengths. So the sharpest peaks for S
1
, S
3
and S
4
are at 542, 547 and 549 nm, respectively.
Fig. 6
Photoluminescence spectra of the synthesized Li
2
SiO
3
nanomaterials (
λex
= 247 nm)
Figure
7
shows the Fourier transform infrared (FT-IR) spectra of the obtained materials S
1
and S
3
at 180 °C. The band at 416 and 520 cm
−1
can be assigned to the bending vibration of the O–Si–O bond, and the band at 733 cm
−1
is due to the symmetric stretching of Si–O–Si bond [
26
]. Besides, the peaks at 852.48 cm
−1
are assigned to Si–O–Si and O–Si–O stretching vibration. The band at 931 cm
−1
is known to be caused by the non-bridging oxygen stretching mode of the Si–O
−
[
27
,
28
]. And the band at 1101 cm
−1
is known to be caused by the asymmetric stretching mode of the Si–O–Si [
29
], and the peak at 3447.49 cm
−1
is assigned to O–H stretching vibration [
20
].
Fig. 7
FT-IR spectra of the synthesized Li
2
SiO
3
nanomaterials where
a
is S
1
and
b
is S
4
Figure
8
shows the UV–Vis spectra of the obtained materials at different Li/Si molar ratios. It is clear that with changing the Li/Si molar ratio from 2:3 to 1:5, there is a red shift in the absorption wavelength. A sharp absorption band at 275, 277 and 280 nm is observed, respectively, for samples a, b and c. According to the absorption electronic spectra, the band gap of the synthesized nanomaterials is calculated to be 4.50 eV (for S
1
), 4.47 eV (for S
3
) and 4.425 eV (for S
4
).
Fig. 8
UV–Vis spectra of the synthesized Li
2
SiO
3
nanomaterials where
a
is S
1
,
b
is S
3
, and
c
is S
4
Conclusion
In summary, lithium metasilicate nanomaterials were successfully synthesized by a simple hydrothermal method. We found that the Li/Si molar ratio has a major effect on the size, morphology and optical properties of the obtained products. According to the data, FESEM images showed that the morphology of as-prepared samples changed from flower structures to microrod–microsphere and then to a non-homogenous layer-like structure for S
1
to S
4
. Also, ultraviolet–visible spectra showed that the calculated band gaps decreased from S
1
to S
4
. Also, cell parameter refinement showed that with changing the Li/Si molar ratio from S
1
to S
4
, the cell parameters decreased. Photoluminescence analysis of the obtained materials at the excitation wavelength of 247 nm showed that the emission spectra of the obtained materials had a blue shift from S
1
to S
4
.
Acknowledgments
The authors express their sincere thanks to the authorities of Tabriz University for financing the project.
Lu and Cheng (2000) Reaction mechanism and kinetics analysis of lithium nickel oxide during solid-state reaction (pp. 1403-1419) 10.1039/a909130k
Subramanian et al. (2001) Microwave-assisted solidstate synthesis of LiCoO2 and its electrochemical properties as a cathode material for lithium batteries (pp. 3348-3353) 10.1039/b105008g
Pfeiffer et al. (2000) Sol–gel synthesis of Li2ZrSi6O15 powders (pp. 1255-1258) 10.1039/a908714a
Pfeiffer and Bosch (2005) Thermal stability and high-temperature carbon dioxide sorption on hexa-lithium zirconate (Li6Zr2O7) (pp. 1704-1710) 10.1021/cm047897+
Mosqueda et al. (2006) Nanoscale domain control in multiferroic BiFeO3 thin films (pp. 2307-2310) 10.1021/cm060122b
Pfeiffer et al. (2007) Thermal behavior and CO2 absorption of Li2−xNaxZrO3 solid solutions (pp. 922-926) 10.1021/cm0623965
Vinod and Bahnemann (2002) Materials for all-solid-state thin-film rechargeable lithium batteries by sol–gel processing (pp. 493-498)
Zhang and Easteal (2008) Effect of HNO3 on crystalline phase evolution in lithium silicate powders prepared by sol–gel processes (pp. 5139-5142) 10.1007/s10853-008-2736-5
Cruz et al. (2006) Kinetic analysis of the thermal stability of lithium silicates (Li4SiO4 and Li2SiO3) (pp. 909-911) 10.1016/j.jssc.2005.12.020
Nakazawa et al. (1998) Ab initio MO study on hydrogen release from surface of lithium silicate (pp. 571-574) 10.1016/S0022-3115(98)00426-7
Munakata and Yokoyama (2001) Ab initio study of electron state in Li4SiO4 crystal (pp. 915-921) 10.1080/18811248.2001.9715117
Taddia et al. (2005) Determination of macro-constituents in lithium zirconate for tritium-breeding applications (pp. 173-191) 10.1016/j.jnucmat.2004.09.011
Ortiz-Landeros et al. (2011) Surfactant-assisted hydrothermal crystallization of nanostructured lithium metasilicate (Li2SiO3) hollow spheres: (I) synthesis structural and microstructural characterization (pp. 1304-1311) 10.1016/j.jssc.2011.03.056
Tang et al. (2009) Synthesis and characterization of lithium silicate powders (pp. 2124-2130) 10.1016/j.fusengdes.2009.02.017
Mohamed Mahmoud et al. (2012) Crystallization of lithium disilicate glass using microwave processing (pp. 579-585)
Alemi et al. (2012) Hydrothermal synthesis, characterization, and investigation of optical properties of Sb3+-doped lithium silicates nanostructures (pp. 20-29) 10.1186/2228-5326-2-20
Gutierrez et al. (2008) Low temperature synthesis of Li2SiO3: effect on its morphological and textural properties10.1155/2008/908654
Alemi et al. (2013) Lithium metasilicate and lithium disilicate nanomaterials: optical properties and density functional theory calculations (pp. 14-25) 10.1186/2228-5326-3-14
Alemi and Khademinia (2014) Part I: lithium metasilicate (Li2SiO3): mild condition hydrothermal synthesis, characterization and optical properties (pp. 15-20) 10.1007/s40089-014-0131-6
Unknown ()
El-Alaily (2003) Study of some properties of lithium silicate glass and glass ceramics containing blast furnace slag (pp. 30-35)
Unknown ()
Efimov (1999) vibrational spectra, related properties and structure of inorganic glasses (pp. 95-118) 10.1016/S0022-3093(99)00409-3
Efimov (2005) Inrares reflection spectra, optical constants and band parameters of binary silicate and borate glasses obtained from water free polished sample surface 46(1) (pp. 20-27)