Preparation and characterization of Mn-doped ZnS nanoparticles

Abstract

Mn-doped ZnS nanoparticles are synthesized by simple and cost effective chemical precipitation method. This diluted magnetic semiconductor is characterized by various techniques such as energy dispersive X-ray analysis, scanning electron microscopy, X-ray diffraction, photoluminescence and UV–Vis spectroscopy. High purity of the sample is confirmed by energy dispersive X-ray analysis. Sub-micrometer nanocrystals are observed using scanning electron microscope. Hexagonal phase of the material is confirmed by X-ray diffraction studies, and the micro-structural properties such as grain size, strain, dislocation density and texture coefficient are examined. High value of texture coefficient indicates the well-crystalline nature of the material. The band gap, Urbach energy and steepness parameter are calculated from the absorption spectrum. The band gap is also calculated from photoluminescence. The Stokes’s shift, Urbach energy and steepness parameter are reported in the case of Mn-doped ZnS for the first time.


Introduction

Recent advances in nanotechnology and various quantum size effects in nano-scale particles imply that many novel devices of the future will be based on properties of nanomaterials [ 1 ]. Among II-VI semiconductors, ZnS, with unique optical properties and a direct band gap of 3.68 eV at room temperature, is one of the important materials with wide range of applications such as light emitting devices, laser devices, cathode ray tubes, non linear optical devices and antireflecting coatings [ 25 ]. In order to tune surface states, energy levels, electrical, optical and magnetic properties of semiconductor material, doping with proper element is widely used [ 6 ]. The research about diluted magnetic semiconductor (DMS) has attracted the attention of researchers since charge and spin degrees of freedom can be accommodated into a single material [ 6 ]. Transition metal-doped ZnS was prepared by several groups [ 610 ]. Different synthesis methods are available to prepare Mn-doped ZnS semiconductors such as chemical precipitation method, zeolite and vapor phase condensation method [ 11 ]. In this work, we report the micro-structural, morphological and optical studies of Mn-doped ZnS nanoparticles prepared by chemical precipitation method. The techniques such as energy dispersive X-ray analysis (EDX), scanning electron microscopy (SEM), X-ray diffraction (XRD), photoluminescence and UV–Vis spectroscopy are used to study its properties. Lack of data on Stokes’s shift, Urbach energy and steepness parameter of Mn-doped ZnS has been the driving force behind this work.

Experimental procedure

Mn-doped ZnS nanoparticles are prepared by chemical precipitation method. All the chemicals used in the process are analytical reagent (AR). A typical procedure for the synthesis is as follows: Zn(NO 3 ) 2 ·6H 2 O and MnCl 2 ·4H 2 O are weighted as per the stoichiometric ratio and dissolved in 100 ml of Deionized water to make 0.2 M of solution. Similarly, 0.2 M solution of Na 2 S is prepared. The solutions are taken in conical flask and the solution is constantly stirred. The Na 2 S solution is taken in burette and added dropwise to the mixture of Zn(NO 3 ) 2 ·6H 2 O and MnCl 2 ·4H 2 O. The resultant solution is stirred for about 15 h. After the completion of process, white color precipitate is obtained. The precipitate is washed several times with the help of ethanol and then dried at 250 °C for about 5 h. The dried Mn-doped ZnS nanoparticles are used to study its micro-structural, morphological and optical properties.

Results and discussion

Chemical compositional and morphological analysis

EDX is a very good tool to study the chemical composition of the material. Figure  1 shows the EDX spectrum of Mn-doped ZnS nanoparticles. The presence of Zn, Mn and S is confirmed and no impurity is observed in the spectrum. This indicates that the high purity of Mn-doped ZnS nanoparticles can be prepared by chemical precipitation method. Figure  2 
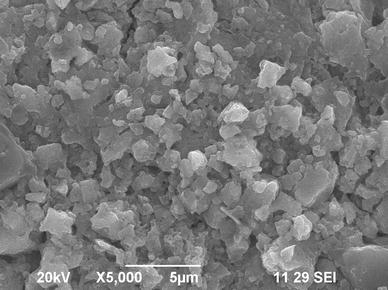
shows the SEM image of the synthesized nanoparticles. The images are recorded at 30 kV. The SEM photograph clearly indicates the formation of sub-micrometer crystallites and it shows the morphology of nearly spherical in nature.

Fig. 1

EDX spectrum

Fig. 2

SEM image

Micro-structural properties

XRD is a powerful tool to study the micro-structural properties of the nanomaterial. Figure  3 shows the XRD pattern of Mn-doped ZnS nanoparticles. The diffraction peaks show hexagonal phase of ZnS (JCPDS: 89-2201: Maximum intensity peak at 28.571°). No characteristic peaks of impurities are observed. Maximum intensity peak corresponds to the miller indices of (018). The deviation of the maximum intensity peak of (018) from 28.571° is due to Mn doping in Zn lattice.

Fig. 3

XRD pattern

The grain size of the material is found from Debye–Scherrer’s formula [ 10 ],

D=0.9λβcosθ
where λ is the wavelength of Cu-Kα line, β is full-width at half-maximum in radians and θ is Bragg’s angle. The dislocation density δ  = 1/ D 2 is calculated [ 10 ]. β cos θ is plotted against 2sin θ and the slope of the line gives the strain ε . The grain size of the material is also calculated using Williamson-Hall equation [ 12 ],
βcosθ=kλD+2εsinθ

The preferential crystal orientation is obtained from the texture coefficient (TC) and it is defined as [ 12 ],

TChkl=I(hkl)/I0(hkl)1/nI(hkl)/I0(hkl)
where n is the number of diffraction peaks considered, I(hkl) is the XRD intensity and I 0 (hkl) is the intensity of the XRD reference of the randomly oriented grains. The calculated results are tabled in Table  1 .

Table 1

Micro-structural properties of ZnS:Mn

Micro-structural properties

ZnS:Mn (4 %)

Grain size (Debye–Scherrer’s Formula)

21 nm

Dislocation density

2.204 × 1015/m2

Strain

0.0028

Grain size (Williamson-Hall equation)

27 nm

Texture coefficient

3.61

Grain size in the range of 20–30 nm is obtained by both Debye–Scherrer’s formula and Williamson-Hall equation. The texture coefficient indicates the crystalline nature of the material. The high value of the texture coefficient shows the well-crystalline nature of Mn-doped ZnS nanoparticles. The low value of grain size and high value of texture coefficient are due to Mn addition in ZnS.

Optical properties

The recombination of surface states brings about the photoluminescence (PL) of the materials [ 10 ]. The room temperature photoluminescence of the prepared Mn-doped ZnS nanoparticles is shown in Fig.  4 . The maximum intensity peak corresponds to the band gap of 3.50 eV.

Fig. 4

Photoluminescence spectrum

The optical absorption as a function of wavelength is the simplest way to study the size dependent optical properties of the material [ 13 , 14 ]. Figure  5 shows the absorption spectrum of Mn-doped ZnS nanoparticles. The sharp absorption edge indicates (i) the distribution of narrow grain size and (ii) the low concentration of defects in the material [ 15 ]. The maximum absorption is observed at the wavelength of 304 nm.

Fig. 5

Optical absorption spectrum

The absorption coefficient is related to the incident photon energy by the relation [ 12 , 16 ] αhν1/n=Ahν-Eg where E g is the band gap of the material and A is a constant. In order to determine the band gap of the direct allowed transition, the graph between αhν1/n and hν is plotted by setting n  = 1/2. The plot between ( αhν ) 2 and is shown in Fig.  6 . Extrapolating the straight line portion of the graph to the horizontal axis gives the value of the band gap and the calculated band gap is 3.0 eV.

Fig. 6

( αhν ) 2 vs.

The difference in the band gap calculated from photoluminescence and absorption spectrum is known as Stokes’s shift. In the case of 4 % Mn-doped ZnS nanoparticles, the Stokes’s shift is 0.5 eV. The Stokes’s shift is also observed in the case of Cr-doped ZnS nanoparticles [ 10 ].

The solution of the Schrödinger wave equation for an electron and a hole is used to model the electronic properties of semiconductor. According to the effective mass approximation with the Coulomb interaction term, the radius of the nanoparticles can be calculated using the relation,

EgN-EgB=h28R21me+1mh-1.8e24πεR
where EgN is the band gap of the nanoparticles, EgB is band gap of the bulk material, m e is the effective mass of an electron, m h is the effective mass of a hole and ε is the dielectric constant. The calculated grain size of the Mn-doped ZnS nanoparticles is 17 nm which coincides with the result obtained from XRD. The relationship between the absorption coefficient and the photon energy is given by [ 17 ],
α=α0exphνEU
where E U is the Urbach energy. The plot of ln( α ) vs. is shown in Fig.  7 . The reciprocal gradient of the straight line portion gives the value of Urbach energy [ 17 ] and the calculated value is 121 meV.

Fig. 7

ln( α ) vs.

The dependence of the optical absorption coefficient with the energy of the photon may be due to the electronic transition between localized states. The steepness parameter β can be calculated using the formula [ 17 , 18 ], β=kTEU where k is the extinction coefficient ( k  =  αλ /4 π ). The calculated value of the steepness parameter is 0.29 at 300 K. The calculated optical properties of Mn-doped ZnS are tabulated in Table  2 . Since the Urbach energy and steepness parameters are reported for the first time in the case of Mn-doped ZnS nanoparticles, no results are available to compare our results.

Table 2

Optical properties of ZnS:Mn

Optical properties

ZnS:Mn (4 %)

Band gap from PL

3.50 eV

Band gap from absorption spectrum

3.00 eV

Urbach energy

121 meV

Steepness parameter

0.29

Conclusion

The simple chemical precipitation is employed to prepare high purity of Mn-doped ZnS nanoparticles. High purity of the samples is confirmed by EDX. The morphological studies are reported. The micro-structural and optical properties are evaluated. Stokes’s shift, Urbach energy and steepness parameter are reported for Mn-doped ZnS nanoparticles for the first time. It is believed that this work will trigger the researchers in the field of diluted magnetic semiconductors.


References

  1. Sugunan et al. (2006) 10.1007/s10971-006-6969-y
  2. Yamamoto et al. (2002) 10.1002/1521-3951(200201)229:1<371::AID-PSSB371>3.0.CO;2-S
  3. Unknown ()
  4. Unknown ()
  5. Chen et al. (2001) 10.1016/S0040-6090(01)00912-9
  6. Unknown ()
  7. Jeon and Kang (2001) 10.1142/S0219581X02000565
  8. Khosic et al. (1995) 10.1063/1.114298
  9. Soni et al. (2009) Electrical and optical characteristics of Ni doped ZnS clusters 10.1016/j.matlet.2008.12.052
  10. Bruno Chandrasekar et al. (2013) 8(4) 10.1166/jno.2013.1481
  11. Zinki and Verma (2008) 10.1007/s10853-008-2818-4
  12. Unknown ()
  13. Amirjani et al. (2014) 10.1016/j.colsurfa.2013.12.033
  14. Amirjani et al. (2014) 10.1007/s40089-014-0108-5
  15. Unknown ()
  16. Unknown ()
  17. Yakuphanoglu et al. (2007) 9(7)
  18. Ilican et al. (2008) 10(10)