We theoretically investigate the optical forces generated by a high near-field resolution antenna system through finite difference time domain calculations along with the Maxwell stress tensor method. Our antenna choice is bowtie-shaped nanostructures with small gap regions, exploiting propagating waveguide modes as well as localized surface plasmons. Our analysis shows that the antenna system supports large optical forces at the resonance wavelength where the near-field intensities as well as their gradients are the largest within the gap region. We show that the system exhibits much larger optical forces when the incident light polarization is along the bowtie gap as the system can effectively leverage the gap effect, compared to the case when the system is under the polarization normal to the gap. We also investigate the forces on a dielectric bead in the vicinity of the antennas for different positions to show the optical force characteristics of the bowtie-shaped antennas. Finally, the force analysis on different bead radiuses demonstrates the trapping efficiency of our antenna system.
Introduction
Controlling atoms and particles leads to coping with fundamental questions in nanoscience [
1
–
3
]. In that sense, optical tweezers provide an efficient way to control nanometer size particles [
4
]. The precise control of these nanoparticles leads to revolutionary applications in biosensing field, e.g., manipulation of viruses or bacteria [
5
]. Various optical manipulation methods have been developed utilizing conventional optical trapping techniques [
6
,
7
]. However, these techniques suffer from diffraction limit as well as Brownian motion of the particles that need to be trapped [
8
,
9
]. Recently, plasmonic antenna systems have been offered to overcome these limitations [
10
,
11
]. These antennas enable controlling light at nanometer scale with large local electromagnetic field enhancements [
12
–
14
]. Having this field generation capability with large enhancements and sharp gradients, plasmonic antennas led to the manipulation of nanometer-size particles with low power while overcoming the Brownian motion [
15
]. Recently, bowtie antennas have received significant attention as they can generate large field enhancements and light confinement within nanometer-scale gaps through the excitation of localized surface plasmons (LSPs) and propagating waveguide modes [
16
]. Their near-field resolution capability provides large field gradients leading to strong optical forces, which is highly advantageous for high-precision manipulation of nanoparticles [
18
,
19
].
In this article, we theoretically investigate the optical forces generated by bowtie antennas in detail using finite difference time domain (FDTD) calculations. We show that large optical forces are generated at the resonance wavelength of the plasmonic mode supported by the bowtie-shaped antenna, where the near-field intensities and their gradients are the largest within the gap region. We show that the antennas support larger optical forces when the incident light polarization is along the bowtie gap compared to the case, where they are under the polarization perpendicular to the gap, as the antenna system effectively exploits the gap region for creating large-gradient local electrometric fields. We investigate the optical forces on a dielectric spherical bead for different radiuses and locations with respect to the antennas to map the optical trapping capability of the bowtie-shaped nanostructures.
Methods
Figure
1
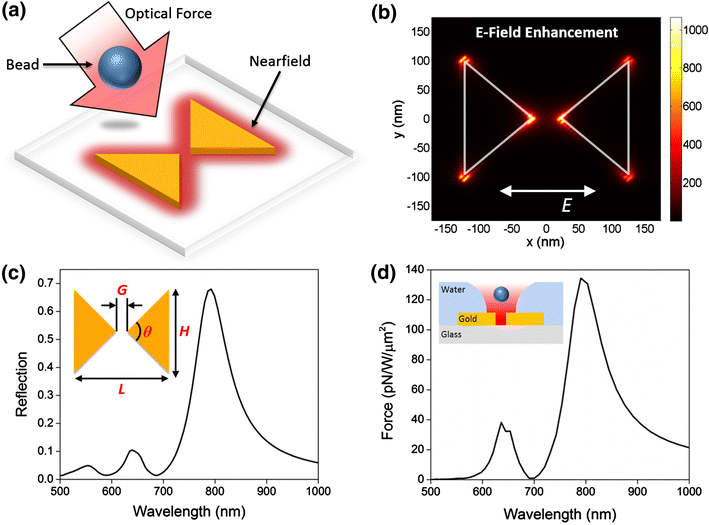
a shows the schematic illustration of the optical trapping system based on bowtie-shaped antennas with a small gap region for strong near-field intensities with large field gradients. We calculate the optical forces exerted by the antennas on a dielectric spherical bead with a refractive index of
nbead
= 1.4 through FDTD simulations. We assume that the antenna system is embedded in DI water with a refractive index of
nwater
= 1.33. Figure
1
c shows the reflection response of the bowtie antenna with gap,
G
= 50 nm, height,
H
= 200 nm, length,
L
= 250 nm and the tip angle,
θ
= 90
o
(the device parameters are depicted in Fig.
1
c inset). The antenna system is composed of gold with a thickness of 30 nm standing on a glass layer. In the simulations, the dielectric constants of gold and glass layers are taken from Ref. [
20
]. In the simulations, the mesh size is chosen to be 2 nm along the
x
-,
y
- and
z
-directions with extreme convergence conditions. For our optical force calculations, we focus on the strong optical response spectrally locating at ~793 nm (Fig.
1
c). As shown in Fig.
1
b, at this resonance wavelength under an
x
-polarized light source, the bowtie antenna supports large electromagnetic fields with an intensity enhancement factor (
|E|2
/
|Einc
|
2
) as large as ~1,050, which is calculated at the gold/glass interface (bottom antenna surface), as the local electromagnetic fields are maximum at this interface. This large field enhancement is due to the excitation of LSPs within the gap region as well as the propagating waveguide modes supported by the antenna system, which strongly amplifies near fields and the optical reflection.
Fig. 1
a
Schematic illustration of the bowtie antenna system where the optical forces are calculated on a dielectric spherical bead in the vicinity of the antenna system. Here, the highly enhanced local fields with large gradients generate optical forces attracting the bead toward the antennas.
b
Electric field intensity enhancement (
|E|2
/
|Einc
|
2
) distribution along the gold/glass interface calculated at the resonance wavelength of the bowtie response (~793 nm) under an
x
-polarized light source (depicted in the figure with a
white arrow
).
c
Calculated reflection response of the bowtie antenna embedded in DI water under an
x
-polarized light source.
d
Optical force calculated on the dielectric bead with 15 nm radius, locating 5 nm above the top surface of the antenna and positioned at the
center
. Figure
inset
illustrates the position of the bead with respect to the antenna embedded in DI water. The corresponding device parameters are
G
= 50 nm,
H
= 200 nm,
L
= 250 nm, and
θ
= 90
o
and the gold thickness of the bowtie antenna is 30 nm
Results and discussion
Optical force calculation using Maxwell stress tensor
The time-averaged optical force acting on the dielectric bead is calculated using Maxwell stress tensor (MST) method. The net force is determined by integrating MST over a volume (in this case, a cube surrounding the beads) as shown in Eq. (
1
)
where
is the unit vector normal to the surface,
S
and each elements of MST is calculated as in Eq. (
2
)
Figure
1
d shows the optical force on the spherical bead with a radius of 15 nm where the bead stands 5 nm above the top surface of the bowtie antenna (the edge-to-edge distance between the top surface of the bowtie antenna and the bottom surface of the dielectric bead). Importantly, the resemblance of (i) the spectral response of the bowtie antenna (Fig.
1
c), which relies on the near-field intensity enhancement value calculated at the bowtie gap for different wavelengths (not shown here) and (ii) the behavior of the exerted optical force on the dielectric bead by the bowtie antenna with respect to wavelength (Fig.
1
d) demonstrates the fact that the optical forces strongly vary with the large local electromagnetic fields and their gradients generated by the bowtie gap. Here, the dielectric bead is attracted along the gradient to the region of the strongest electric field, in order words, the gradient forces tend to attract the bead to the region of the highest near-field intensity [
17
]. Consequently, the largest optical force is observed at the resonance wavelength of the plasmonic mode (~793 nm), where the near-field intensities as well their gradients are the largest. Here, we calculate the optical force as large as
F
= 134.4 pN/W/µm
2
which is a quite suitable number for optical trapping applications.
Polarization effect
For creating strong optical responses, large field intensity gradients are essential. For a
y
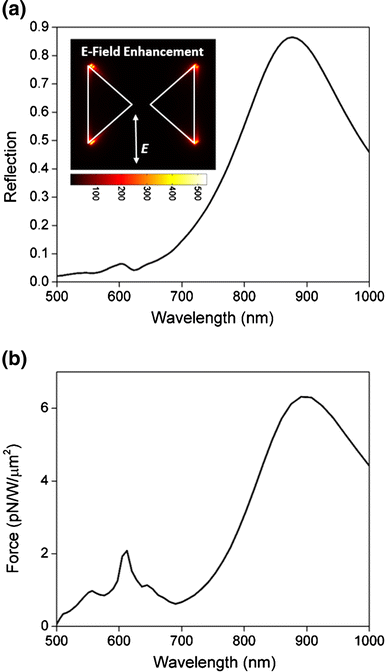
-polarized light source, the bowtie gap provides a coupling between two triangle-shaped gold particles such that the antenna system still exhibits a strong light reflection response as shown in Fig.
2
a [
16
]. However, the near-field intensity enhancement distribution (Fig.
2
a inset) calculated at the resonance wavelength of the bowtie response (~876 nm) demonstrates that rather than collimating around the gap region, the local electromagnetic fields are concentrated only at the side walls. Hence, the system is not able to exploit the gap effect which plays the dominant role for the near-field resolution, thus the optical trapping forces. Consequently, for the same configuration (analyzed in Fig.
1
d), the optical force is only
F
= 6.3 pN/W/µm
2
when the antenna system is under a
y
-polarized light source (Fig.
2
b), which is 20-folds smaller compared to the optical force for the case, where the antenna system is under an
x
-polarized light source.
Fig. 2
a
Calculated reflection response of the bowtie antenna embedded in DI water under a
y
-polarized light source. Figure
inset
shows the electric field intensity enhancement (
|E|2/|Einc
|
2
) distribution along the gold/glass interface calculated at the resonance wavelength of the bowtie response (~876 nm) under a
y
-polarized light source (depicted in the figure inset with a
white arrow
).
b
Optical force calculated on the dielectric bead, positioned at
center
and 5 nm
above
the surface of the bowtie antenna under a
y
-polarized light source. The corresponding device parameters are
G
= 50 nm,
H
= 200 nm,
L
= 250 nm,
θ
= 90
o
and the gold thickness of the bowtie antenna is 30 nm
Force analysis on different bead positions
For the bowtie-shaped antenna under an
x
-polarized light source, the near-field gradients are symmetric along the
x
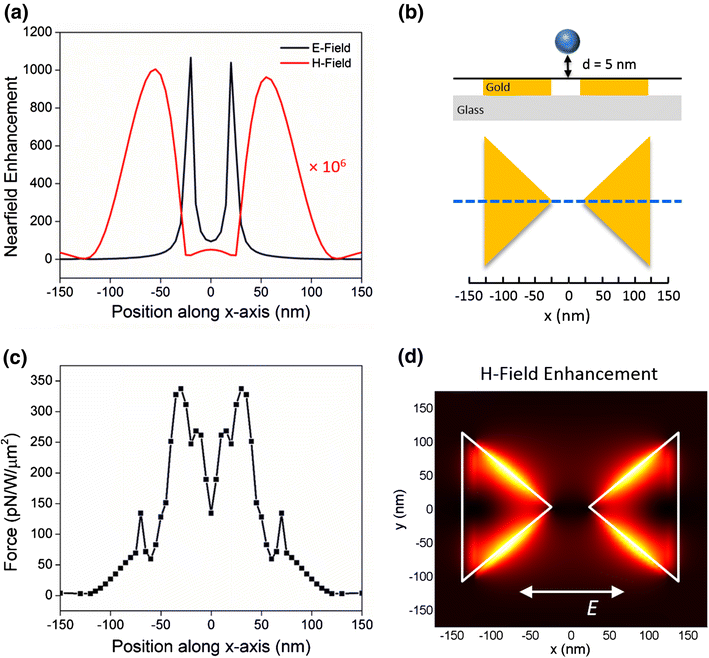
-direction as the most of the local electromagnetic fields are concentrated within the gap region. Figure
3
a shows the electric (black curve) and magnetic (red curve) field intensity enhancement distribution along the
x
-direction (at
xy
-plane, where
y
= 0 as schematically shown in Fig.
3
b-bottom with a blue, dashed line) obtained from Fig.
1
b and Fig.
3
d, which demonstrates the magnetic field intensity enhancement distribution,
|H|2/|Hinc
|
2
, calculated at the resonance wavelength of the reflection response (~793 nm). Here, both electric and magnetic field gradients are high as they drop sharply within only 50 nm distance along the polarization direction. Figure
3
c shows the calculated force (on the same dielectric bead with 15 nm radius), where the
x
-axis of the curve denotes the location of the center of the dielectric bead along the
x
-direction (the edge-to-edge distance between the top surface of the bowtie antenna and the bottom surface of the dielectric bead is
d
= 5 nm, as schematically illustrated in Fig.
3
b-top). As expected, optical force is the largest at
x
= 30 nm as the electric field intensity gradients (black curve in Fig.
3
a) are maximum, where we calculate the optical force as large as
F
= 337.4 pN/W/µm
2
. After
x
= 30 nm, optical forces decrease with distance due to the sharp reduction in the electric field intensities as well as their gradients. Along this gradual decrease in the force, we observe a peak at
x
= 70 nm, where the optical force is as large as
F
= 134.4 pN/W/µm
2
. This rapid increase in the force is due to the presence of the large gradients in the magnetic field at this location (red curve in Fig.
3
a) demonstrating the fact that the optical forces are created through the combination between the strength of both electric and magnetic fields created by the plasmonic substrate. Here, the peak calculated at
x
= 70 nm (mainly due to the magnetic field gradient) in the optical force versus bead position along the
x
-direction curve is smaller compared to what we observe at
x
= 30 nm (mainly due to the electric field gradient), as the gradient in the electric field is larger than the one in the magnetic field. Importantly, Fig.
3
c also reveals that the optical forces are much stronger when the dielectric bead becomes closer to the tips of the bowtie gap where the local electromagnetic fields as well as their overlap with the dielectric bead are the largest.
Fig. 3
a
Electric (
|E|2/|Einc
|
2
,
black curve
) and magnetic (
|H|2/|Hinc
|
2
,
red curve
) field intensity enhancement distribution along the
x
-direction at
xy
-plane, where
y
= 0.
bTop figure
cross-sectional schematic illustration of the bead position with respect to the antenna.
Bottom figure
location at the
xy
-plane, where the electric and magnetic fields are collected for the optical force calculation.
c
Optical forces calculated along the
x
-direction at
y
= 0.
d
Magnetic field intensity enhancement (
|H|2/|Hinc
|
2
) distribution along the gold/glass interface calculated at the resonance wavelength of the bowtie response (~793 nm) under an
x
-polarized light source (depicted in the figure with a
white arrow
). The corresponding device parameters are
G
= 50 nm,
H
= 200 nm,
L
= 250 nm,
θ
= 90
o
and the gold thickness of the bowtie antenna is 30 nm
Figure
4
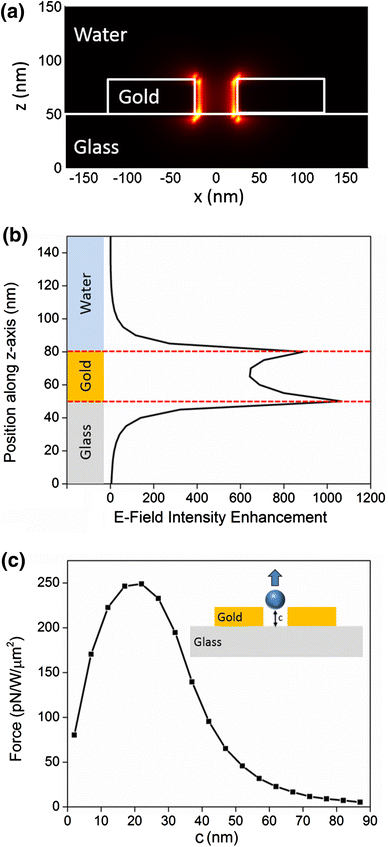
a shows the cross-sectional (along the
xz
-plane) profile for the electric field intensity enhancement distribution (at
y
= 0) calculated at the resonance wavelength of the plasmonic mode (~793 nm) supported by the bowtie-shaped antenna. Here, the highly enhanced local fields mainly concentrate at the antenna walls and decrease along the
x
-direction within the gap region. Figure
4
b shows the electric field intensity enhancement distribution along the wall of the bowtie antenna (through the
z
-direction, where
x
= 25 nm), which demonstrates that the strongly concentrated local electromagnetic fields extend deep into the water and glass medium and gradually decrease with the distance along ±
z
-direction. Within the gap region, electric field intensity is maximum at the two tip ends, where the electric field at the bowtie tip along the glass–gold interface is greater than the one along the water–gold interface as the refractive index of glass (
nglass
= 1.42) is greater than that of water (
nwater
= 1.33). Along the
z
-direction, from the top surface of the bowtie antenna to the center, electric field intensity decreases, and starts to increase until the bottom surface of the antenna. Hence, the near-field intensity gradients are large within the gap region. As schematically shown in Fig.
4
c-inset, the dielectric bead with 15 nm radius is placed at the center of the bowtie antenna and moved along the
z
-axis. Figure
4
c shows the calculated optical forces generated by the bowtie-shaped antenna with respect to the distance between the bottom surface of the bead and the top surface of the glass layer (indicated with
c
in the figure inset). Following the behavior of the electric field gradients along the
z
-direction, optical forces rapidly increase from bottom to top surface of the antenna with distance,
c
, and gradually decrease after the bowtie antenna as the near-field gradients diminish. Hence, this exponential optical force distribution at the distance along the propagation direction (
z
) reveals the fact that the forces exerted by the bowtie antenna become much larger when the dielectric bead is close to the gap region. Consequently, the dielectric bead closer to the bowtie structures is attracted more by the antenna system compared to the others.
Fig. 4
Cross-sectional profile of the electric field intensity enhancement (
|E|2/|Einc
|
2
) distribution
a
along the
xz
-plane at
y
= 0 and
b
along the
z
-axis at (
x
= 25 nm,
y
= 0)
c
optical forces calculated along the
z
-direction at (
x
= 0,
y
= 0) for different distances,
c
, from the
top
surface of the glass layer. The corresponding device parameters:
G
= 50 nm,
H
= 200 nm,
L
= 250 nm,
θ
= 90
o
and the gold thickness of the bowtie antenna is 30 nm
Force analysis on beads with different radius
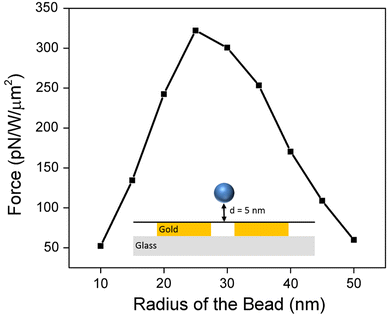
Figure
5
shows the optical forces calculated at different dielectric beads with various radiuses in the range between 10 and 50 nm, where the beads are standing
d
= 5 nm above the top surface of the antenna as schematically illustrated in the figure inset. Here, we observe that the optical forces are maximum when the radius is 25 nm. This result shows that the antenna system can trap beads within this radius range with optical force values between
F
~ 50 pN/W/µm
2
and ~350 pN/W/µm
2
while for the larger beads, the forces would not be sufficient to manipulate optically.
Fig. 5
Optical forces calculated at the dielectric spherical beads with different radiuses, where the beads are located 5 nm above the
top
surface of the bowtie antenna and positioned at the center. The corresponding device parameters are
G
= 50 nm,
H
= 200 nm,
L
= 250 nm,
θ
= 90
o
and the gold thickness of the bowtie antenna is 30 nm
Conclusions
In conclusion, we investigate optical forces exerted by bowtie-shaped antennas in detail using finite-difference time-domain calculations and Maxwell stress tensor method. The antenna system supports large local electromagnetic fields with strong gradients within the gap region due to the generation of localized surface plasmons as well as propagating waveguide modes. We show that at the resonance wavelength of the antenna response, where the local electromagnetic fields are larger, the antenna system exerts stronger optical forces on dielectric beads in the vicinity of the antennas, overlapping with the near fields. Consequently, the antenna system exhibits larger optical forces when the incident light polarization enables to leverage the nanoscale gap region effect, which dramatically enhances the local fields. Our force analysis using a dielectric spherical bead for different positions along the propagation and polarization directions reveals that dielectric beads in the vicinity of the antenna system are effectively trapped by the optical forces within the gap region at the bowtie tip ends. Our investigation of the trapping forces on a dielectric bead with different radiuses on various positions also provides us a fine-tuning mechanism for the optical forces. We believe that this antenna system enabling large localized fields with steep near-field gradients will lead to strong and compact optical tweezer configurations.
Acknowledgments
A.E. Cetin greatly acknowledges Ecole Polytechnique Federale de Lausanne (EPFL).
References
Ashkin et al. (1986) Observation of a single-beam gradient force optical trap for dielectric particles10.1364/OL.11.000288
Lewis et al. (2003) Near-field optics: from subwavelength illumination to nanometric shadowing10.1038/nbt898
Eigler and Schweizer (1990) Positioning single atoms with a scanning tunnelling microscope10.1038/344524a0