Magnetic solid phase adsorption, preconcentration and determination of methyl orange in water samples using silica coated magnetic nanoparticles and central composite design

Abstract

This work evaluates the efficiency of SiO 2 -coated Fe 3 O 4 magnetic nanoparticles (SMNPs) for adsorption of methyl orange (MO). Adsorption of MO on the studied nanoparticle was developed for removal, preconcentration and spectrophotometric determination of trace amounts of it. To find the optimum adsorption conditions, the influence of pH, dosage of the adsorbent and contact time was explored by central composite design. In pH 2.66, with 10.0 mg of the SMNPs and time of 30.0 min, the maximum adsorption of MO was obtained. The experimental adsorption data were analyzed by the Langmuir and Freundlich adsorption isotherms. Both models were fitted to the equilibrium data and the maximum monolayer capacity q max of 53.19 mg g −1 was obtained for MO. Moreover, the sorption kinetics was fitted well to the pseudo-second-order rate equation model. The results showed that desorption efficiencies higher than 99 % can be achieved in a short contact time and in one step elution by 2.0 mL of 0.1 mol L −1 NaOH. The SMNPs were washed with deionized water and reused for two successive removal processes with removal efficiencies more than 90 %. The calibration curve was linear in the range of 10.0–120.0 ng mL −1 for MO. A preconcentration factor of about 45 % was achieved by the method.


Introduction

In most cases, dyes are responsible for color in wastewaters generated from textile and dye manufacturing industries [ 1 ]. It should be noted that the contamination of drinking water by dyes at even low concentrations can color it and make it unsuitable for human consumption [ 1 ]. Therefore, it is important in environmental science to determine and remove dye from polluted waters.

Methyl orange (MO) is an anionic dye and belongs to the azo dye group. The azo group of dyes contains nitrogen. MO has been widely used in industries such as textile, printing, paper, pharmaceutical and food [ 2 ]. Since the azo dyes are very stable, it is very difficult to remove them from wastewater by chemical and biological degradation methods. Moreover, although most of dyes are not highly toxic, they should be detected and determined in different water samples.

Adsorption has been found to be superior to the other techniques for removal of colors, odors, oils and organic pollutants from process or waste effluent treatments in terms of initial cost, simplicity of design and ease of operation [ 3 ]. MO adsorption on zeolites [ 49 ], magnetic materials [ 1012 ] and other adsorbent [ 1319 ] has been studied. However, the most commonly used adsorbent for color removal is activated carbon [ 20 ] because of its capability for efficient adsorption of a broad range of compounds. The main disadvantage of the activated carbon is its high production and treatment costs [ 20 ]. Deficiencies like relatively low adsorption capacities or need for relatively long adsorption contact times can also be mentioned for some of the other adsorbents. Therefore, it is desired to develop effective adsorbents for the removal of toxic species from aqueous solutions.

Magnetic nanoparticles (MNPs) are known as efficient adsorbents with large specific surface area and small diffusion resistance [ 21 , 22 ]. The magnetic separation provides a suitable route for online separation [ 23 ]. MNPs can quickly be removed along with adsorbed compound from a matrix using a magnetic field [ 24 ].

Numerous chemical methods can be used to synthesis MNPs such as microemulsions [ 25 ], sol–gel [ 26 ], sonochemical reactions [ 27 ], hydrolysis and thermolysis of precursors [ 28 ], flow injection [ 29 ] and electrospray [ 30 ]. Silica has been considered as one of the most ideal shell materials for MNPs due to its chemical stability and versatility in surface modification via Si–OH groups [ 24 ].

In this study, SiO 2 -coated Fe 3 O 4 magnetic nanoparticles (SMNPs) were synthesized and employed for preconcentration of MO in water samples followed by its determination by spectrophotometric method. It is the first time that magnetic nanoparticles coated with SiO 2 have been used to adsorb MO. Moreover, experimental design was used to obtain optimum conditions of adsorption. Analytical studies have also been performed. The method can be viewed as a potential method for removal of MO in contaminated waters. The kinetics of the adsorption of MO onto the SMNPs was investigated.

Experimental

Reagents and materials

All chemicals and reagents used in this work were of analytical grade. Iron nitrate Fe(NO 3 ) 3 ·9H 2 O (99 %), tetra ethoxy silane (TEOS) (98 %) and oxalic acid H 2 C 2 O 4 ·2H 2 O were purchased from Merck (Darmstadt, Germany). MO was prepared from Merck (Darmstadt, Germany). Structural formula of MO has been shown in Scheme  1 . Double distilled water was used throughout the study. The 200.0 mg L −1 stock solution of MO was prepared in double distilled water and experimental solutions of the desired concentrations were obtained by successive dilutions of the stock solution with double distilled water. The initial pH was adjusted with 0.1 mol L −1 solutions of HCl or NaOH. All the adsorption experiments were carried out at room temperature.

Scheme 1

Structural formula of methyl orange

Instrumentation

Recording spectra was performed by an Agilent model 8453 spectrophotometer with diode array detector. A Jenway 3345 ion-meter was used for pH measurements.

A Philips X′ Pert (40 kV, 30 mA) X-ray diffractometer, using a Cu Kα radiation source ( λ  = 1.542 Å) and a nickel filter in the 2 θ range of 4°–70° was used to record X-ray diffractometer (XRD) pattern of the calcined sample.

The specific surface area (using BET and BJH methods), the total pore volume and the mean pore diameter were measured using a N 2 adsorption–desorption isotherm at liquid nitrogen temperature (−196 °C) using a NOVA 2200 instrument (Quantachrome, USA). Prior to the adsorption–desorption measurements, all the samples were degassed at 110 °C in a N 2 flow for 3 h to remove the moisture and other adsorbates.

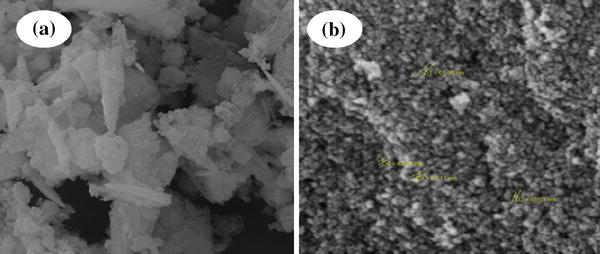
The morphologies of the prepared nanoparticles and their precursors were observed by means of an EM-3200 scanning electron microscope (KYKY CO., China).

For recording FTIR spectrum, an Alpha FTIR spectrometer (Bruker, Germany) was employed.

Dye adsorption experiments

Batch-mode adsorption studies were carried out by adding 10.0 mg adsorbent and 10.0 mL dye solution of known concentration (1.0 mg L −1 ) to a beaker. Then, pH of the solutions was adjusted to the desired value. The mixture solutions were shacked for appropriate adsorption time at 25 °C. After dye adsorption, SMNPs were quickly separated from the sample solution using a magnet. The following equation was used to calculate the dye adsorption efficiency in the treatment experiments: where Ci and Cr are the initial and residual concentrations of the dye in the solution, respectively.

Synthesis of SiO2-coated Fe3O4 magnetic nanoparticles

The SMNPs were prepared using sol–gel method [ 3133 ]. For preparation, 5.252 g of Fe(NO 3 ) 3 ·9H 2 O, 2.395 g of H 2 C 2 O 4 ·2H 2 O and 4.5 mL of TEOS were separately dissolved in ethanol. These solutions were heated up to 50 °C and stirred for 20 min. TEOS was added to the iron nitrate followed by addition of oxalic acid under strong stirring at 60 °C for 2 h. The precipitate composed of iron oxalate and TEOS is progressively hydrolyzed by hydration water of iron nitrate and mainly oxalic acid, according to the following scheme:

In acidic conditions (pH ≈ 1), Si(OH) 4 is condensed with other materials to a homogeneous gel. The monolithic gel was dried at 110 °C in vacuum for 16 h. Finally, the dried powder was calcined at 450 °C for 6 h to produce solid magnetic nanoparticle.

Results and discussion

Characterization of the SiO2-coated Fe3O4 magnetic nanoparticles

We began characterization studies of the synthesized MNPs with XRD technique. XRD pattern of the synthesized MNPs have been shown in Fig. 1 . The background of XRD pattern was subtracted from 2 θ  = of 4°–70° with smoothing of 50 %. Smoothing of 50 % means that the intensities of the all peaks have been decreased by 50 % in comparison with the original peaks. The peak positions and width were determined with Match 1.11b software. We assigned XRD pattern according to the data of JCPDS for detection of the actual phases and we added the label for all phases in the XRD pattern. The phases identified based on the XRD studies for this sample were cubic Fe 2 SiO 4 . Widths of all major peaks in XRD pattern were determined and the average was used for calculation of the size of the crystallite of the synthesized sample by Debye–Scherrer equation [ 34 ]: where β is the breadth of the observed diffraction line at its half intensity maximum, K is the so-called shape factor which usually takes a value of about 0.9 and λ is the wavelength of the X-ray source used in the XRD. Using the above equation, the mean crystallite size ( D c ) of the synthesized MNPs was calculated to be 48 nm.

Fig. 1

XRD pattern of the magnetic SiO 2 -coated Fe 3 O 4 nanoparticles

The FTIR spectrum of the synthesized MNPs was recorded and shown in Fig.  2 . The spectrum shows the core shell of the particles with Si–O on the surface. The Broad peak at 3,447 cm −1 could be correlated to the vibration of structural OH [ 35 ]. The bands at 1,083, 800 and 452 cm −1 are attributed to the asymmetric Si–O–Si stretching vibration, the symmetric Si–O–Si stretching vibration and the O–Si–O shearing vibration, respectively [ 36 , 37 ]. The bands around 1,000 cm −1 were assigned to the asymmetric Fe–O–Si stretching vibration [ 36 , 38 , 39 ]. These results suggested that the Fe–SiO 2 interaction exists in the catalyst in the form of Fe–O–Si structure. The band at 551 cm −1 can be assigned to the Fe–O stretching in Fe–O–Si bonds [ 35 ].

Fig. 2

The FTIR spectrum of the synthesized magnetic nanoparticles

To reveal the fine details of the structure of the synthesized MNPs, SEM study of both precursor and calcined SMNPs was performed. The SEM images recorded are shown in Fig.  3 . The image obtained from the precursor depicts several larger agglomerations of particles (Fig.  3 a) and shows that this material has a less dense and homogeneous morphology. After calcination at 450 °C for 6 h and heating rate of 3 °C min −1 , the morphological features became different from the precursor sample and the agglomerate size reduced greatly (Fig.  3 b). It may be attributed to the covering of calcined magnetic nanoparticle surface by small crystallite of SiO 2 , in agreement with XRD results.

Fig. 3

The SEM image of SMNPs a precursor and b calcined sample

Central composite design for optimization of the factors

In experimental design, the level of all factors is changed from one experiment to the next, simultaneously. The reason for this is that factors can interact with each other and the ideal value for one of them can depend on the values of the others. In this work, we used central composite design (CCD). CCD as an experimental design method is commonly used for process analysis and modeling [ 40 , 41 ]. It is assumed that the central point for each factor is 0, and the design is symmetric around this [ 42 ]. CCD including the factors, their levels and the result of each experiment is shown in Table  1 . Before performing experimental design, preliminary tests showed that in longer times, the adsorption of the dye is higher. Therefore, 20 min was used as the lower limit of the time for designing experiments. Concentration of dye in these experiments was 1.0 mg L −1 .

Table 1

Central composite design and the results of experiments

Factor

Level

1

0

−1

t (min)

120

70

20

mgMNP

10

5.5

1

pH

5

3

1

Run order

t (min)

mgMNP

pH

% Removal

Central composite design

 1

120

10

1

36.77

 2

70

5.5

3

44.47

 3

120

10

5

3.23

 4

70

10

3

90.00

 5

70

5.5

5

2.25

 6

20

10

5

2.95

 7

20

5.5

3

43.22

 8

70

5.5

3

44.95

 9

120

1

5

1.05

 10

70

5.5

3

43.94

 11

70

1

3

9.25

 12

120

5.5

3

45.25

 13

20

1

5

0.85

 14

70

5.5

1

11.80

 15

70

5.5

3

44.93

 16

120

1

1

0.68

 17

70

5.5

3

42.55

 18

20

1

1

0.63

 19

70

5.5

3

43.90

 20

20

10

1

2.98

The experiments in Table  1 were performed and their experimental responses were obtained. Here, the percent of the adsorption of MO on the adsorbent was used as experimental response. Analysis of variance for the results has been collected in Table  2 . It can be inferred from the results of ANOVA in Table  2 that pH is significant factor in the adsorption of MO at 95 % confidence level (its p value is smaller than α  = 0.05 for 95 % confidence level and t _statistics = 4.38). Parameter “ p ” is the probability (from 1) factor that affects the response by chance. Therefore, the lower is p , the more significant is the factor. This is compared with a critical value such as 0.05 (for 95 % confidence level). The statistical parameter “ t_ statistics” for a factor is calculated by dividing its estimated coefficient to its standard error. Therefore, a larger value of t_ statistics shows the significance of the corresponding factor. Among the parameters studied, mgMNP has the least influence in the adsorption of MO on the MNPs ( p  ≫ 0.05). Time ( t ) is not also an important factor. This was experimentally observed. Among the squared and interaction terms, pH × pH is statistically important based on the p values. The F value of the regression is relatively high ( F  = 5.11, p  = 0.001). This indicates that the regression is significant.

Table 2

Analysis of variance of the experiments in Table  1

Term

Coefficient

t_statistics

p

Constant

−66.592

−2.79

0.019

t

0.220

0.41

0.693

mgMNP

1.145

0.21

0.838

pH

62.593

4.38

0.001

t × t

−0.0009

−0.25

0.804

mgMNP × mgMNP

0.155

0.35

0.730

pH × pH

−9.865

−4.46

0.001

t × mgMNP

0.018

0.82

0.433

t × pH

−0.042

−0.80

0.439

mgMNP × pH

−0.474

−0.82

0.429

Regression

 R2 (%)

82.14

 F

5.11

 p

0.009

 Lack of fit

17.82 %

Three-dimensional graphs will give us a clear insight about the effect of each factor. For this purpose, the response was plotted based on the polynomial function with the coefficients in Table  2 versus the factors based on the ranges in Table  1 . The resulted three-dimensional response surfaces have been shown in Fig.  4 . These figures show the relationship between two factors and response (adsorption %) at center level of the third factor. From the Fig.  4 , it is clear that at intermediate pHs and times and with larger amounts of MNPs, the adsorption is higher. Moreover, curvatures in the plots in Fig.  4 a, c show the probable importance of the second-order effect of pH. ANOVA table (Table  2 ) confirms this since the p value for the term pH × pH is 0.001.

Fig. 4

Variation of response surfaces for MO with pH and t ( a ), t and amount of magnetic nanoparticle (mgMNP) ( b ) and pH and amount of mgMNP ( c )

In the next step, response surface optimization was used to explore the optimum values of the factors. Response optimization showed that the adsorption % will be maximum at t  = 120 min, mgMNP = 10.0 mg and pH 2.66.

Mechanism of the interaction

Results of experimental design showed that in acidic medium (pH 2.66) adsorption is higher. Si–OH groups formed by interaction of SiO 2 with water are capable of proton transfer. This results in the variation in the surface charge of the MNPs with pH. At lower pHs, surface sites are protonated and the surface becomes positively charged. However, at higher pHs, the surface of the MNPs is negatively charged due to the partial ionization of Si–OH.

At low pH

At high pH

MO is an ionic dye with –SO 3 Na group. At low pH, the negative charge of the sulfonic group predominates and it is responsible for the electrostatic interaction with the adsorbent. At more acidic pHs, SO 3 groups can be protonated and the surface becomes positively charged. Therefore, it is expected that the adsorption of MO on the MNPs decreases. At higher pHs, both MO and the surface of the MNPs are predominately negatively charged. This will result in the decrease in adsorption in higher pHs. These explanations are clearly confirmed by Fig.  4 c.

Study of the kinetics of adsorption

Study of the kinetics of dye adsorption onto SMNPs is required for selection of the optimum operating conditions for the full-scale batch processes. The kinetic parameters which are helpful for the prediction of the adsorption rate give important information for designing and modeling of the adsorption processes [ 43 ].

Kinetic studies were performed in a 15 mL glass beaker where 10.0 mg of SMNPs was added to 10.0 mL of the dye solution with concentrations between 10.0 and 30.0 mg L −1 at room temperature and in pH 2.66. Then, using the shaker the mixture was shaken at 250 rpm to ensure equilibration between solution and adsorbent. At time t  = 0 and equilibrium, dye concentration was measured by UV–Vis spectrophotometry at 505 nm. The amount of adsorption at equilibrium, qt (mg g −1 ), was calculated by: where Ci and Ct (in mg L −1 ) are concentrations of dye in solution at t  = 0 and equilibrium after time t of incubation, respectively. V is the volume of the solution (in L) and W is the mass of SMNPs (in g).

Pseudo-second-order model

The rate of removal of MO was very fast during the initial stages of the adsorption process. The kinetic data for adsorption of the dye onto SMNPs were firstly analyzed using pseudo-second-order model. The results showed that the kinetics of adsorption obeys pseudo-second-order model. The kinetics of the adsorption of dye with different initial concentrations was treated by Ho’s pseudo-second-order rate equation [ 44 ]: where q t and q e are the amount of adsorbed dye at time t and at equilibrium, respectively. k 2 is the pseudo-second-order rate constant. Plots of the kinetics data based on the pseudo-second-order kinetic model are shown in Fig.  5 . The constants of the pseudo-second-order rate equation for different initial concentrations are shown in Table  3 .

Fig. 5

Pseudo-second-order kinetic plot for the adsorption of MO

Table 3

Values of the pseudo-second-order rate equation parameters in different initial concentration of dye

Initial concentration (mg L−1)

Equation

qe,exp (mg g−1)

qe,calc (mg g−1)

k (g mg−1 min−1)

R2

10

t/qt = 0.1222t + 0.2091

7.96

8.18

0.07

0.9999

20

t/qt = 0.0703t + 0.1213

13.88

14.22

0.04

0.9999

30

t/qt = 0.0570t + 0.0799

17.09

17.54

0.04

0.9999

Equilibrium isotherm models

Equilibrium isotherm models were used to describe the experimental adsorption data. The parameters obtained from different models provide important information about the adsorption mechanism, the surface properties and affinity of the adsorbent [ 45 ]. The common models for investigation of the adsorption isotherm (Langmuir and Freundlich) were also fitted to the experimental data [ 23 ].

Langmuir’s model does not take into account the variation in the adsorption energy, but it is the simplest description of the adsorption process. It is based on the physical hypotheses that the maximum adsorption capacity consists of a monolayer adsorption, there are no interactions between adsorbed molecules and adsorption energy is distributed homogeneously over the entire coverage surface [ 43 ]. The equilibrium adsorption isotherm was determined using batch studies with different initial concentrations of MO (10–100 mg L −1 ) at 25 °C and in pH 2.66.

The linearized form of the Langmuir isotherm is expressed as [ 46 ]: where q max (in mg g −1 ) is the maximum amount of the adsorbed dye which corresponds to the complete monolayer coverage and illustrates the maximum value of q e that can be attained as Ce increases. K L (in L mg −1 ) is the Langmuir adsorption equilibrium constant which is related to the energy of adsorption. Values of q max and b ( K L / q max ) are determined by the linear regression plot of (Ce/ q e ) versus Ce. Adsorption data plotted based on the Langmuir isotherm are shown in Fig.  6 .

Fig. 6

Linearized form of the Langmuir isotherm for adsorption of MO on the SMNPs

The Freundlich isotherm model is an empirical equation that describes the surface heterogeneity of the adsorbent. It considers multilayer adsorption with a heterogeneous energetic distribution of active sites accompanied by interactions between adsorbed molecules [ 47 ]. The linear form of the Freundlich isotherm is: where C e is the equilibrium concentration (in mg L −1 ), q e is the amount of the adsorbed dye in equilibrium (mg g −1 ) and finally, K f [in (mg g −1 ) (mg L −1 ) n ] and 1/ n are Freundlich constants which depend on the temperature and the given adsorbent–adsorbate couple. Parameter n is related to the adsorption energy distribution and K f indicates the adsorption capacity. The values of K f and 1/ n can be calculated by the plotting Ln ( q e ) versus Ln ( C e ). The intercept of the resulted line is Ln ( K f ) and its slope is 1/ n . Value of 1/ n indicates that the adsorption intensity of dye onto the adsorbent (or surface heterogeneity) becomes more heterogeneous as its value gets closer to zero. A value for 1/ n below 1 indicates a normal Freundlich isotherm while 1/ n above 1 is indicative of the cooperative adsorption [ 24 ]. Adsorption data plotted based on the Freundlich isotherm are shown in Fig.  7 .

Fig. 7

Adsorption data in the Freundlich isotherm for MO

It is generally accepted that under constant temperature, n increases with decreasing adsorption energy. This implies that the larger the n value, the stronger the adsorption intensity [ 48 ]. Values of n  > 1 represent favorable adsorption conditions.

The essential feature of the Langmuir isotherm can be expressed in terms of a dimensionless constant separation factor ( R L ) given by the following equation [ 43 ]: where a L parameter is a coefficient related to the energy of the adsorption which increases by increasing the strength of the adsorption bond. The adsorption process can be defined as irreversible ( R L  = 0), favorable (0 <  R L  < 1), linear ( R L  = 1) or unfavorable ( R L  > 1) in terms of R L [ 20 ] .

The calculated parameters of Langmuir and Freundlich isotherms and the corresponding correlation coefficients ( R ) are listed in Table  4 . These results show that experimental data follow the Freundlich model. Since the Freundlich adsorption model is based on the assumptions that all surface sites are different, the adsorption of MO occurs through different adsorption sites. However, the data fit the Langmuir isotherm, satisfactorily.

Table 4

Parameters of the fitting of experimental data to the Langmuir and Freundlich isotherms equations

aL (L mg−1)

KL (L g−1)

qmax| = KL/aL| (mg g−1)

RL

r

Langmuir isotherm

 0.00082

0.04356

53.19

0.924

0.9219

Kf

n

r

Freundlich isotherm

 5.087

1.997

0.9896

The calculated value of R L for adsorption of 100.0 mg L −1 solution of MO is 0.924. Thus, the adsorption of dye onto SMNPs is favorable. The calculated n parameter is about 2 (Table  4 ) which implies that adsorption is favorable. In most cases, the exponent between 1 <  n  < 10 shows beneficial adsorption [ 43 ].

In a work published by Deligeer et al. [ 12 ], γ-Fe 2 O 3 /SiO 2 nanocomposite was synthesized and used to adsorb MO. Adsorption of MO onto this nanocomposite obeyed Freundlich isotherm, too [ 12 ]. Calculated q m based on the Langmuir isotherm in that work was reported as 476 mg g −1 which is higher than q m obtained here. However, the range of the concentrations examined for adsorption is much lower in this work. Other adsorbents with active sites which are mostly SiO 2 can be found. For example, q m values equivalent to 333.33 [ 17 ], 24 [ 5 ], 33.8 [ 8 ] and 66.09 mg g −1 [ 10 ] have been reported. Therefore, it is seen that the q m value obtained here is comparable with most of the reported ones.

Analytical studies

Desorption and regeneration

Reversibility of the adsorption of MO onto the SMNPs allows the regeneration or activation of the SMNPs for new adsorption experiments. Desorption of the dye from the SMNPs was studied using different solvents. Desorption process was separately examined by adding 2.0 mL volume of ethanol, pure acetic acid, and HCl and NaOH solutions with concentrations of 0.1 mol L −1 –0.01 g of the adsorbent loaded with MO. SMNPs were collected magnetically from the solution. Concentration of dye in the desorbed solution was measured by spectrophotometric method. Figure  8 shows the percentage of the recovered dye. It can be concluded from Fig.  8 that a 2.0 mL volume of 0.1 mol L −1 NaOH solution is the most effective eluent for desorption of MO from SMNPs. The results showed that desorption efficiencies higher than 99 % can be achieved in a short time of 3 min and in a single-step elution using 2.0 mL of 0.1 mol L −1 NaOH. Therefore, the dye could be desorbed from the loaded SMNPs by changing the pH of the solution to alkaline range. The SMNPs were washed with deionized water and reused for two successive adsorption processes with adsorption efficiencies higher than 90 % (Fig.  9 ). In higher removal cycles, removal efficiency decreases. This may be due to oxidation, losing and/or dissolving some amounts of the adsorbent during the successive steps.

Fig. 8

Percentage of the recovered dye in desorption by different solvents

Fig. 9

Adsorption efficiency of reused magnetic nanoparticles for MO

Analytical parameters and applications

Detection and determination of synthetic dyes like MO in water samples are important. Therefore, an analytical study based on the adsorption of MO on SMNPs was performed.

Different concentrations of dye were contacted with SMNPs in optimum adsorption conditions and then, dye was desorpted with optimum eluent. For constructing calibration curve, the spectrophotometric signal of the solution obtained by desorption process was plotted against the initial concentration of dye before performing adsorption process. Statistical parameters of the calibration curve have been collected in Table  5 . The statistics of the method in preconcentration and determination of MO are good. Since the amount of methyl orange in 100.0 mL of the solution was concentrated to 2.0 mL and with considering extraction recovery of about 90 % (based on the maximum percent recovery in Table  1 ) in optimum conditions, a preconcentration factor of 45 was achieved in this method.

Table 5

Statistical results of the preconcentration and calibration of methyl orange by the proposed method

Parameter

Characteristic

Number of samples

12

Linear range (ng mL−1)

10.0–120.0

Slope

0.0056

Standard error of slopea

2 × 10−4

Intercept

0.1040

Standard error of intercepta

0.0176

Correlation coefficient

0.9966

Detection limit (ng mL−1)a

3.7

Preconcentration factor

45

a Calculated based on definitions in [ 49 ]

The suitability of the proposed method for the analysis of different water samples was checked by spiking samples of river water and laboratory waste water with different concentrations of MO. The results have been given in Table  6 . The results in Table  6 show the good accuracy (percent recoveries close to 100) and precision (RSD % values below 4) of the method.

Table 6

Results of the analysis of the water samples by the proposed method

Sample

Amount added (ng mL−1)

Amount detected (ng mL−1)

RSD %a

Recovery %

River water

0.0

n.d.

20.0

20.05

3.8

100.25

60.0

58.65

1.8

97.75

100.0

100.18

2.2

100.17

Laboratory waste water

0.0

14.34

1.9

20.0

37.18

3.9

114.20

60.0

78.76

3.4

103.95

n.d. not detected

a Relative standard deviations were calculated based on three determinations

Conclusions

SMNPs were utilized for dye preconcentration, determination and removal from aqueous solution. UV–Vis absorption spectroscopy was used to record the adsorption behavior of the solution after treatment. The prepared magnetic adsorbent can be well dispersed in the water and can be easily separated magnetically from the medium after adsorption. Therefore, here is a novel and convenient procedure that has been developed as a safe, rapid and inexpensive methodology for preconcentration and determination of MO as a toxic compound from waste water. The pseudo-second-order rate kinetic model fitted well with the dye adsorption data. The dye adsorption obeyed Freundlich isotherm. The studied adsorption process was validated as a sensitive and accurate analytical method for determination of MO in environmental waters.


References

  1. Malik et al. (2007) Adsorption of malachite green on ground nutshell waste based powdered activated carbon (pp. 1129-1138) 10.1016/j.wasman.2006.06.009
  2. Mittal et al. (2007) Studies on the adsorption kinetics and isotherms for the removal and recovery of methyl orange from wastewaters using waste materials (pp. 229-240) 10.1016/j.jhazmat.2007.02.028
  3. Juang et al. (2002) Characterization and use of activated carbons prepared from bagasse for liquid-phase adsorption (pp. 191-199) 10.1016/S0927-7757(01)01004-4
  4. Teng and Lin (2006) Removal of methyl orange dye from water onto raw and acid-activated montmorillonite in fixed beds (pp. 71-81) 10.1016/j.desal.2006.03.521
  5. Chena et al. (2011) Characterization of anionic-cationic surfactants modified montmorillonite and its application for removal of methyl orange (pp. 1150-1158) 10.1016/j.cej.2011.05.013
  6. Liu et al. (2011) Rapid modification of montmorillonite with novel cationic Gemini surfactants and its adsorption for methyl orange (pp. 1220-1226) 10.1016/j.matchemphys.2011.08.064
  7. Kan et al. (2011) Removal of methyl orange from aqueous solutions using a bentonite modified with a new gemini surfactant (pp. 184-187) 10.1016/j.clay.2011.07.009
  8. Leodopoulos et al. (2012) Single and simultaneous adsorption of methyl orange and humic acid onto bentonite (pp. 84-90) 10.1016/j.clay.2012.08.005
  9. Tang et al. (2012) Enhanced adsorption of methyl orange by vermiculite modified by cetyltrimethylammonium bromide (CTMAB) (pp. 2179-2187) 10.1016/j.proenv.2012.01.207
  10. Zhu et al. (2010) Preparation, characterization, adsorption kinetics and thermodynamics of novel magnetic chitosan enwrapping nanosized γ-Fe2O3 and multi-walled carbon nanotubes with enhanced adsorption properties for methyl orange (pp. 5063-5069) 10.1016/j.biortech.2010.01.107
  11. Rakhshaee et al. (2011) Removal of methyl orange from aqueous solution by Azolla filicoloides: synthesis of Fe3O4 nano-particles and its surface modification by the extracted pectin of Azolla (pp. 501-504) 10.1016/j.cclet.2010.10.041
  12. Deligeer et al. (2011) Adsorption of methyl orange on mesoporous-Fe2O3/SiO2 nanocomposites (pp. 3524-3528) 10.1016/j.apsusc.2010.11.067
  13. Chen et al. (2011) Isotherm, thermodynamic, kinetics and adsorption mechanism studies of methyl orange by surfactant modified silkworm exuviae (pp. 246-254)
  14. Elizalde-Gonzalez et al. (2008) Chemically modified maize cobs waste with enhanced adsorption properties upon methyl orange and arsenic (pp. 5134-5139) 10.1016/j.biortech.2007.09.023
  15. Li et al. (2012) Removal of methyl orange from aqueous solution by calcium alginate/multi-walled carbon nanotubes composite fibers (pp. 863-868) 10.1016/j.egypro.2012.01.138
  16. Mittal et al. (2007) Studies on the adsorption kinetics and isotherms for the removal and recovery of methyl orange from wastewaters using waste materials (pp. 229-240) 10.1016/j.jhazmat.2007.02.028
  17. Jalil et al. (2010) Adsorption of methyl orange from aqueous solution onto calcined Lapindo volcanic mud (pp. 755-762) 10.1016/j.jhazmat.2010.05.078
  18. Haque et al. (2010) Adsorptive removal of methyl orange from aqueous solution with metal-organic frameworks, porous chromium-benzenedicarboxylates (pp. 535-542) 10.1016/j.jhazmat.2010.05.047
  19. Haque et al. (2011) Adsorptive removal of methyl orange and methylene blue from aqueous solution with a metal-organic framework material, iron terephthalate (MOF-235) (pp. 507-511) 10.1016/j.jhazmat.2010.09.035
  20. Afkhami et al. (2010) Modified maghemite nanoparticles as an efficient adsorbent for removing some cationic dyes from aqueous solution (pp. 240-248) 10.1016/j.desal.2010.06.065
  21. Ngomsik et al. (2005) Magnetic nano- and microparticles for metal removal and environmental applications: a review (pp. 963-970) 10.1016/j.crci.2005.01.001
  22. Afkhami and Norooz-Asl (2009) Removal, preconcentration and determination of Mo (VI) from water and wastewater samples using maghemite nanoparticles (pp. 52-57) 10.1016/j.colsurfa.2009.05.024
  23. Qadri et al. (2009) Removal and recovery of acridine orange from solutions by use of magnetic nanoparticle (pp. 318-323) 10.1016/j.jhazmat.2009.03.103
  24. Santhi et al. (2010) Removal of methyl red from aqueous solution by activated carbon prepared from the Annona squmosa seed by adsorption (pp. 11-18) 10.3329/cerb.v14i1.3767
  25. Chin and Yaacob (2007) Synthesis and characterization of magnetic iron oxide nanoparticles via w/o microemulsion and Massart’s procedure (pp. 235-237) 10.1016/j.jmatprotec.2007.03.011
  26. Albornoz and Jacobo (2006) Preparation of a biocompatible magnetic film from an aqueous ferrofluid (pp. 12-15) 10.1016/j.jmmm.2005.11.021
  27. Kim et al. (2005) Synthesis of ferrofluid with magnetic nanoparticles by sonochemical method for MRI contrast agent (pp. 328-330) 10.1016/j.jmmm.2004.11.093
  28. Kimata et al. (2003) Preparation of monodisperse magnetic particles by hydrolysis of iron alkoxide (pp. 112-118) 10.1016/S0032-5910(03)00046-9
  29. Alvarez et al. (2006) Novel flow injection synthesis of iron oxide nanoparticles with narrow size distribution (pp. 4625-4633) 10.1016/j.ces.2006.02.032
  30. Basak et al. (2007) Electrospray of ionic precursor solutions to synthesize iron oxide nanoparticles: Modified scaling law (pp. 1263-1268) 10.1016/j.ces.2006.11.029
  31. Feyzi et al. (2013) Catalytic performance of Fe–Mn/SiO2 nanocatalyst for CO hydrogenation (pp. 1-10) 10.1155/2013/973160
  32. Alizadeh et al. (2012) Biguanide-functionalized Fe3O4/SiO2 magnetic nanoparticles: an efficient heterogeneous organosuperbase catalyst for various organic transformations in aqueous media (pp. 2546-2552) 10.5012/bkcs.2012.33.8.2546
  33. Simkiene et al. (2011) Multifunctional iron and iron oxide nanoparticles in silica (pp. 1026-1032) 10.1016/j.matchemphys.2011.08.025
  34. Klug and Alexander (1974) Wiley
  35. Predoi et al. (2007) Iron oxide in a silica matrix prepared by the sol–gel method (pp. 6319-6323) 10.1016/j.tsf.2006.11.148
  36. Bruni et al. (1999) IR and NMR study of nanoparticle-support interactions in a Fe2O3–SiO2 nanocomposite prepared by a sol–gel method (pp. 573-586) 10.1016/S0965-9773(99)00335-9
  37. Bordiga et al. (1996) Structure and reactivity of framework and extraframework iron in Fe–silicalite as investigated by spectroscopic and physicochemical methods (pp. 486-501) 10.1006/jcat.1996.0048
  38. Fabrizioli et al. (2002) Synthesis, structural and chemical properties of iron oxide–silica aerogels (pp. 619-630) 10.1039/b108120a
  39. Qing et al. (2011) Modification of Fe–SiO2 interaction with zirconia for iron-based Fischer–Tropsch catalysts (pp. 111-122) 10.1016/j.jcat.2011.01.005
  40. Gunaraj and Murugan (1999) Application of response surface methodology for predicting weld bead quality in submerged arc welding of pipes (pp. 266-275) 10.1016/S0924-0136(98)00405-1
  41. Box and Hunter (1957) Multi-factor experimental designs for exploring response surfaces (pp. 195-241) 10.1214/aoms/1177707047
  42. Unknown ()
  43. Afkhami and Moosavi (2010) Adsorptive removal of Cango red, a carcinogenic textile dye, from aqueous solutions by maghemite nanoparticles (pp. 398-403) 10.1016/j.jhazmat.2009.09.066
  44. Chien and Clayton (1980) Application of Elovich equation to the kinetics of phosphate release and sorption on soils (pp. 265-268) 10.2136/sssaj1980.03615995004400020013x
  45. Shariati et al. (2011) Fe3O4 magnetic nanoparticles modified with sodium dodecyl sulfate for removal of safranin O dye from aqueous solutions (pp. 160-165) 10.1016/j.desal.2010.11.040
  46. Langmuir (1918) The adsorption of gases on plane surfaces of glass, mica and platinum (pp. 1361-1403) 10.1021/ja02242a004
  47. Chatterjee et al. (2009) Enhanced adsorption of Congo red from aqueous solutions by chitosan hydrogel beads impregnated with cetyl trimethyl ammonium bromide (pp. 2803-2809) 10.1016/j.biortech.2008.12.035
  48. Belessi et al. (2009) Removal of reactive red 195 from aqueous solutions by adsorption on the surface of TiO2 nanoparticles (pp. 836-844) 10.1016/j.jhazmat.2009.05.045
  49. Unknown ()