Department of Physics, Faculty of Basic Sciences, University of Mazandaran, Babolsar, IR
Plasma Physics Research Center, Science and Research Branch, Islamic Azad University, Tehran, IR
Abstract
Physical principals and the relations between Surface Plasmon Resonance (SPR) spectra and geometrical properties of metal nanostructures specially silver and gold were reported. Applying SPR technique enable us to investigate the accuracy of some simple equations for investigating geometrical properties of metal nanostructures based on their plasmonic spectrum. Geometrical properties, shape and size polydispersity of particles as well as particles’ embedding medium refractive index are the crucial ignored parameters, effective in the accuracy of those equations. The restrictions of these relations in terms of shape, size distribution and refractive index of particles’ embedding medium are also investigated and compared with other published reports. Furthermore, the equations of spherical particles have been extended to non-spherical ones and their accuracy has been investigated. It was found that the modified forms of the equations may lead to more exact results for non-spherical metal particles.
Background
The two key parameters of nanostructures are their size and shape which have a crucial rule in their properties and diverse applications [
1
]. These key parameters are usually determined after synthesis of nanostructures using electron microscopic techniques such as transmission electron microscopy (TEM) and scanning electron microscopy (SEM). Although these techniques are very powerful in determination of size and shape of the nanostructures but the problem is that these techniques are not at hand anywhere and anytime. Moreover, microscopic techniques are too expensive compared with other measurement techniques such as optical spectroscopy. The optical properties of metallic nanostructures are determined by the collective oscillations of their conduction electrons with respect to the positive ion background, known as plasmon which relates the extinction coefficients to the size and geometrical properties of metallic nanostructures [
2
]. Therefore, optical spectroscopy is one of the simplest and easiest ways to determine the geometrical properties of metal nanostructures including their size and shape [
3
]. The unique advantage of this property is the ability of determining the geometrical properties of nanostructures during the synthesis process which causes their controlled production.
The symmetry of nanostructures determines the ways that they are polarized, and the number of these ways correlates to the number of plasmonic peaks [
4
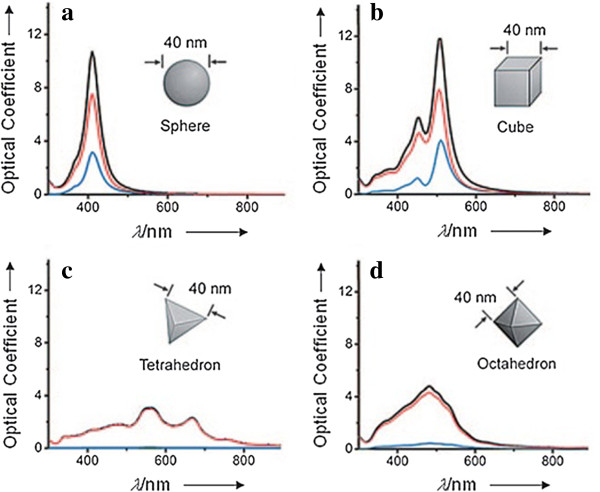
]. For example extinction spectra of small particles with the most symmetry shape i.e. sphere (Figure
1
(a)) has just one peak because a small sphere could be polarized only in dipole mode, while cubic particles could be polarized both in dipole (in about 530 nm) and quadrupole modes (in about 470 nm (Figure
1
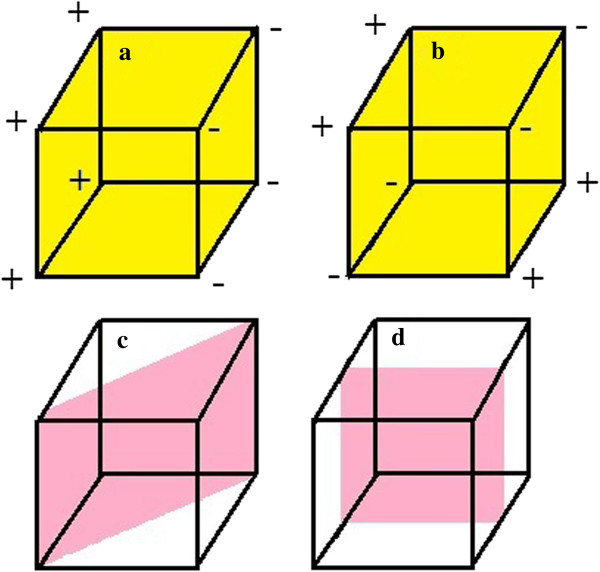
(b)). Therefore, they have two plasmonic peaks and the polarization modes are shown in Figure
2
(a) and (b), respectively [
5
].
Figure 1
UV-Visible extinction (black), absorption (red), and scattering spectrum (blue) of Ag nanocrystals, illustrating the effect of shape on spectral characteristics: (a) sphere, (b) cube, (c) tetrahedron and (d) octahedron.
Reprinted with permission from Xia
et al
. [
4
].
Figure 2
(a) Dipole, (b) quadrupole mode of a nanocube polarization, (c) and (d) the related symmetry planes of nanocubes in dipolar polarization.
Reprinted with permission from Xia
et al
. and Zhang
et al
. [
4
,
5
].
The symmetry also changes intensity of the extinction spectra. If surface charges are polarized according to mirror symmetry (without reflection plane which is bisector of corners) as depicted in Figure
2
(c), the total dipole moment will increase, because accumulation of electrons in sharp corners are more than the other parts and in this polarization mode (Figure
2
(d)) there will be four sharp corners instead of the two corners in Figure
2
(c). Therefore, the number of plasmons will increase which increases the intensity of extinction spectra [
4
]. Another reason for decreasing the intensity of the extinction spectra is that electrons in silver nanocubes accumulate in corners (the corners are face to face), but in silver tetrahedrons, each corner is in front of a plane, so the strength of the effective dipole moment decreases and as a result the intensity of extinction spectra decreases (Figure
1
(c)). Consequently, the extinction spectrum of octahedron is blue shifted (maybe due to more distance of face-to-face corners in octahedron) and is more intensive than tetrahedron (Figure
1
(d)) [
4
].
The wavelength of plasmon resonance is affected by both particle size and refractive index of embedding medium [
4
,
6
–
10
]. In large particles surfaces are far enough from each other and electrons need less energy to shift from their equilibrium positions and consequently the effective restoring force applying to electrons by the ions decreases, compared with smaller particles. In contrast with nanocubes, one dimensional nanostructures have two dipole plasmonic peaks, one belongs to oscillating charges along longitudinal axis, and another belongs to oscillating charges along latitudinal axis [
4
]. Increasing the aspect ratio of these nanostructures not only causes a red shift in dipolar longitudinal plasmonic peak, but also increases intensity of the plasmonic peak. Consequently, more plasmons will be excited and the intensity of their dipolar longitudinal plasmonic peaks will increase, too. This phenomena is illustrated both experimentally and theoretically (using discrete dipole approximation) for silver nanobars in Figure
3
(a) and Figure
3
(b), respectively.
Figure 3
(a) SEM images of individual Ag nanobars and the corresponding normalized LSPR spectra.
The longitudinal plasmon peak red-shifts with increasing aspect ratio for the nanobars,
(b)
LSPR (scattering) spectra calculated using the DDA method for Ag nanobars (100, 150, and 200nm in length, keeping width=55 nm and height=50 nm),
(c)
SEM images of individual nanorice with the corresponding normalized LSPR spectra and
(d)
plot of longitudinal plasmon peak location versus aspect ratio. The peaks of both nanobars and nanorice red-shift with increasing aspect ratio, but in average the peaks of nanobars are 80 nm red-shifted from nanorice. Reprinted with permission from Xia
et al
. [
4
].
As was mentioned earlier, sharp corners causes red shift in plasmonic peak due to accumulation of electrons in the corners and large distance among the electrons and positive ions. In very small nanostructures, extinction cross section is determined mainly by absorption cross section, in contrast with larger structures in which is determined mainly by scattering cross section, as is proofed by calculating absorption and scattering coefficients using Mie’s theory [
11
]. Comparison of scattering coefficients in large enough nanobars and nanorices illustrates that sharp corners of nanostructures causes red shift of their extinction spectra (Figure
3
(a) and (c)). The linear relation between aspect ratio of one dimensional nanostructures and their longitudinal dipolar plasmonic peak is illustrated both theoretically and experimentally in Figure
3
(d).
In this work, only very useful relations for this purpose for metal nanostructures with different shapes have been collected, but also some of those relations from spherical to non-spherical particles are expanded using Coronado and Schatz’s equation [
10
,
12
–
17
].
Methods
In this section, simple empirical equations are presented which are used for determining geometrical properties of free-electron metal nanostructures. These relations are listed in Tables
1
and
2
.
Table 1
Different methods of determiningfor metal nanostructures
Nanostructure shape
Nanostructure material
dev¯ limit (nm)
σ limit
e limit
Method
Ref.
Spherical
Any material
Any size
σ ≈ 0
e ≈ 0
Mie Theory
[16]
Spherical and quasi-spherical
Any material
1≤dev¯≤10
Not Determined
1 ≤ e ≤ 1.2
Using linear graphAmaxAminV.S.lndev¯
[16]
quasi-spherical
Any material
3≤dev¯≤70
Not Determined
1.2 ≤ e ≤ 1.4
Using linear graphA450V.S.lndev¯
[16]
Spherical
Silver
Less than 20
Not determined
Not determined
FWHM V.S.1d¯
[14]
Spherical
Gold
5≤dev¯≤100
Not determined
Moderate invert of sphere
Equation 1
[16]
Spherical
Silver
5≤dev¯≤118
σ<0.0001
Not determined
Equation 5
[14]
Spherical
Any material
Not determined
Not determined
Not determined
Equation 4
[12, 13]
Table 2
Methods of determining different geometrical parameters of nanostructures
Unknown parameter
Nanostructure shape
Nanostructure material
Nanostructure size
σ limit
e limit
Method
Ref.
e (aspect ratio)
Spheroid and nanorod
Any material
Not determined
Not determined
Not determined
Equation 6
[15]
h (shell thickness)
spherical
Any material
Quasi-Static approximation, hmax ≈ dev
Not determined
Not determined
Equation 8
[10]
Δnm*
Not determined
Any material
Not determined
Not determined
Not determined
Equation 7
[15]
Khlebtsov derived an equation which relates average equivolume diameter (
) of gold nanospheres to moderate inversion of spherical shape and their dipolar surface plasmon resonance wavelength (λ
SPR
) using several experimental data, as following [
16
]:
He has also used linearity of
and
graphs for determining
nanoparticles with other properties (Table
1
). In addition, Hoonacker and co-workers found that the graph of FWHM of extinction spectra of sliver nanospheres with smaller diameter than 20 nm versus the inverse of their diameter is linear and one may use this method for size determination of Ag NPs [
14
].
e
and
σ
in Table
1
are the aspect ratio of spheroids and s-cylinders (cylinders with semi sphere ends) and standard normal distribution parameter that determines size distribution of nanoparticles, respectively. In a spheroid and s-cylinder
may be calculated as:
Where
Also A
max
and A
min
in Table
1
are the maximum and minimum of extinction coefficient in extinction spectra.
Manikandan and co-workers [
12
,
13
] and Hoonacker et al. [
14
] have derived useful equations which relates diameter of nanospheres to their λ
SPR
for all kind of metallic particles and silver particles respectively, as follows:
Where Δλ is full width at half maximum of extinction spectra (FWHM), R is particle radius, C is light velocity in vacuum (c = 3 × 10
8
m/s), β is proportionality constant, v
F
is Fermi velocity of electron gas in the particle which is equal to 1.4 × 10
6m
/
s
for gold and silver particles and d
av
in Eq. 5 is the average diameter of particles [
18
].
It should be mentioned that one may use Mie theory for simulation of extinction spectra of monodisperse metal and insulator spherical particles, and for extinction spectra of particles with non-spherical shapes T-Matrix simulation (linear transformation between coefficients of scattered and incident fields [
19
]) is the only exact solution [
16
,
20
–
23
].
Not only particle size, but also some other parameters possibly would be determined using surface plasmon resonance during production process. In quasi-static approximation, which the particles' dimensions are much less than incident wavelength, electromagnetic fields in the particle only depends on the time and standing plasmonic waves will be produced. In such a case the dependence of longitudinal resonance wavelength (λ
n
) to the resonance order (n) and aspect ratio (e) is given by this Equation [
15
]:
Where n=1, 2, 3, etc. corresponds to dipolar, quadrupolar, octapolar and etc. plasmon resonances. The constants A
0
and A are independent of n factor which depend on the size and morphology of the particle. Surface plasmon resonances are very sensitive to changes of refractive index of their embedding medium upon thickness of their size [
6
–
9
]. Consequently this phenomenon makes free-electron metal nanoparticles excellent candidate for nanoscale sensors. Dependence of longitudinal dipolar and multipolar plasmon resonances to the changes of refractive index of embedding medium (Δn
m
) is given by [
15
]:
Where n
m
initial medium refractive index and B is is a weak function of particle shape and order of multipole resonances which reduces by increase in the order.
Muskens and co-workers [
10
] derived a simple equation for measuring thickness of dielectric shell (h) around metal core with weakly dispersed imaginary part of dielectric function in core-shell systems embedded in dielectric medium in a quasi-static regime, which for usual dielectric shells like water and glass is expressed as:
Where "a" is the core volume fraction:
and
λ
SPR
(h = 0) and λ
SPR
(h →
∞
) define as surface plasmon resonance wavelength when there is not any shell around the core (h=0) and when the shell is too thick (h→∞) which the core does not sense embedding medium.
The parameters, which are describe by equations (
6
–11), and their applications are listed in Table
2
. Tables
1
and
2
are very helpful for researches who are interested in controlling the production process of free-electron metal nanostructures.
In classical mechanics point of view, the mean free path (MFP) of electrons decreases by scattering from clusters’ or particles’ surface [
11
], Coronado and Schatz used a geometrical method to derive a practical equation for calculation of MFP in nanostructures [
17
]:
This equation has been used to expand Equations (1, 4, 5) to non-spherical shaped nanostructures to investigate the applicability of these equations about them.
Although, these equations have some strength points but they also have some weaknesses, which will be illustrated in the next section. In fact, some of those results possibly may not be exact due to the effects of shape, size distribution of particles and refractive index of embedding medium on extinction spectra, which are not considered in those equations.
Result and discussion
In this section, the applicability of Equations (1, 4, 5,
13
–15) for gold and silver nanoparticles with different shapes is investigated. At first, the reliability of Equations (1, 4, 5) about spherical particles is investigated and then the equations are expanded to particles with non-spherical shapes. Extinction spectra of spherical gold nanoparticles produced by Ashkarran and co-workers [
24
,
25
] and Seo et al. [
26
] are shown in Figure
4
. The data of these spectra, calculated values of
and β are shown in Table
3
. Note that it was doubled the half of FWHM whenever it was impossible to be measured exactly.
Figure 4
Extinction spectra of (a) gold and silver nanosphere produced by Ashkarran et al.
[
24
]
,
[
25
]
,
[
27
]
and (b) gold nanospheres produced by Seo et al.
[
26
]
(solid line shows experimental spectra and dotted lines show the result of DDA calculation).
Table 3
Data of Figure4and calculated amounts ofand β for nanospheres
Material
λSPR (nm)
FWHM (nm)
dev¯(nm)
Calculateddev¯ (nm)
β
Ref.
Silver in CTAB
393
142
14
8.81
8.66
[25, 27]
Silver in sodium citrate
394
101
30
9.66
13.14
[25, 27]
Gold
519
118
8
12.77
2.36
[24, 25]
Gold
542.1
126.3
49±5
66.83
14.17
[26]
Gold (calculated by DDA)
535
80.7
49
54.04
9.30
[26]
Gold
573.7
Incalculable
81±8
108.83
Incalculable
[26]
Gold (calculated by DDA)
559.6
Incalculable
81
92.11
Incalculable
[26]
It is expected that the plasmonic peak of silver nanoparticles in sodium citrate have more red shift than in CTAB because their average diameter is larger, but there is blue shift in their spectra compared with spectra of silver nanoparticles in CTAB. Because refractive index of CTAB (1.4 [
28
]) is larger than of sodium citrate (1.3 [
29
]), there is not any remarkable red shift in resonance wavelength of particles in sodium citrate. This is one of the weaknesses of Eq. 5 which in spite of high sensitivity of silver nanoparticles to the changes of refractive index of their embedding medium, the equation does not have any dependence to this important parameter. It seems that the difference between calculated
for particles in CTAB and the measured one is mainly due to this weakness. Another weakness is that Hoonacker and co-workers did not considered the required limits of
σ
in their equation.
Similarly, Eq. 4 does not depend on refractive index of particles’ embedding medium nor size distribution. It was expected that β values to be same for different silver samples but they were not, due to different values of these parameters.
Equation 1, which was obtained by Khlebtsovand co-workers, does not depend on refractive index of embedding media, shape and size distribution of particles, too. So, in spite of approximate results, for exact results the constants in this equation should be replace with functions of above parameters. Considering these points in Equations 4 and 5 the accuracy and generality of these equations would increase. Note that particles with same shape have the approximately same β values.
Now the validity of Equations 1 and 4 for truncated icosahedrons [
30
] and icosahedrons [
30
,
31
] gold nanoparticles are investigated. The extinction spectra of these structures are shown in Figure
5
. In Table
4
, experimental and calculated values of
and β are presented. The average size of particles has been considered as their equivolume diameter for samples of Ref. [
30
] and [
31
].
Figure 5
Extinction spectra of (a) Au icosahedra and their truncated forms
[
30
]
and (b) experimental and theoretical spectra of Au icosahedra.
Reprinted with permission from Seo
et al
. [
31
].
Table 4
Calculated amounts of,
L
effand β for Au icosahedra and their truncated forms
Shape
Average size (nm)
λSPR (nm)
FWHM (nm)
Calculated size (nm)
β
Ref.
Truncated icosahedral
222.48
574.7
120.3
109.93
54.55
[30]
icosahedral
253.45
583
135
118.73
67.77
[30]
Icosahedral (experimental)
94±10
561.96
101.96
95.08
20.43
[31]
Icosahedral (teoritical)
94
560
105.88
92.62
21.36
[31]
Equation 1 leads to exact results for both theoretical and experimental data of Ref. [
31
]. So, one could expect validity of this equation for dipolar resonance of other regular polyhedral nanoparticles. Note that the results of gold nanospheres in Table
1
were not exact probably because the effect of refractive index of embedding medium is not considered in Eq. 1. Different values obtained for β considering the data of Ref. [
31
] show the effect of size distribution in validity of Eq. 4. Also different calculated β values for Ref. [
30
] and [
31
] are probably due to effect of refractive index on this equation, since small changes in referactive index lead to changes in λ
SPR
. It is important to note that embedding mediums of nanoparticles of Ref. [
30
] are the same and the large difference between calculated β values is propably due to shape effects of NPs on their extinction spectra. So, for overgeneralizing Eq. 4 one should considers shape and size distribution effects, as well as the effects of refractive index of embedding medium on extinction spectra.
Now the validity of Equations 1, 4, 5,
13
,
14
and
15
about cuboctahedral, octahedral and cubic gold and silver nanoparticles are investigatedusing data in Ref. [
26
] and [
32
]. Their extinction spectra are depicted in Figure
6
(theoreticalspectra obtained using DDA calculation), and the calculated values of
, L
eff
, and β using both
and L
eff
are listed in Table
5
.
Figure 6
(a) Extinction spectra of the Ag and Au nanocubes
[
32
]
, Extinction spectra (solid lines) and results of DDA calculations (dotted lines) of (b) large (edge length 116 nm) and small (67 nm) cubes, (c) large (edge length 122 nm) and small (54 nm) cuboctahedra and (d) large (edge length 236 nm) and small (88 nm) octahedral.
Reprinted with permission from Seo
et al
. [
26
].
Table 5
Calculated values of edge size,,
L
effand β for Au nanoparticles with different shapes
Ref.
[26]
[26]
[26]
[26]
[32]
[32]
[26]
[26]
[26]
[26]
[26]
[26]
[26]
[26]
β using Leff
22.89
38.16
Incalculable
Incalculable
17.26
60.28
14.31
26.35
Incalculable
Incalculable
20.26
32.77
Incalculable
Incalculable
β usingdev¯
25.29
42.17
Incalculable
Incalculable
21.42
74.79
17.75
32.69
Incalculable
Incalculable
23.96
38.75
Incalculable
Incalculable
Calculated Leff(nm)
84.59
84.59
182.61
172.87
64.24
85.53
77.56
78.74
129.52
118.27
90.11
84.59
218.91
233.08
Calculateddev¯(nm)
126.89
126.89
273.92
259.31
96.37
128.30
116.35
118.11
194.28
177.41
135.17
126.89
328.37
349.62
Calculated edge (nm)
76.84
76.84
165.89
157.04
77.67
103.41
93.77
95.19
156.58
142.99
139.98
131.41
340.06
362.07
FWHM (nm)
147.3
245.6
Incalculable
Incalculable
105.6
304
107
198.2
Incalculable
Incalculable
150.8
236.8
Incalculable
Incalculable
λSPR(nm)
591.2
591.2
821.0
791.2
563
534
580.7
582.4
677.2
652.6
600
591.2
945.6
1000
Kind
Theoretical
Experimental
Theoretical
Experimental
Experimental
Experimental
Theoretical
Experimental
Theoretical
Experimental
Theoretical
Experimental
Theoretical
Experimental
Leff(nm)
53.79
53.79
121.53
121.53
51.33
56
44.66
44.66
77.33
77.33
47.90
47.90
128.46
128.46
dev¯
(nm)
89.16
89.16
201.44
201.44
95.53
104.21
83.126
83.126
143.92
143.92
84.97
84.97
227.88
227.88
Edge (nm)
54
54±8
122
122±13
77±6
84±6
67
67±6
116
116±11
88
88±10
236
236±19
Shape
Cuboctagonal
Cuboctagonal
Cuboctagonal
Cuboctagonal
Cubic
Cubic
Cubic
Cubic
Cubic
Cubic
Octahedral
Octahedral
Octahedral
Octahedral
Material
Gold
Gold
Gold
Gold
Gold
Silver
Gold
Gold
Gold
Gold
Gold
Gold
Gold
Gold
Differences between theoretical and experimental values of β for cuboctahedra, cubes and octahedral may due to size distribution and in this regard dispersity should be considered in Eq. 4 and
14
. Although refractive index of the embedding medium of the cuboctahedral particles affects the final results but, for larger particles Eq. 1 and
13
are not applicable since their equivolumediameters are larger than that Khlebtsov determined.
Exact calculated value of edge size of cubic gold particles prepared by Lee and co-workers [
32
] show the applicability of Eq. 1 and
13
for non-spherical particles if the effects of shape, size distribution and medium were considered [
32
]. Moreover, the results obtained for silver nanostructures confirm this expression and reveal that β depends on particles’ matter. It seems that for particles with sharp corners like octahedra, these equations are not applicable. Because sharp corners affect extinction spectra and cause such a high red shift in extinction spectra which modifications of Eq. 1 and 4 would not lead to exact results. Therefore, Eq.
13
,
14
and
15
are more exact for non-spherical particles since they deal with MFP of electrons which is determining in electrical and optical properties of nanoparticles, independent of their shapes.
Conclusion
The applicability of size determination equations based on extinction spectra of spherical and non-spherical silver and gold nanoparticles have been invistigated. It has been found that modified forms of those equations may give more exact results and they should be modified as a function of shape, size distribution and refractive index of particles’ embedding medium in order to be overgeneralized to non-spherical particles instead of sphere only. Furthermore, equations of spherical particles should depend on these parameters to rise to more exact results. Moreover, it has been found that modified forms of those equations do not lead to exact results for particles which have corners with spatial angels less than π/2 sr such as octahedral particles. Such sharp corners cause additional redshift in the extinction spectra which has not been considered in those equations.
Acknowledgements
This work was supported by the Iran national science foundation (INSF). Authors express their special thank to Mrs Effat Zandevakili for great helpful discusions.
Competing interests
The authors declare that they have no competing interests.
Authors’ contributions
AAA carried out the absorption spectroscopy studies, participated in the derivation of equations and prepared the manuscript. AB carried out the derivation of equations and drafted the manuscript. All authors read and approved the final manuscript.
References
Wiley et al. (2005) Shape-Controlled Synthesis of Metal Nanostructures: The Case of Silver (pp. 454-463) 10.1002/chem.200400927
Kittle (1983) 5th edition
Rycenga et al. (2011) Controlling the Synthesis and Assembly of Silver Nanostructures for Plasmonic Applications (pp. 3669-3712) 10.1021/cr100275d
Xia et al. (2009) Shape-Controlled Synthesis of Metal Nanocrystals: Simple Chemistry Meets Complex Physics? (pp. 60–-103)
Zhang et al. (2011) Substrate-Induced Fano Resonances of a PlasmonicNanocube: A Route to Increased-Sensitivity Localized Surface Plasmon Resonance Sensors Revealed (pp. 1657-1663) 10.1021/nl200135r
Alekseeva et al. (2006) Gold nanorods: Synthesis and optical properties (pp. 661-678) 10.1134/S1061933X06060019
Khlebtsov et al. (2004) Plasmon resonances of silver and gold nanorods (pp. 1-11) 10.1117/12.568555
Khlebtsov et al. (2005) The effect of the size, shape, and structure of metal nanoparticles on the dependence of their optical properties on the refractive index of a disperse medium (pp. 77-83) 10.1134/1.1858043
Muskens et al. (2008) Optical extinction spectrum of a single metal nanoparticle: Quantitative characterization of a particle and of its local environment (pp. 205410-205418) 10.1103/PhysRevB.78.205410
Picciotto et al. (2010) Particle size determination of silver nanoparticles generated by plasma laser ablation using a deconvolution method (pp. 706-712) 10.1080/10420151003729722
Manikandan et al. (2003) Blue shift of plasmon resonance in Cu and Ag ion-exchanged and annealed soda-lime glass: an optical absorption study (pp. 86-91) 10.1016/S0921-4526(02)01453-9
Hoonacker and Englebienne (2006) Revisiting Silver Nanoparticle Chemical Synthesis and Stability by Optical Spectroscopy (pp. 359-371)
Khlebtsov and Khlebtsov (2007) MultipolePlasmons in Metal Nanorods: Scaling Properties and Dependence on Particle Size, Shape, Orientation, and Dielectric Environment (pp. 11516-11527)
Khlebtsov (2008) Determination of Size and Concentration of Gold Nanoparticles from Extinction Spectra (pp. 6620-6625) 10.1021/ac800834n
Coronado and Schatz (2003) Surface plasmon broadening for arbitrary shape nanoparticles: A geometrical probability approach (pp. 3926-3934)
Ziman (1979) Cambridge University Press
Bohren (1983) Absorption and Scattering of Light by Small Particles. John Wiley & Sons
Khlebtsov and Dykman (2010) Optical properties and biomedical applications of plasmonic nanoparticles (pp. 1-35) 10.1016/j.jqsrt.2009.07.012
Debye (1909) Der Lichtdruck auf Kugeln von beliebigem Material (pp. 57-136) 10.1002/andp.19093351103
Scaffardi et al. (2005) Sizing gold nanoparticles by optical extinction spectroscopy (pp. 158-163) 10.1088/0957-4484/16/1/030
Alekseeva et al. (2005) Preparation and optical scattering characterization of gold nanorods and their application to a dot-immunogold assay (pp. 6285-6295) 10.1364/AO.44.006285
Ashkarran et al. (2009) Rapid and efficient synthesis of colloidal gold nanoparticles by arc discharge method (pp. 423-428)
Ashkarran (2011) Metal and Metal Oxide Nanostructures Prepared by Electrical Arc Discharge Method in Liquids (pp. 233-266) 10.1007/s10876-011-0376-4
Seo et al. (2008) Directed Surface Overgrowth and Morphology Control of Polyhedral Gold Nanocrystals (pp. 763-767)
Ashkarran et al. (2009) Stability, size and optical properties of colloidal silver nanoparticles prepared by electrical arc discharge in water (pp. 10601-10607)
Yu et al. (2007) Surface Modification of Cetyltrimethylammonium Bromide-Capped Gold Nanorods to Make Molecular Probes (pp. 9114-9119) 10.1021/la701111e
Salabat et al. (2005) Thermodynamic and transport properties of aqueous trisodium citrate system at 298.15 K (pp. 67-70)
Xu et al. (2008) Hydrothermal Syntheses of Gold Nanocrystals: From Icosahedral to Its Truncated Form (pp. 277-284) 10.1002/adfm.200700123
Seo et al. (2008) Shape Adjustment between Multiply Twinned and Single-Crystalline Polyhedral Gold Nanocrystals: Decahedra, Icosahedra, and Truncated Tetrahedra (pp. 2469-2475)
Lee et al. (2011) Refractive Index Sensitivities of Noble Metal Nanocrystals: The Effects of Multipolar Plasmon Resonances and the Metal Type (pp. 7997-8004)