Department of Inorganic Chemistry, Faculty of Chemistry, University of Tabriz, Tabriz, IR
Laboratory of Photonics and Nano Crystals, School of Engineering-Emerging Technologies, University of Tabriz, Tabriz, IR
Abstract
The hydrothermal synthesis and optical properties of undoped and Sb
3+
-doped lithium metasilicate and lithium disilicate nanomaterials were investigated. The microstructures and morphologies of the synthesized Li
2−2
x
Sb
2
x
SiO
3
and Li
2−2
x
Sb
2
x
Si
2
O
5
nanoparticles were studied with powder X-ray diffraction and scanning electron microscopy techniques, respectively. The synthesized undoped and doped lithium metasilicate and lithium disilicate nanomaterials, respectively, are isostructural with the standard bulk Li
2
SiO
3
(space group Cmc2
1
) and Li
2
Si
2
O
5
(space group Ccc2) materials. The electronic absorption and photoluminescence spectra of the synthesized materials are studied. The measured optical properties show dependence on the dopant amounts in the structure.
Background
Lithium ceramics are of research interest because of their technological applications. Among these ceramics, lithium silicates have been investigated as breeder materials for nuclear fusion reactors and as carbon dioxide absorbents in addition to other more well-known applications such as in thermal expansion of glass ceramics used in ceramic hobs[
1
–
6
]. Since the tetrahedral silicate ion (SiO
42−
) provides good mechanical resistance and stability, lithium metasilicate, and lithium disilicate are used as pyroelectric materials in optical waveguide devices[
7
–
12
].
Previously, some research groups have reported the synthesis of lithium silicate doped with La
3+
, Sm
3+
, Gd
3+
, Ho
3+
, Dy
3+
[
13
–
16
], Nd
3+
[
17
], Eu
3+
, and Tb
3+
[
18
] ions. Also, Cr
4+
-doped[
19
], Al
3+
-doped[
20
], and Na
+
-doped[
21
] lithium silicates have been synthesized. Moreover, Rodriguez et al have reported the synthesis of Cr
3+
-and Tm
3+
-doped alkaline silicate glasses[
22
]. On the other hand, Cu
2+
-doped[
23
] and V
5+
-doped[
24
] lithium disilicate glasses have been reported previously. However, to our best knowledge, no work has been devoted to antimony-doped lithium silicates. Catalytic activity[
25
], photo-induced superhydrophilicity[
26
], and optoelectronic properties[
27
] are observed in Sb
3+
-doped materials. Sb
3+
-doped semiconductors exhibit increased electrical conductivity compared to the undoped materials[
28
,
29
]. The doping of Sb
3+
also causes a p-type connection and pins the Fermi level in metal-semiconductor interface[
30
,
31
].
In this context, we sought to reexamine the chemistry of lithium silicates. Herein, we report the hydrothermal synthesis of the Sb
3+
-doped lithium metasilicate (Li
2−2
x
Sb
2
x
SiO
3
) and lithium disilicate (Li
2−2
x
Sb
2
x
Si
2
O
5
) nanoparticles. The effect of the dopant concentration on the morphology of the synthesized materials is investigated. Moreover, the optical properties of the synthesized Li
2−2
x
Sb
2
x
SiO
3
and Li
2−2
x
Sb
2
x
Si
2
O
5
nanomaterials are studied.
Methods
The phase identifications were performed on a powder X-ray diffractometer Siemens D5000 (Siemens AG, Munich, Germany) using Cu-K
α
radiation. The morphology of the obtained materials was examined by a Philips XL30 scanning electron microscope (Royal Philips Electronics, Amsterdam, The Netherlands). Absorption and photoluminescence spectra were recorded on a Analytik Jena Specord 40 (Analytik Jena AG Analytical Instrumentation, Jena, Germany) and a Perkin Elmer LF-5 spectrometer (PerkinElmer Inc., Waltham, MA, USA), respectively.
All the reagents used in the experiments were of analytical grade and used as received without further purification. The Li
2−2
x
Sb
2
x
SiO
3
and Li
2−2
x
Sb
2
x
Si
2
O
5
nanomaterials are synthesized in a one-step hydrothermal process.
Synthesis of lithium metasilicate
LiNO
3
(2 mmol) was added to a solution of silicic acid (4 mmol) in 30 mL of hot 0.01 M aqueous solution of NaOH while stirring. The resultant solution was stirred for further 15 min and then diluted to 60 mL. The obtained mixture was transferred to a 100-mL Teflon-lined stainless steel autoclave and heated for 48, 72, or 96 h at 180°C. The resulting nanomaterials of Li
2
SiO
3
were filtered and dried at 110°C.
Synthesis of lithium disilicate
The preparation of Li
2
Si
2
O
5
was similar to that of Li
2
SiO
3
, except that LiNO
3
(2 mmol) and silicic acid (6 mmol) were used. The obtained mixture was transferred to a 100-mL Teflon-lined stainless steel autoclave and heated for 48, 72, 96, or 120 h at 180°C. The resulting nanomaterials of compound Li
2
Si
2
O
5
were filtered and dried at 110°C.
Synthesis of Sb3+-doped lithium metasilicate (x = 0.01, 0.0125, and 0.015)
Appropriate molar amounts of LiNO
3
(7.9, 5.87, or 5.90 mmol), SiO
2
.H
2
O (15.88, 11.82, or 11.91 mmol, respectively), and Sb
2
O
3
(0.0387, 0.0398, or 0.0449 mmol, respectively) were dissolved in 60 mL of hot NaOH solution (0.53, 0.40, or 0.40 M, respectively) under magnetic stirring at 80°C. The resultant solution was transferred into a 100-mL Teflon-lined stainless steel autoclave. The autoclave was sealed and maintained at 180°C for 48 h then allowed to cool naturally to room temperature, and the resulting white precipitate was recovered.
Synthesis of Sb3+-doped lithium disilicate (x = 0.005, 0.0075, and 0.01)
Appropriate molar amounts of LiNO
3
(13.9, 9.9, or 7.92 mmol), SiO
2
.H
2
O (41.8, 29.81, or 23.92 mmol, respectively), and Sb
2
O
3
(0.035, 0.0377, or 0.0549 mmol, respectively) were dissolved in 60 mL of hot NaOH solution (1.40, 0.99, or 0.80 M, respectively) under magnetic stirring at 80°C. The resultant solution was transferred into a 100-mL Teflon-lined stainless steel autoclave. The autoclave was sealed and maintained at 180°C for 48 h then allowed to cool naturally to room temperature, and the resulting white precipitate was recovered.
Results and discussion
Powder X-ray diffraction analysis
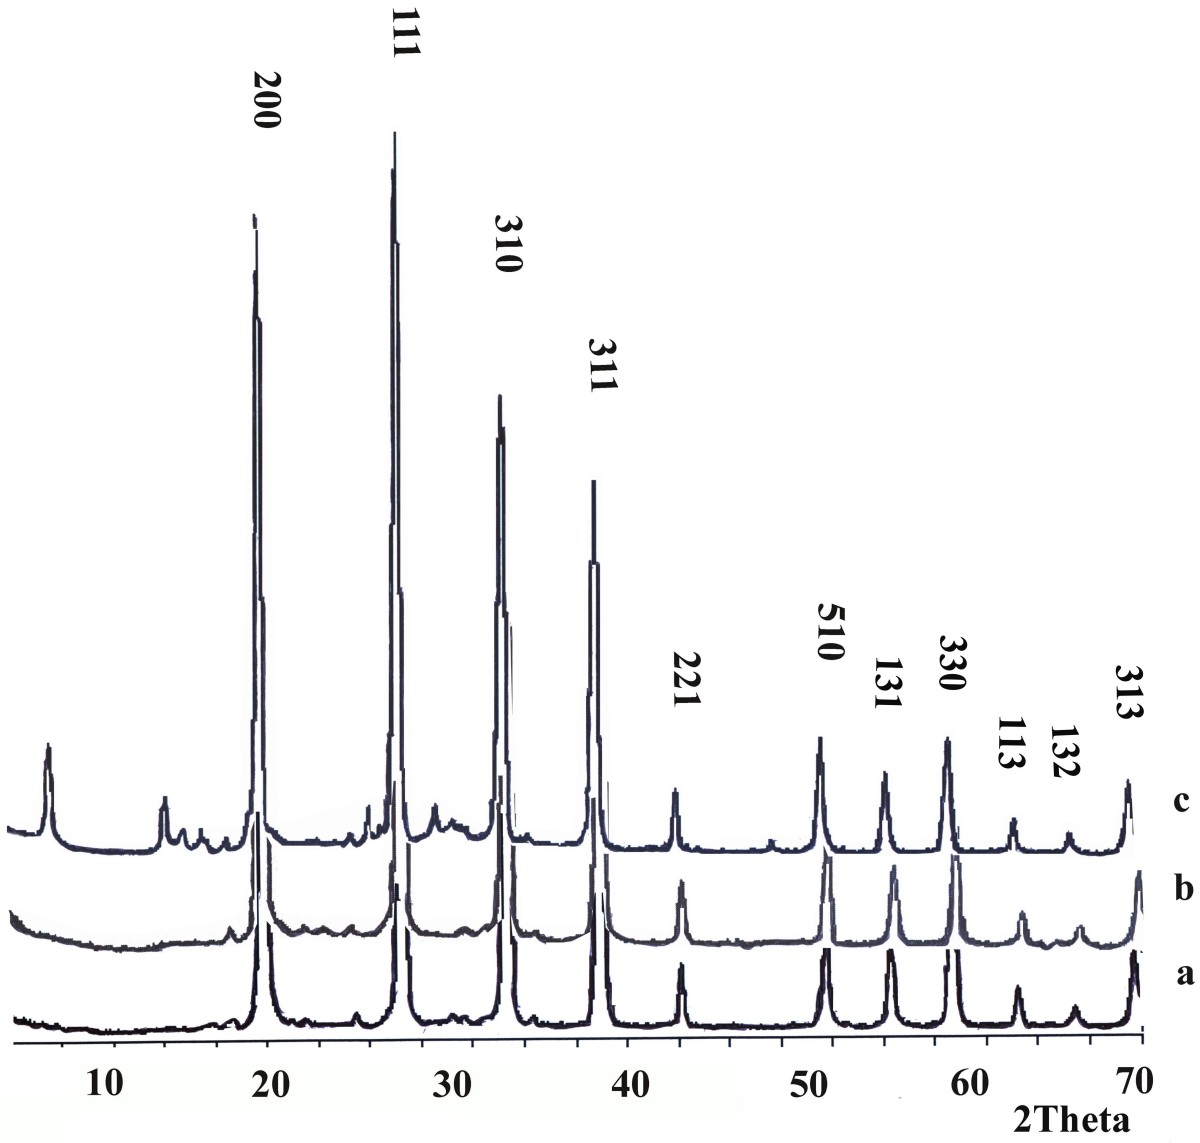
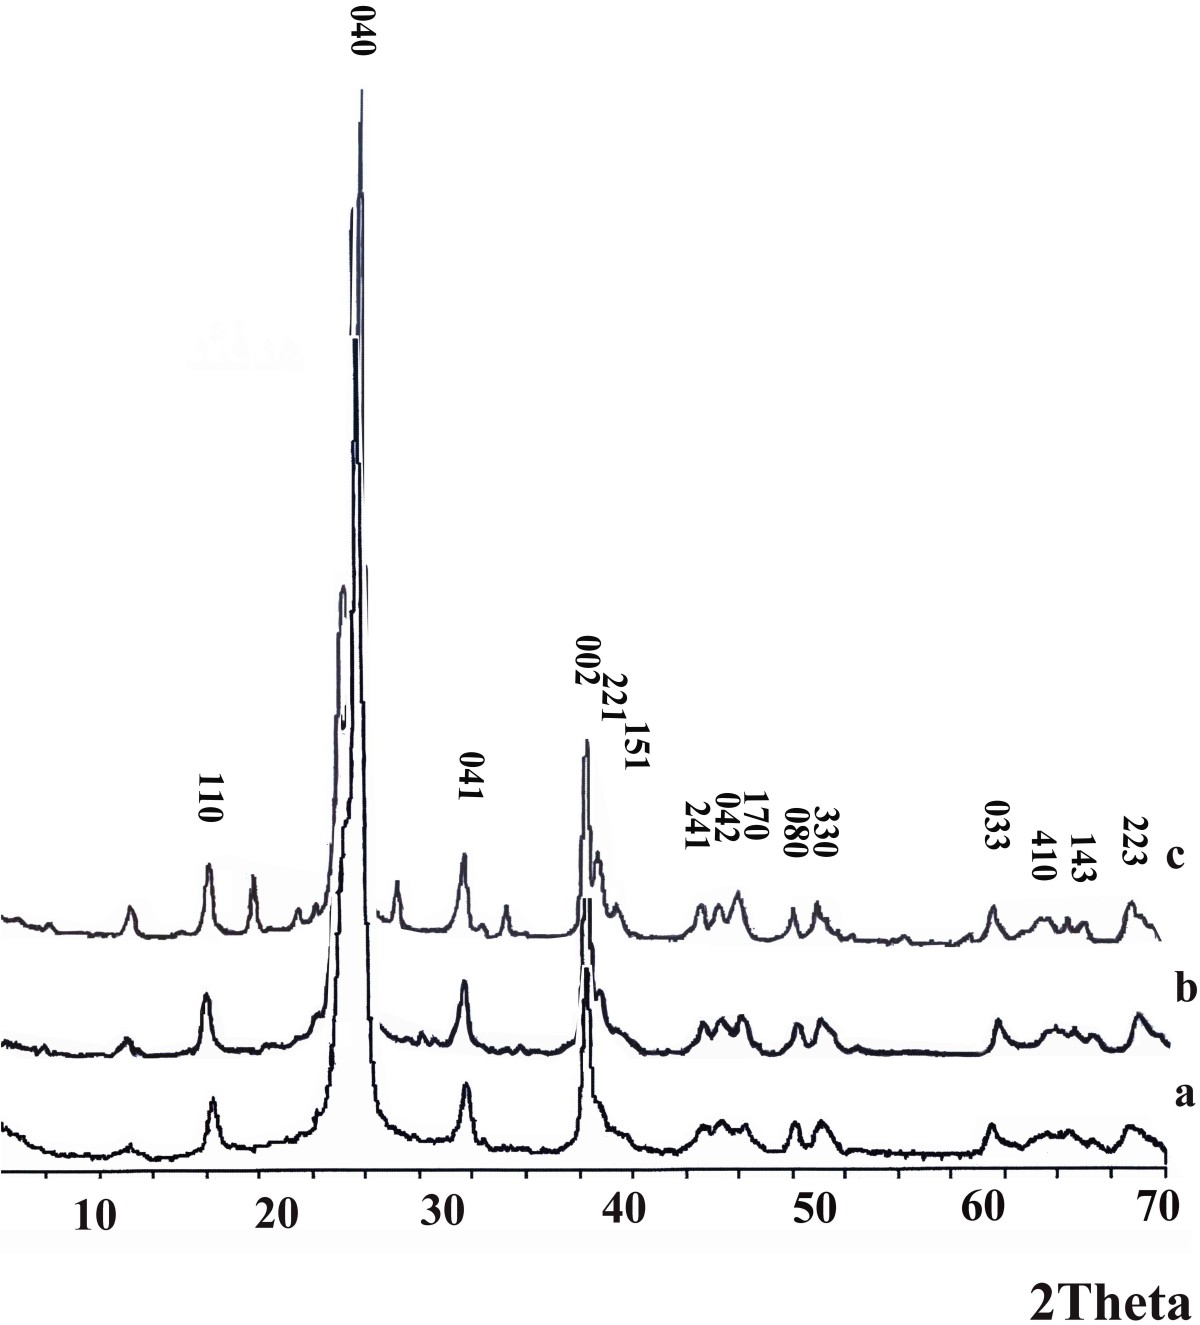
The crystal phases of the synthesized samples were examined by powder X-ray diffraction technique. Figures
1
and
2
show the powder X-ray diffraction (PXRD) patterns of the Sb
3+
-doped lithium metasilicate and lithium disilicate, respectively. Also, the measured PXRD data for hydrothermally synthesized undoped lithium metasilicate and lithium disilicate nanoparticles are summarized in Tables
1
and
2
respectively. The measured powder XRD data are in good agreement with those of standard pure lithium metasilicate (JCPDS 29-0829) and lithium disilicate (JCPDS 15-0637), and the obtained stable phases are isostructural with Li
2
SiO
3
(space group Cmc2
1
)[
32
–
41
] and Li
2
Si
2
O
5
(space group Ccc2)[
42
–
44
]. Moreover, the intense sharp diffraction patterns suggest that the as-synthesized products are well crystallized. The doping limitations are 0-0.75 and 0-1.25 mole% of Sb
3+
for lithium metasilicate and lithium disilicate, respectively. However, for excess mole% concentration of the dopant agent in the reaction mixture, the impurity peaks were observed in the XRD patterns. The diffraction lines at 2
θ
≈ 13°, 26° and 49° are assigned by their peak positions to the excess Sb
2
O
3
[
35
]. As shown in Figures
1
and
2
, the formation of the other phases of lithium silicates and raw materials was already detected for higher mole percentage concentration of the dopant agent in the reaction mixture[
41
,
42
].
Figure 1
PXRD patterns of the synthesized Li2−2xSb2xSiO3nanoparticles, where a isx = 1; b isx = 1.25; and c isx = 1.5 mole%.
Figure 2
PXRD patterns of the synthesized Li2−2xSb2xSi2O5nanoparticles, where a isx = 0.5; b isx = 0.75; and c isx = 1 mole%.
Table 1
Crystallographic data of the hydrothermally synthesized Li2SiO3nanomaterials obtained after 96 h at 180°C
2θ
Intensity
h
k
l
18.881
82
2
0
0
26.979
100
1
1
1
33.05
57
3
1
0
33.176
28
0
2
0
38.419
22
3
1
1
38.608
47
0
0
2
43.23
7
2
2
1
43.317
5
2
0
2
51.467
4
5
1
0
51.711
10
3
1
2
51.793
13
0
2
2
55.448
9
4
2
1
55.579
8
1
3
1
58.955
10
6
0
0
59.183
18
3
3
0
62.998
6
1
1
3
66.219
2
4
2
2
66.335
2
1
3
2
69.343
2
6
2
0
69.732
11
3
1
3
72.715
8
6
0
2
72.917
13
3
3
2
75.793
4
7
1
1
76.129
3
2
4
1
82.286
3
6
2
2
82.526
4
4
2
3
85.511
4
4
4
1
97.986
2
6
2
3
98.258
2
0
4
3
101.044
2
7
1
3
111.023
2
4
4
3
121.852
2
3
1
5
Table 2
Crystallographic data of the hydrothermally synthesized Li2Si2O5nanomaterials obtained after 120 h at 180°C
2θ
Intensity
h
k
l
12.097
12
0
2
0
16.371
6
1
1
0
22.093
2
0
2
1
23.706
45
1
3
0
24.298
100
0
4
0
24.639
30
1
1
1
30.697
2
0
4
1
37.602
4
0
0
2
38.266
4
2
2
1
39.221
4
1
5
1
44.049
2
2
4
1
45.018
2
0
4
2
46.131
30
1
7
0
49.294
2
2
0
2
49.696
2
0
8
0
50.492
2
3
3
0
60.324
2
1
1
3
60.85
2
0
3
3
63.056
2
1
3
3
63.295
16
0
4
3
64.573
2
4
1
0
65.542
4
1
4
3
68.08
2
2
2
3
76.007
6
0
10
2
77.995
2
4
2
2
Compared to those of the nanoparticles of pure lithium silicates, the diffraction lines in the powder XRD patterns of the nanoparticles of Sb
3+
-doped lithium silicates shift to lower 2
θ
values (
Δ
2
θ
= 26.99 (pure) – 26.81 (doped) = 0.15° and Δd = 3.322 Å (doped) − 3.304 Å (pure) = 0.018 Å for Sb
3+
-doped lithium metasilicate; and Δ2
θ
= 24.78 (pure) − 24.68 (doped) = 0.1°, Δd = 3.603 Å (doped) 3.589 Å (pure) = 0.014 Å for Sb
3+
-doped lithium disilicate are calculated via Bragg’s law (
n
λ = 2d
hkl
sin
θ
)). Since the ionic radius of the Sb
3+
(0.76 Å[
45
]) is closer to the ionic radius of Li
+
(0.59 Å[
45
]) rather than the Si
4+
(0.26 Å[
45
]), in the Sb
3+
-doped lithium metasilicate and lithium disilicate, it may be expected that the dopant ion will replace with Li
+
ions. The larger radius of the dopant ion, as compared to the Li
+
, may cause an expansion of the lattice parameter in the Sb
3+
-doped lithium silicate nanomaterials. Since both ionic radii and charges are not the same for the dopant and Li
+
ions, it is also possible that the dopant ion takes an interstitial position in lattice rather than replaces any Li
+
ions, where additional patterns will be observed in XRD pattern[
26
]. However, here, the doped samples show similar powder XRD patterns without any residual or impurity phase formation. The powder XRD patterns of the doped samples suggest the fact that the dopant ions are indeed going to lattice positions rather than to interstitial positions. Moreover, when replacing Li
+
ions, the dopant ions are bound to create some oxygen-related defect centers or Li
+
vacancies for charge compensation. Therefore, it is believed that the dopant ions will be in a structurally disordered environment.
Morphology analysis
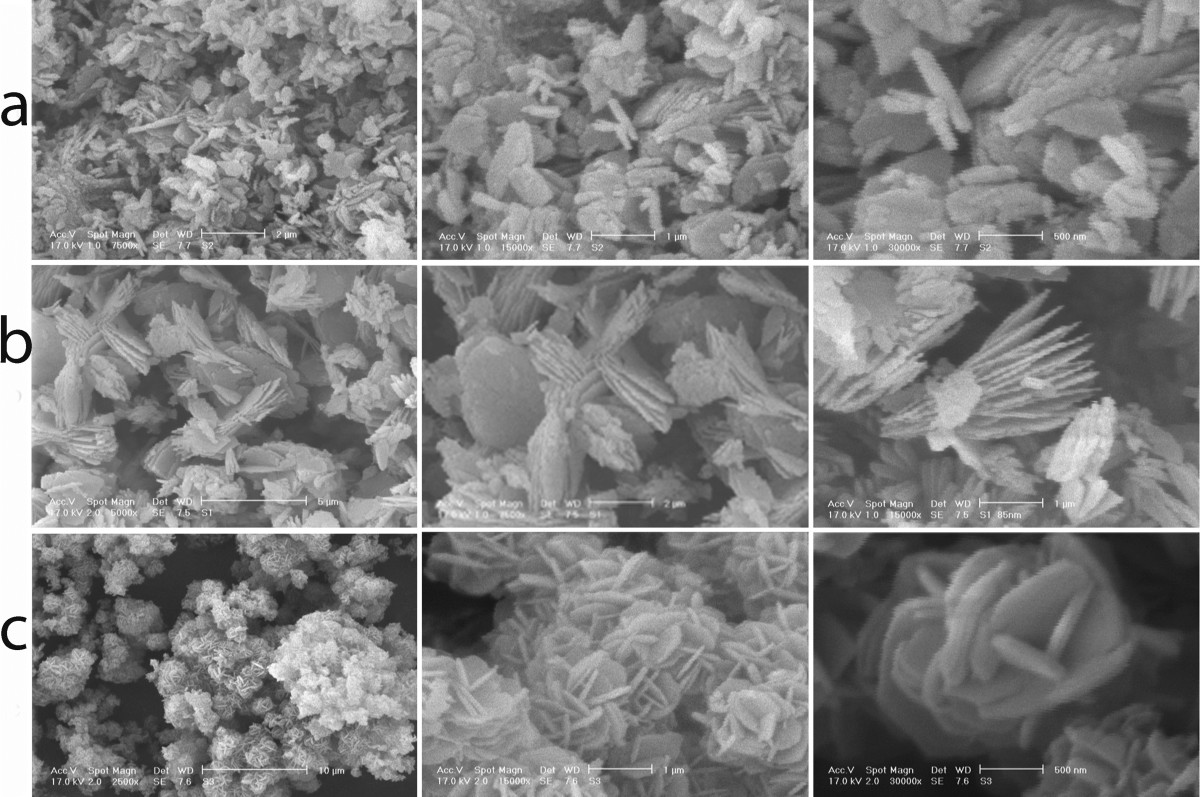
The scanning electron microscopy (SEM) images of the synthesized Li
2
SiO
3
nanomaterials are given in Figure
3
. After 48 h, nonuniform sheet like nanoparticles of Li
2
SiO
3
are obtained (Figure
3
a). The thickness, widths, and lengths of the resultant sheets are approximately 100 nm, 600 nm, and 2 μm respectively. With increasing the reaction time to 72 h, the morphology of the obtained materials has been changed to the very compact sheets with heterogeneous morphology (Figure
3
b). This is while, with the reaction time of 96 h, uniform flower like nanoparticles are obtained (Figure
3
c).
Figure 3
SEM images of the hydrothermally synthesized Li2SiO3nanomaterials obtained after (a) 48, (b) 72, and (c) 96 h at 180°C.
Figure
4
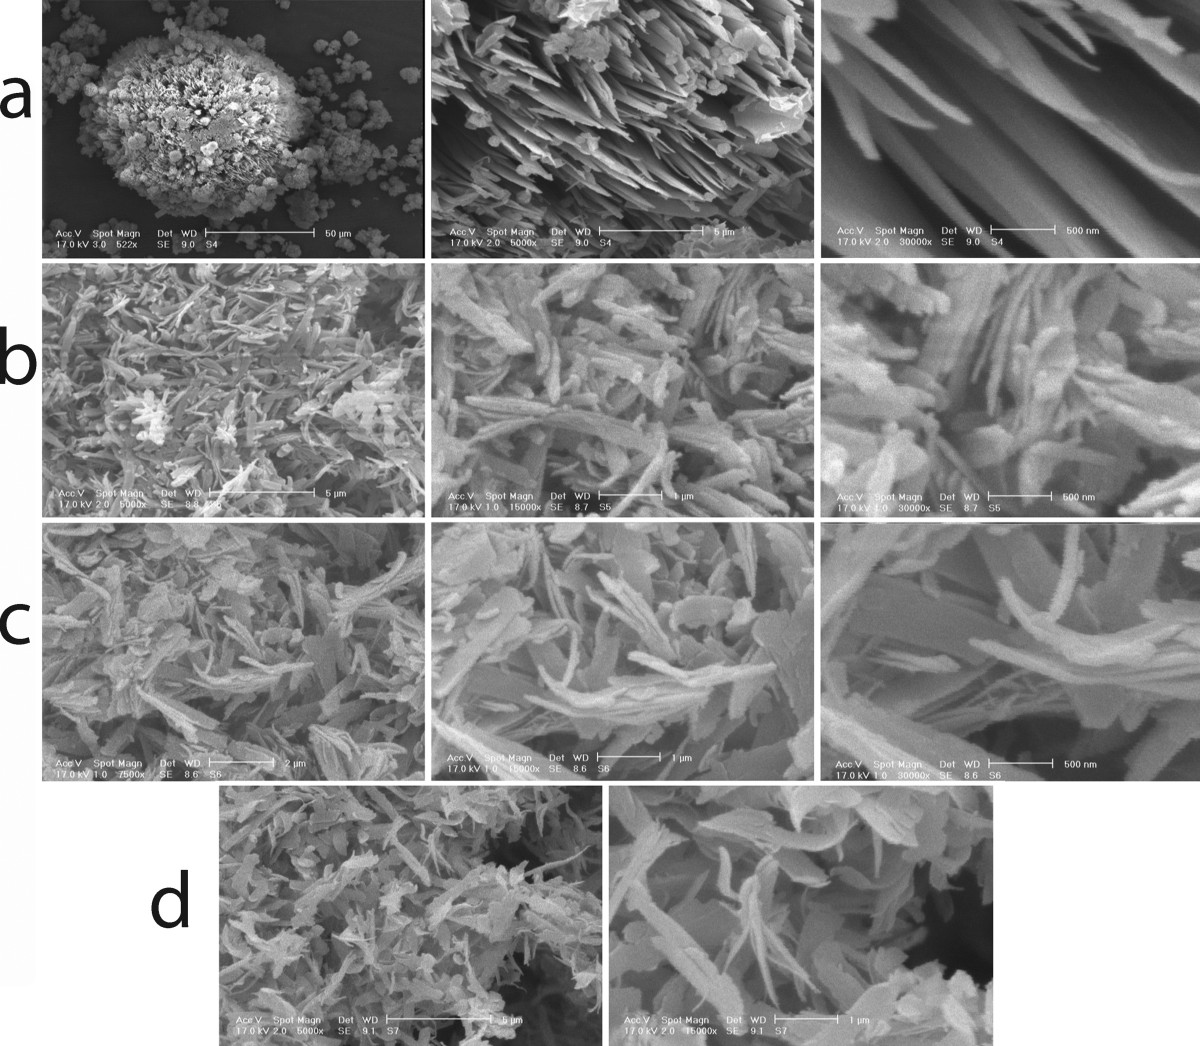
represents the SEM images of the synthesized Li
2
Si
2
O
5
nanomaterials. After 48 h, the morphology of the obtained material is sponge-like, consisting of sheet-like and flower-like nanoparticles (Figure
4
a). With the increasing the reaction time to 72, 96, and 120 h, the morphology of the obtained materials has been changed to the rectangular sheets and high homogeny in the size is achieved. Using field emission scanning electron microscopy, the microstructure analysis of as-synthesized samples was investigated.
Figure 4
SEM images of the hydrothermally synthesized Li2Si2O5nanomaterials obtained after (a
)
48, (b) 72, (c) 96, and (d) 120 h at 180°C.
SEM images of the synthesized Sb
3+
-doped lithium metasilicates (Li
1.98
Sb
0.02
SiO
3
) and (Li
1.975
Sb
0.025
SiO
3
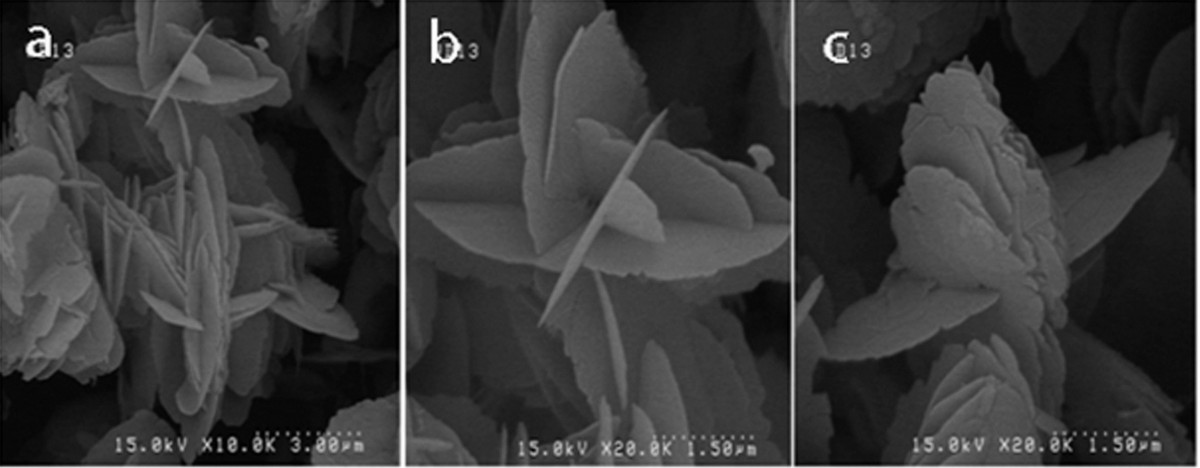
) are given in Figures
5
and
6
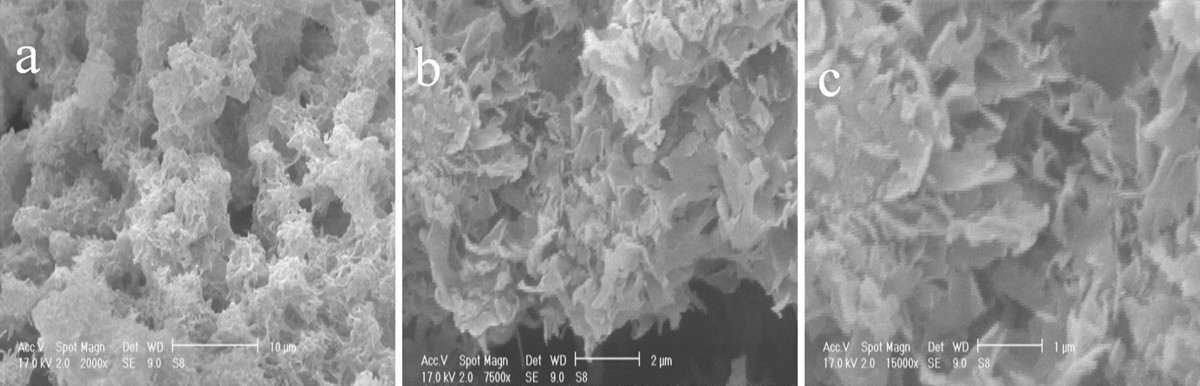
respectively. In Figure
5
a, with low magnification, it is revealed that the sample is composed of two dimensional continuous networks of nanosheet structures. With high magnification in Figure
5
b,c, it is clear that the length of the sheets are about 1 μm and the thickness of the sheets is about 100 nm. With high magnification, as shown in Figures
6
b,c, there are two types of flower-like structures (showing nonuniformity of the morphology). Low magnification in Figure
6
a,b,c shows that the size of each flower is about 3-5 μm and the thickness of the sheets is about 100 nm.
Figure 5
SEM images of the synthesized Li1.98Sb0.02SiO3nanoparticles.
Figure 6
SEM images of the synthesized Li1.975Sb0.025SiO3nanoparticles.
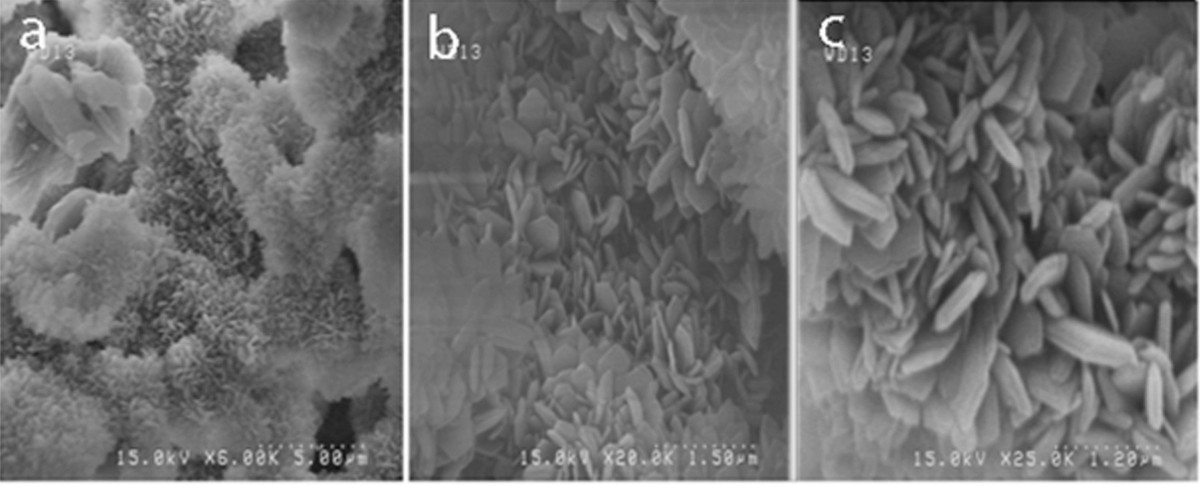
Figures
7
and
8
show the SEM images of the synthesized Sb
3+
-doped lithium disilicate (Li
1.99
Sb
0.01
Si
2
O
5
) and (Li
1.985
Sb
0.015
Si
2
O
5
) respectively. Low magnification in Figure
7
a shows that the sample is composed of a large quantity of individual plates. High magnification images in Figure
7
b,c shows that the plates cut each other. The length of each plate is about 300-350 nm, and the thickness is 80-100 nm. The plates have regular multigonal shapes that are arisen from a substrate.
Figure 7
SEM images of the synthesized Li1.99Sb0.01Si2O5nanoparticles.
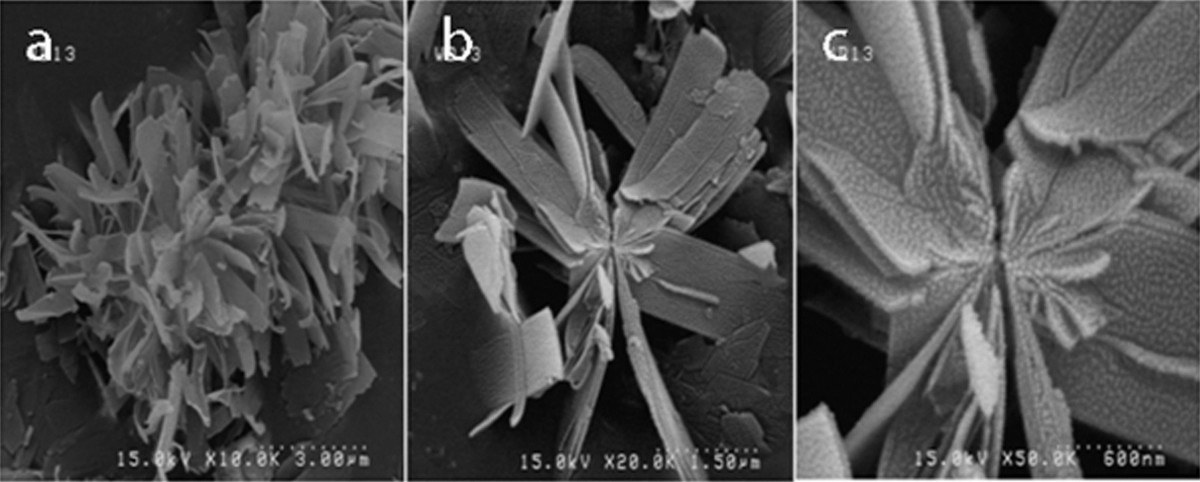
Figure 8
SEM images of the synthesized Li1.985Sb0.015Si2O5nanoparticles.
Figure
8
a shows that with increasing the concentration of Sb
3+
from 0.5 to 0.75 mole%, the morphology of the samples change from nanoplates to nanoflower structures. The synthesized products are composed of a large quantity of individual nanobelts that form highly uniform 3-D flower-like structures. Each nanobelt has a width of about 500 nm and a length of about 2 μm. It seems that numerous nanodot particles cover all over the surface of each nanobelt.
Optical properties
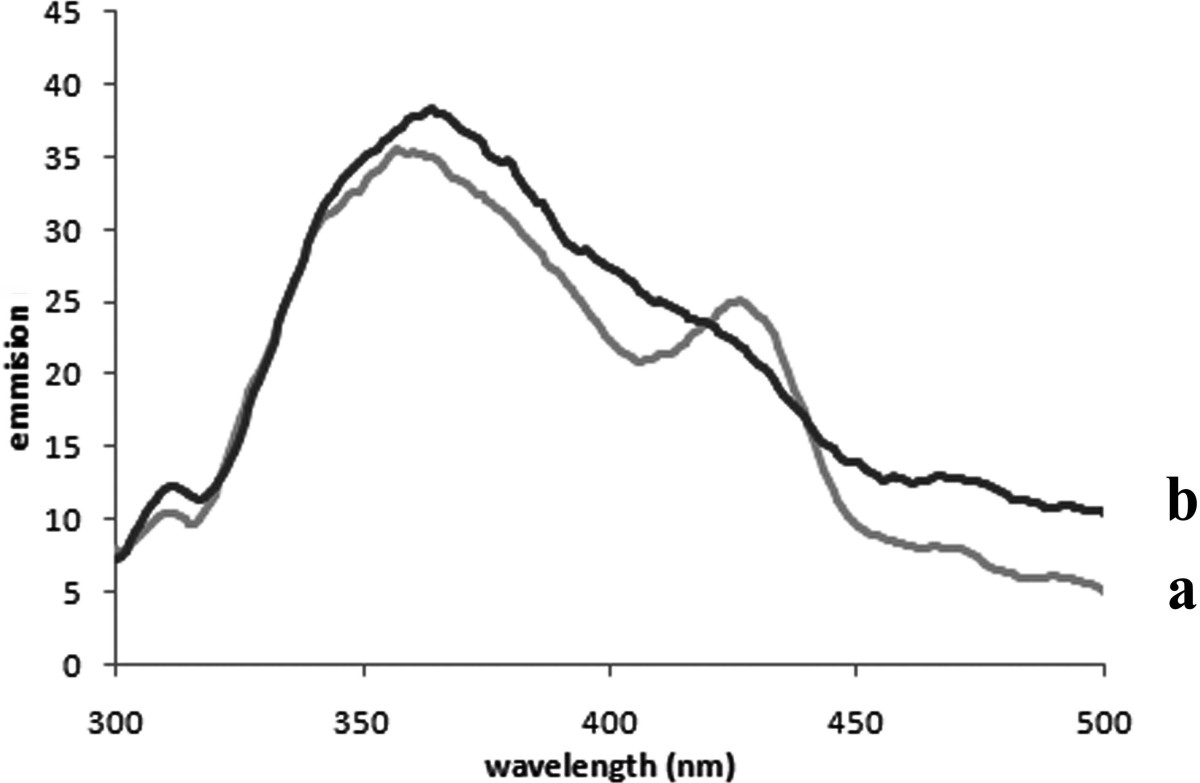
The optical properties of the as-synthesized materials were measured at room temperature. Figure
9
shows photoluminescence spectra of the synthesized Sb
3+
-doped lithium metasilicate nanoflowers (λ
ex
= 232 nm). It is well known that the emission peak positions remain almost unchanged under different excitation wavelengths, showing that it is an intrinsic property of the compound[
44
]. Under excitation with light at 232 nm, as shown in Figure
9
, the main emission peaks are located at 310 and 362 nm with a shoulder at 425 nm. The peak that appeared at 310 nm is assigned to the band edge emission. Also, the broad band with maxima at 362 nm is assigned to the trap state emission of the nanocrystals. With increasing dopant concentration, the intensity of the shoulder at 425 nm also increases. Considering that the energy gap of bulk lithium silicates is above 3.3 eV, the purple-blue photoluminescence at 425 nm (approximately 2.92 eV) is probably due to a triplet to ground state transition of a neutral oxygen vacancy defect, as suggested by
ab initio
molecular orbital calculations for many other well-studied metal oxides[
46
,
47
]. The defects create some dangling bands. Therefore, the energy levels between conduction and valence bands (trap states) would contribute in the band structure, which result in a broad band at visible range.
Figure 9
Photoluminescence spectra of the synthesized Li2−2xSb2xSiO3nanoflowers (λex = 232 nm), where a isx = 1 and b isx = 1.25 mole%.
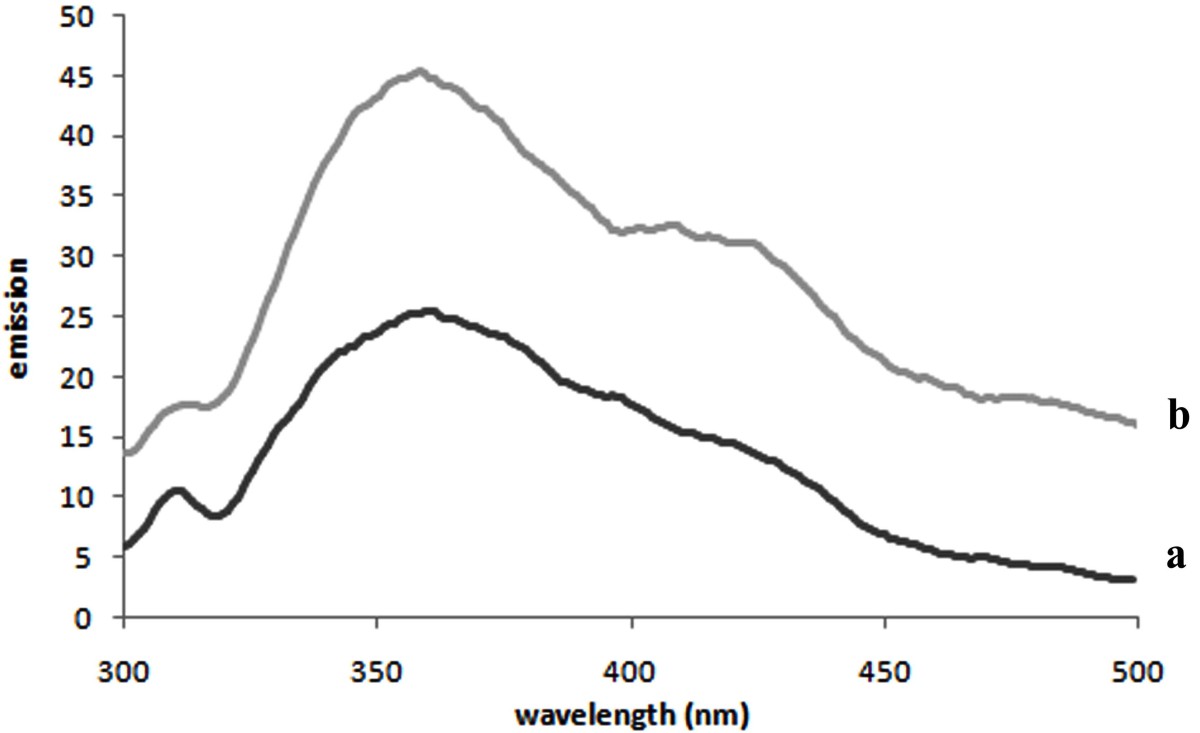
The photoluminescence spectra of the synthesized Sb
3+
-doped lithium disilicate nanoflowers (λ
ex
= 227 nm) is given in Figure
10
. Compared to the described antimony-doped lithium metasilicate nanomaterials, the band edge emission of the synthesized Sb
3+
-doped lithium disilicate nanomaterials occurred at 310 nm upon excitation at 227 nm. Also, the trap state emission of the compound is observed as a weak band at 360 nm under this excitation wavelength. Moreover, compared to the synthesized antimony-doped lithium metasilicate nanomaterials, the emission band which is attributed to the oxygen-related defects in Sb
3+
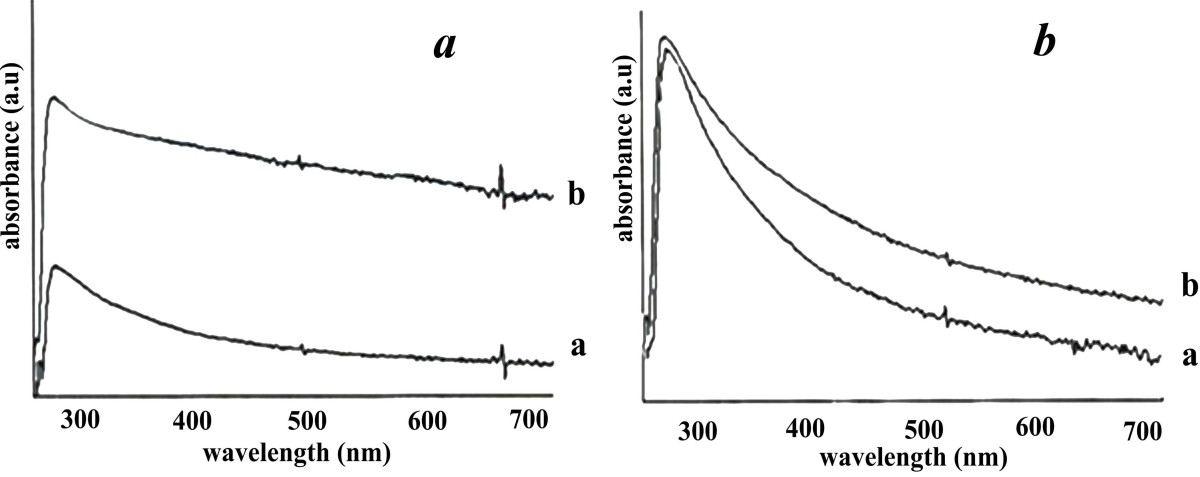
-doped lithium disilicate nanoflowers (appeared as a shoulder at 425 nm) shows a decreasing intensity with the increasing dopant concentration. Electronic absorption spectra of the as-synthesized Sb
3+
-doped Li
2
SiO
3
and Li
2
Si
2
O
5
nanomaterials have been given in Figure
11
a,b. With increasing the dopant concentration in the structure of both of the synthesized Sb
3+
-doped lithium silicates, the band gap slightly shifts to lower energies. A band gap of 4.17 eV for Li
1.98
Sb
0.02
SiO
3
and 4.13 eV for Li
1.975
Sb
0.025
SiO
3
is calculated from the absorption spectroscopy. Also, a band gap of 4.49 eV and 4.46 eV, respectively, was measured for Li
1.99
Sb
0.01
Si
2
O
5
and Li
1.985
Sb
0.015
Si
2
O
5
from the electronic absorption spectroscopy.
Figure 10
Photoluminescence spectra of the synthesizedLi2−2xSb2xSi2O5nanoflowers (λex = 227 nm), where a isx = 0.5 and b isx = 0.75 mole%.
Figure 11
The electronic absorption spectra of the synthesized Li2−2xSb2xSiO3nanomaterials, (a) where a isx = 1 and b isx = 1.25 mole% and (b) where a isx = 0.5 and b isx = 0.75 mole%.
Conclusions
In summary, nanolayers and nanoflowers of Sb
3+
-doped lithium metasilicate and lithium disilicate were synthesized successfully by employing a simple hydrothermal method. We found that the dopant concentration affects the morphology and crystal phase of the final product. As shown by SEM images, with increasing the dopant concentration, layered and flake-like nanocrystals change to flower-like nanomaterials. We found that compared to those of the nanoparticles of pure lithium silicates, the diffraction lines in the powder XRD patterns of the nanoparticles of Sb
3+
-doped lithium silicates shift to lower 2
θ
values. The shift in the diffraction lines might be attributed to the larger radius of the dopant ion, compared to the ionic radius of the Li
+
, which may cause an expansion of the lattice parameters in the Sb
3+
-doped lithium silicate nanomaterials. The synthesized nanomaterials exhibited emerging photoluminescence and electronic absorption optical properties in the UV-visible region, which show dependence on the dopant amounts in the structure. These materials are expected to have a potential application in light-emitting devices and as catalysts.
Authors’ information
SK got his B.S. degree from the University of Birjand in the field of applied chemistry in 2007. He got his M. Sc degree from the University of Tabriz in the field of inorganic chemistry in August 2010. AA got his B.S. and M. Sc. degree from the University of Tabriz, Iran in the field of chemistry in 1972 and 1974, respectively. She got her Ph. D degree from the University of Paris, France in the field of inorganic chemistry in 1978. He is now a professor in inorganic chemistry at University of Tabriz, Iran. MD got her B.S. and M. Sc. degree from the University of Tabriz, Iran in the field of chemistry and inorganic chemistry in 2004 and 2006, respectively. She got her Ph. D degree from the University of Tabriz, Iran in the field of inorganic-solid state chemistry in 2010. She is now post doctorate student and associate professor in the research group of Prof. Dr. Rostami at School of Engineering-Emerging Technologies, University of Tabriz, Iran. AB got his B.S. and M. Sc. degree from the University of Urmia, Iran and from the University of Tabriz in the field of chemistry and inorganic chemistry in 2004 and 2006, respectively. She got her Ph. D degree from University of Tabriz, Iran in the field of inorganic chemistry in 2010.
Acknowledgment
The authors express their sincere thanks to the authorities of University of Tabriz for financing the project.
Competing interests
The authors declare that they have no competing interest.
Authors’ contributions
All authors participated in the experiments, read and approved the final manuscript.
References
Kudo et al. (1988) Tritium release behavior of ceramic breeder candidates for fusion reactors10.1016/0022-3115(88)90303-0
Wen et al. (2007) Effects of P2O5 and sintering temperature on microstructure and mechanical properties of lithium disilicate glass-ceramics10.1016/j.actamat.2007.02.009
Yamaguchi et al. (2007) Membranes for high temperature CO2 separation: part II - lithium silicate based membranes10.1016/j.memsci.2007.01.028
Essaki et al. (2006) CO2 removal at high temperature using packed bed of lithium silicate pellets10.2109/jcersj.114.739
Mosqueda et al. (2006) Chemical sorption of carbon dioxide (CO2) on lithium oxide (Li2O)10.1021/cm060122b
Ilyushin (2002) Phase relations in the LiOH-TiO2-SiO2-H2O system at 500°C and 0.1 GPa10.1023/A:1020098426533
Kumar and Buddhudu (2009) Synthesis and emission analysis of RE3+ (Eu3+ or Dy3+):Li2TiO3 ceramics10.1016/j.ceramint.2007.09.107
Romanowski et al. (2000) Investigation of LiXO3 (X = Nb, Ta) crystals doped with luminescent ions: recent results10.1016/S0925-8388(99)00715-X
Hreniak et al. (2006) Spectroscopic investigations of nanostructured LiNbO3 doped with Eu3+10.1016/j.jlumin.2005.12.054
Yang et al. (2007) Synthesis and luminescence properties of a novel Eu3+-doped γ-LiAlO2 phosphor10.1016/j.matlet.2007.03.011
Ignatovych et al. (2007) Spectral study on manganese- and silver-doped lithium tetraborate phosphors10.1016/j.radphyschem.2007.02.066
Ganesan (2007) Li1−x Sm1+x SiO4 as solid electrolyte for high temperature solid-state lithium batteries10.1007/s11581-007-0110-2
Ganesan et al. (2008) Lithium ion conduction in sol-gel derived lithium samarium silicate solid electrolyte10.1016/j.jallcom.2006.10.126
Ganesan (2009) Synthesis and characterization of lithium holmium silicate solid electrolyte for high temperature lithium batteries10.1007/s10800-008-9754-5
Takeda et al. (2008) Ionic conductivity of LixLa10−x(SiO4)6O3−x sinters10.2109/jcersj2.116.803
Naik et al. (2009) Synthesis and luminescence investigation of RE3+ (Eu3+, Tb3+ and Ce3+)-doped lithium silicate (Li2SiO3)10.1016/j.jlumin.2009.06.001
Deng et al. (2010) Broadband near-infrared emission from Cr4 + - doped transparent glass-ceramics based on lithium silicate10.1016/j.cplett.2009.12.063
Nakazawa et al. (1998) Ab initio MO study on hydrogen release from surface of lithium silicate10.1016/S0022-3115(98)00426-7
Victoria et al. (2008) Textural, structural, and CO2 chemisorption effects produced on the lithium orthosilicate by its doping with sodium (Li4−xNaxSiO4)10.1021/cm802132t
Rodriguez et al. (1997) Site distribution in Cr3+ and Cr3+- Tm3+-doped alkaline silicate glasses10.1016/S0022-2313(96)00372-9
Elbatal et al. (2010) Gamma ray interactions with undoped and CuO-doped lithium disilicate glasses10.1016/j.physb.2010.08.071
Yang et al. (2009) Photoelectrocatalytic activity of two antimony doped SnO2 films for oxidation of phenol pollutants10.1016/S1003-6326(08)60349-0
Sen et al. (2004) The effect of dopant Sb on the superhydrophilicity and the microstructure of the nanoscale TiO2 thin film
Mandalapu et al. (2006) Homojunction photodiodes based on Sb-doped p-type ZnO for ultraviolet detection10.1063/1.2178470
Hu and Hou (2004) Preparation and characterization of Sb-doped SnO2 thin films from colloidal precursors10.1016/j.matchemphys.2004.01.039
Lee and Park (2006) Structural, electrical and optical characteristics of SnO2:Sb thin films by ultrasonic spray pyrolysis10.1016/j.tsf.2006.01.001
Lupan et al. (2010) Synthesis and characterization of Ag- or Sb-doped ZnO nanorods by a facile hydrothermal route
Mandalapu et al. (2007) Al/Ti contacts to Sb-doped p-type ZnO10.1063/1.2759874
Gutiérrez et al. (2008) Low temperature synthesis of Li2SiO3: effect on its morphological and textural properties
Zhang and Easteal (2008) Effect of HNO3 on crystalline phase evolution in lithium silicate powders prepared by sol-gel processes10.1007/s10853-008-2736-5
Fuss et al. (2006) In-situ crystallization of lithium disilicate glass: effect of pressure on crystal growth rate10.1016/j.jnoncrysol.2006.06.038
Zheng et al. (2008) Effects of P2O5 and heat treatment on crystallization and microstructure in lithium disilicate glass ceramics10.1016/j.actamat.2007.10.024
Mahmoud (2007) Blacksburg
Ge et al. (2010) Controllable synthesis and formation mechanism of bow-tie-like Sb2O3 nanostructures via a surfactant-free solvothermal route10.1016/j.jallcom.2010.01.064
Deng et al. (2009) Synthesis and purple-blue emission of antimony trioxide single-crystalline nanobelts with elliptical cross section10.1007/s12274-009-9014-y
Grund et al. (2006) Antimony and antimony compounds Weinheim
De Jong et al. (2005) Glass Weinheim
Peiniger and Piel (1985) A superconducting Nb3Sn coated multicell accelerating cavity10.1109/TNS.1985.4334443
Moura and Hernane (2007) Melting and purification of niobium American Institution of Physics
Ye (2002) Low temperature growth and photoluminescence of well-aligned zinc oxide nanowires10.1016/S0009-2614(02)01018-7
Lide (2006) Taylor and Francis
Hsu et al. (2006) Luminescent properties of solution-grown ZnO nanorods10.1063/1.2214137
Her et al. (2006) Low-temperature growth and blue luminescence of SnO2 nanoblades10.1063/1.2235925