Physics Department, Faculty of Science, Razi University, Kermanshah, 67149-67346, IR
Nano Technology Research Laboratory, Razi University, Kermanshah, 67149-67346, IR
Computational Physical Science Research Laboratory, Department of Nano-Science, Institute for Studies in Theoretical Physics and Mathematics (IPM), Tehran, 19395-5531, IR
Nanosensing properties of hydrogenated edge armchair graphene nanoribbons (HAGNR) are investigated. Using non-equilibrium Green's function method in the tight-binding approach, the effects of hydrogen and oxygen adsorption on current–voltage (
I
-
V
) characteristics and also the electrical conductivity of these systems are calculated. We found that the
I
-
V
curves of these systems change by the adsorption of hydrogen or oxygen molecules. Also, we found that conductivity of these systems at low adsorption concentrations increases, while at high adsorption, concentrations decrease. This could be explained in terms of semiconducting or metallic properties of the adsorbed system which was obtained from electronic properties of our clean HAGNR system. On the other hand, the local density of states of some sites has a metallic behavior, and that of other sites has a semiconducting behavior.
Note that our results are investigated at a fixed temperature
T
= 300 K, i.e., room temperature. By calibrating conductivity in terms of adsorbed gas molecules, one can make a gas nanosensor
Background
In recent years, much attention has been focused on nanoelectronic devices[
1
–
3
] and molecular gas adsorption on single-walled carbon nanotubes and graphene system surfaces[
4
–
13
]. Since gas adsorption by these systems could change their electronic properties, these properties could be used as a gas sensing property. Electronic and transport properties of these systems such as local density of states (LDOS), transmission coefficient, and current–voltage (
IV
) characteristics are investigated by the Landaure formula and non-equilibrium Green's function (NEGF) formalism[
14
–
19
].
One of the various forms of these devices that have attracted a great deal of attention is graphene nanoribbons. The electronic properties of nanoribbons could be determined by the atomic geometry along their edges, namely, zigzag graphene nanoribbons (ZGNR) or armchair graphene nanoribbons (AGNR)[
14
,
20
–
23
]. Usually, ZGNRs have a metallic feature, while AGNRs are semiconducting[
14
].
Here, we extend our previous work[
14
] to investigate the gas sensing properties of these systems. We focus on the AGNRs which were hydrogenated from their edges, called hydrogenated AGNR (HAGNR). Note that, in the previous work, we considered a clean AGNR and ZGNR without adsorption of hydrogen or oxygen molecules, but in this paper, we considered a HAGNR where hydrogen or oxygen molecules were adsorbed on its surface. Our results show that at low adsorption concentrations, more adsorption of hydrogen or oxygen molecules leads to the increase of conductivity of the system, while at high adsorption concentrations, more adsorption leads to the reduction of conductivity. Therefore, conductivity could identify the percentage of adsorbed gas molecules.
This paper is organized as follows: In the ‘Methods’ section, we describe the model and theoretical tools that we used to calculate the local density of states, transmission, and current–voltage curves of the system. In the ‘Results and discussion’ section, we applied this method to our system and analyzed the obtained results. The last section is the conclusion part.
Method
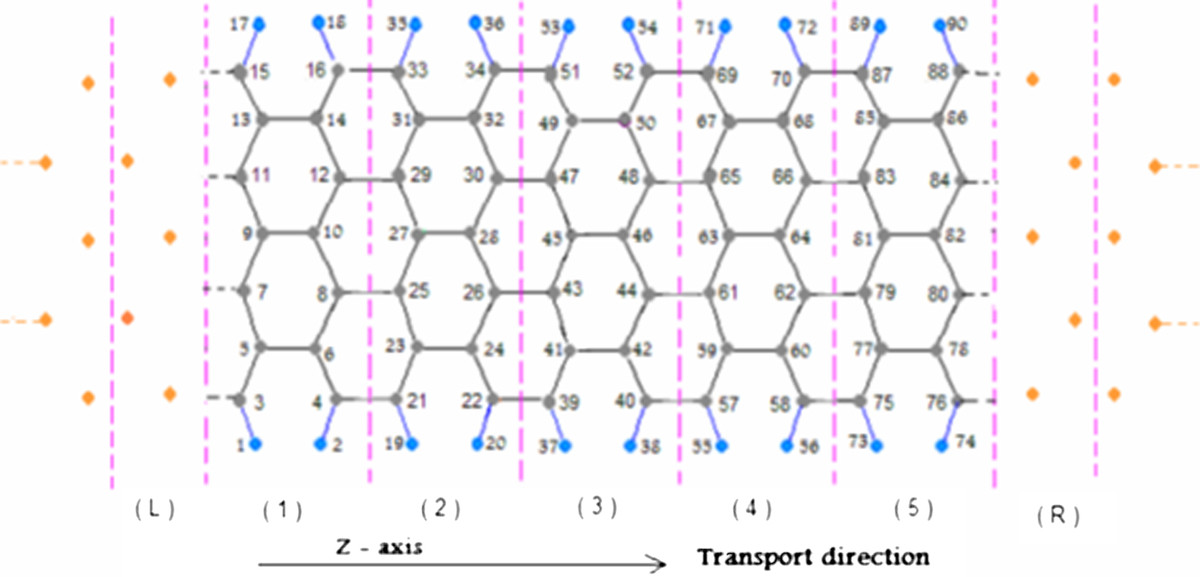
Consider a HAGNR which is attached to two leads from the left to the right. The HAGNR is called the device. To convert this system to a one-dimensional system, we divided it into similar cells along the transport direction where each cell included
N0
atoms (each lattice site included
N0
sublattice atoms). This is illustrated in Figure
1
.
Figure 1
A hydrogenated edge armchair, HAGNR (device), attached to the left (L) and right (R) leads.
The device is divided into similar cells where each cell included 14 carbon atoms and 4 hydrogen atoms. The blue points are hydrogen atoms
In the NEGF formalism, in the absence of applied voltage, the total transmission is given by[
14
,
16
],
T=4Tr[Im(ΣR)GN+1,0rIm(ΣL)G0,N+1a],
where Im
x
stands for the imaginary part of
x
, and
Gii′r(Gii′a)
is the retarded (advance) Green function matrix from
i
unit cell to
i
′. The unit cell number
i
= 0 refers to the right edge of the left lead, and
i
=
N
+ 1 refers to the left edge of right lead. Note that we have
N
unit cells in the device region (
i
= 1,…,
N
) and that in our system,
N
is equal to 5. The retarded and advance Green functions,
Gr
and
Ga
, are defined by
Gr[(E+iη)S−H]=I
and
Ga=[Ga(E)]†,
respectively, where
S
and
I
are the overlap matrix and unitary matrix, respectively.
H
is the Hamiltonian function of the system, and
η
is a positive infinitesimal energy.
∑
L/R
is the left/right lead self-energies. By applying the mode-matching method and using the boundary conditions (the source is put in the left lead), these self-energies are given by
ΣL=HLDFL−1;ΣR=HDR†FR,
where they contain all information about the coupling between the leads and scattering device region (HAGNR) as well as the information about the scattering boundary condition.
HLD/RD
stands for coupling matrix between neighbor cells in the left/right lead and the device. Note that self-energy functions are energy-dependent and expressed in terms of the Bloch matrices
FL/R
where the Bloch matrix depends on the lead modes.
In the real space,
H
is a Hamiltonian matrix where its elements are matrices with a dimension of
N0
×
N0
. For definition of
H
matrix elements, we used the tight-binding representation in the nearest neighbor's approximation.
We consider the hopping between the nearest neighbor atoms in the device equal to 2.75 eV and calculate other hopping and on-site energies with respect to this value.
Using the Landaur approach, we apply a weak bias voltage between the left and right regions in the transport direction. In addition, we ignored phonons effects, and we fixed temperature at room temperature,
T
= 300 K.
The total current using scattering formalism is given as follows:[
15
]
I=2πeη∫T(E){fL(E)−fR(E)}dE,
where
fL/R=1/(1+exp([E−μL/R]/kBT))
is the Fermi function, and
μ
is the chemical potential. Note that the chemical potential of the two leads varies by the applied bias voltage,
V
, as
μL−μR=eV
(source is at the left lead). We assumed that before applying bias voltage, the chemical potential of the whole system is −6
β
where
β
is the hopping energy in the device. After applying bias voltage, all atoms in the left lead cells have the same chemical potential
μL
, while the atoms in the right lead have the same chemical potential
μR
. However, in the device region, the chemical potential varies linearly with respect to the distance from the left edge of the device, i.e., along the transport direction (as shown in Figure
1
).
Our clean system is a HAGNR which included 90 atoms (70 carbon and 20 hydrogen atoms). Now, we consider hydrogen and oxygen molecule adsorption on the top of this system. We assumed that the leads are two-dimensional semi-infinite periodic wires of copper with body centered square lattices where the widths of all regions are the same. In the next section, we present our results.
Result and discussion
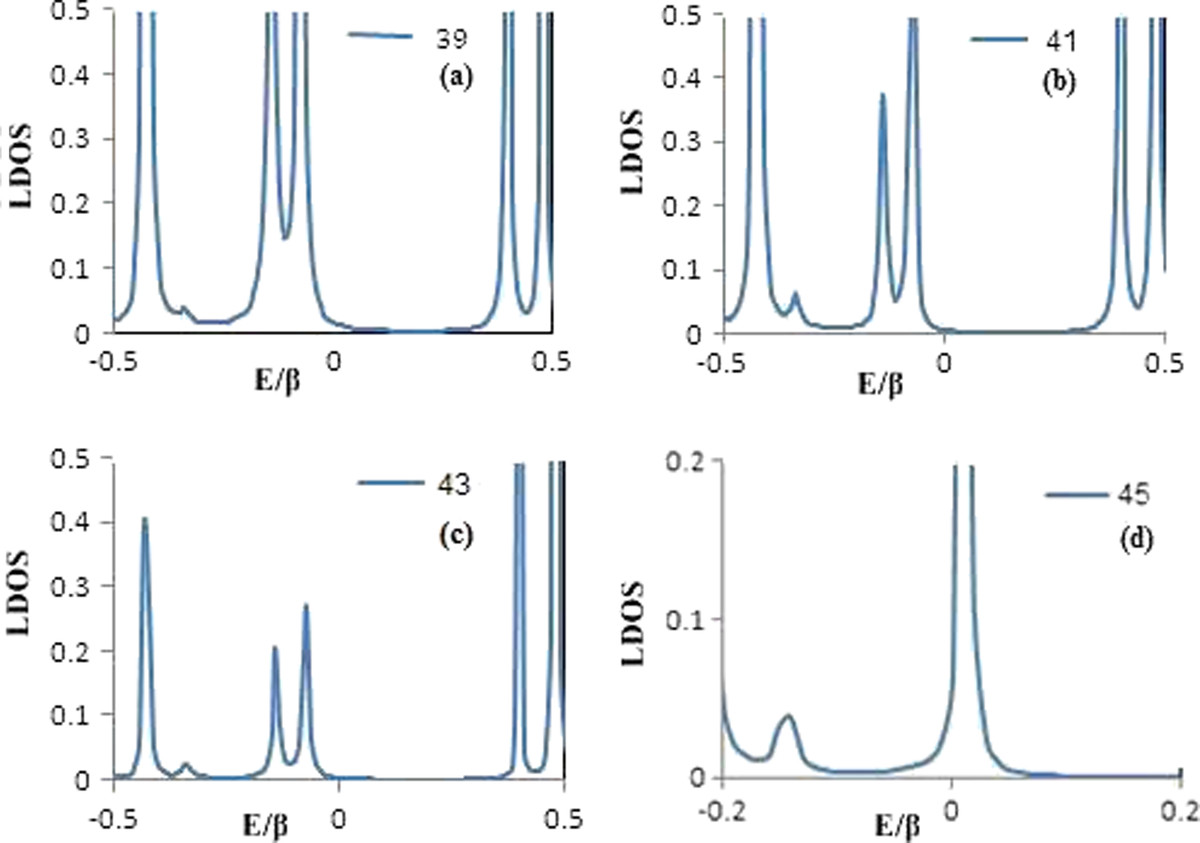
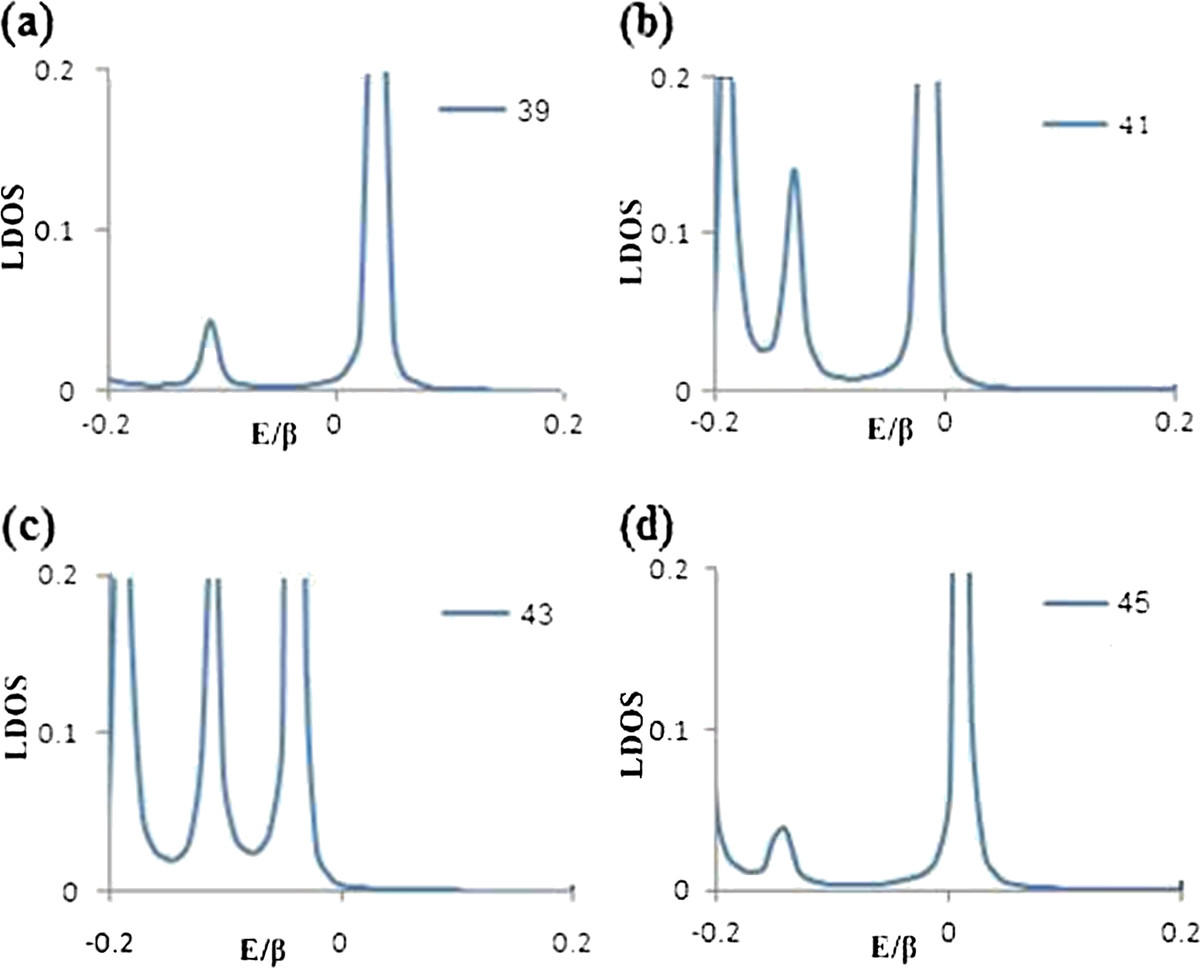
To see effects of hydrogen/oxygen molecule adsorption on the electronic properties of HAGNRs, first, we investigate electronic properties of our clean HAGNR system. Figure
2a,b,c,d
illustrates the comparison of LDOS of sites 39, 41, 43, and 45 along the width of the clean HAGNR, respectively. It is obvious that LDOS of sites 39 and 45 have a metallic behavior, while those of sites 41 and 43 show a semiconducting feature. Therefore, the upper (lower) edge sites along the length of the HAGNR construct metallic regions separated by semiconducting regions.
Figure 2
Comparison of LDOS of sites 39, 41, 43, and 45 along the width of clean HAGNR.
(
a
) LDOS of site 39, (
b
) LDOS of site 41, (
c
) LDOS of site 43, and (
d
) LDOS of site 45
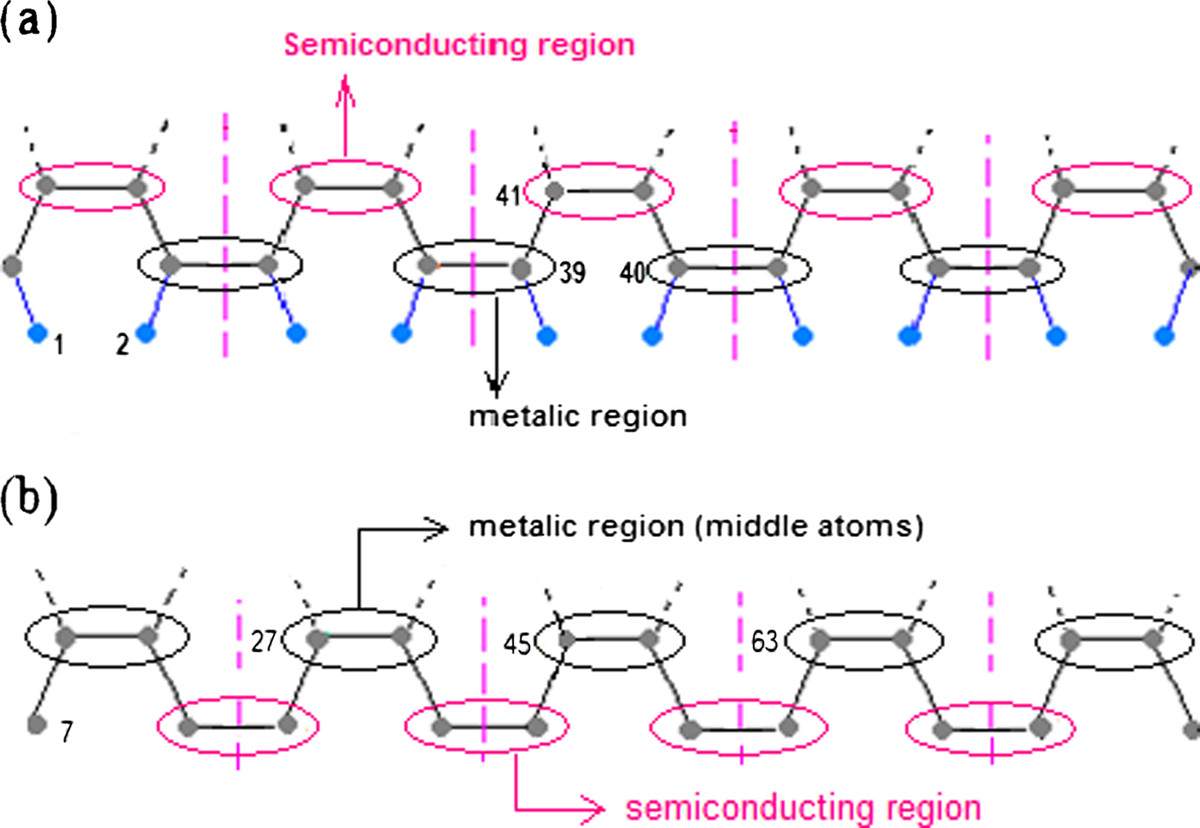
Figure
3a
shows the metallic and semiconducting regions for the lower edge nanowire. The middle nanowire is constructed from metallic and semiconducting regions of double-site atoms along the length of the HAGNR. Figure
3b
shows this nanowire. Hence, at low adsorptions, adsorption of a hydrogen/oxygen molecule by a metallic or semiconducting carbon atom of the HAGNR could change the electronic properties of the HAGNR in different ways. Adsorptions of H
2
/O
2
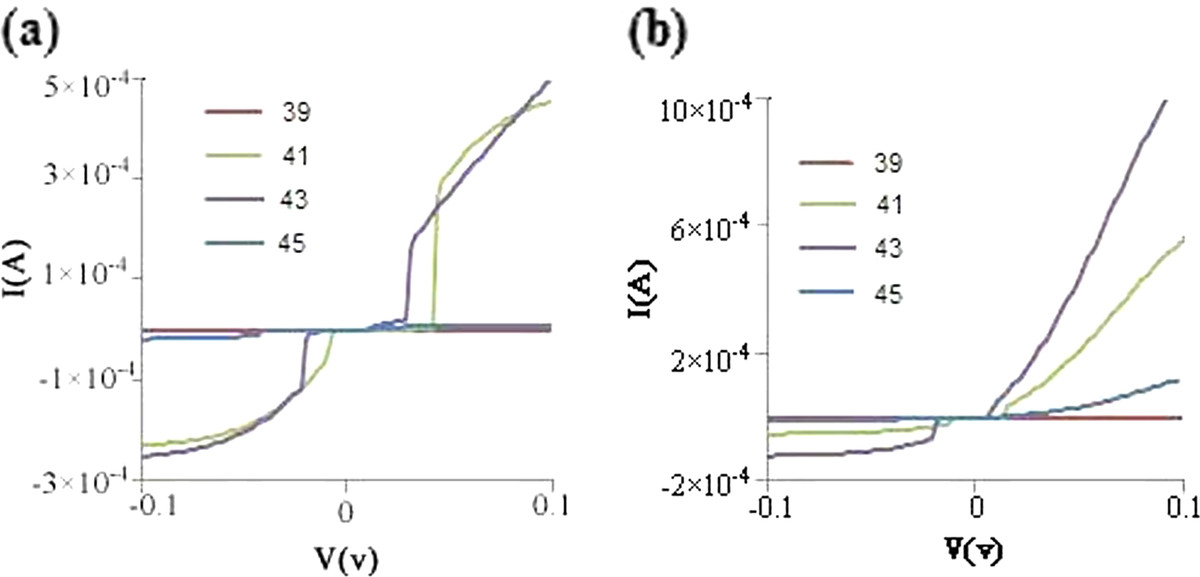
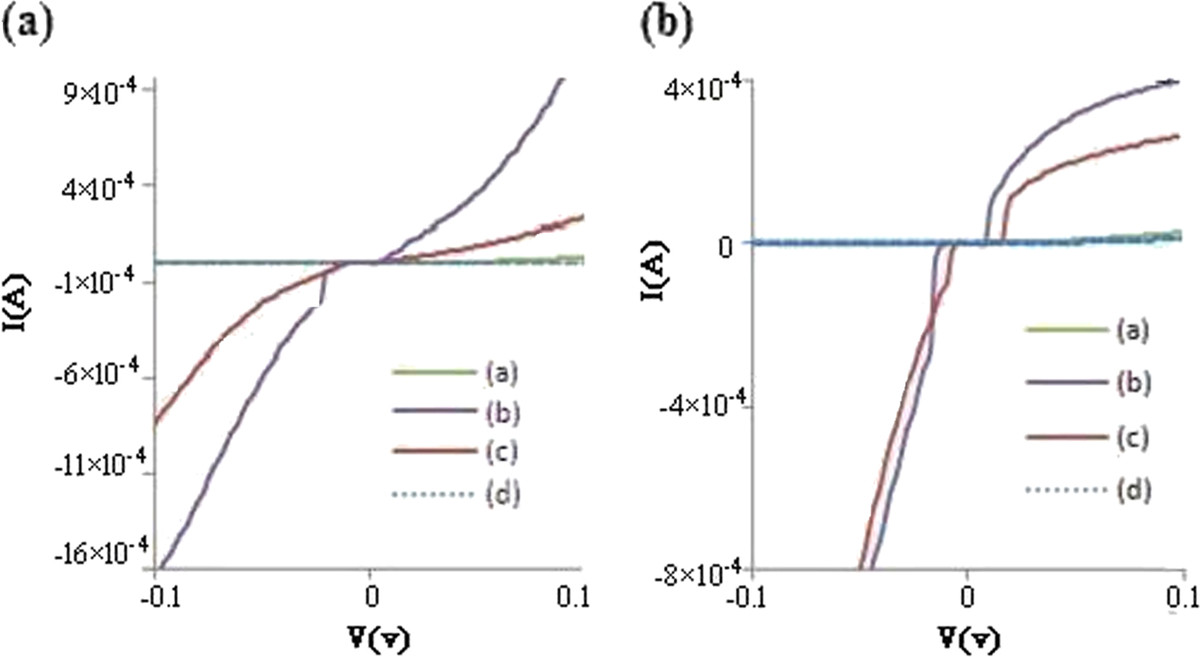
by metallic sites lead to a reduction of current, while those by semiconducting sites lead to an increase in current. Figure
4a,b
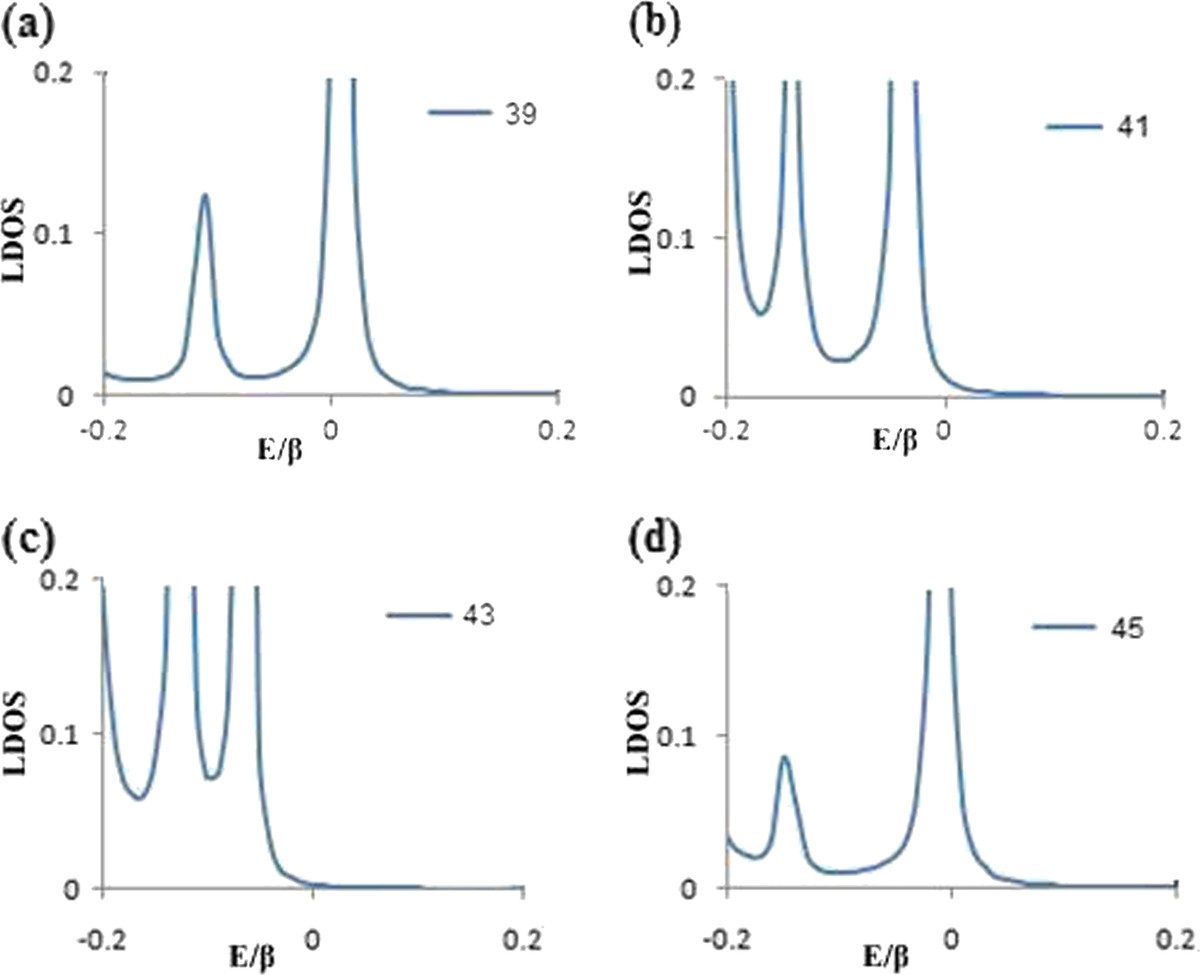
shows the current–voltage characteristics of our system when one hydrogen/oxygen molecule is adsorbed by sites 39, 41, 43, and 45 along the width of the HAGNR. To explain this result, we should look at the LDOS of these sites for the adsorbed system. Figures
5a,b,c,d
and
6a,b,c,d
show LDOS of sites 39, 41, 43, and 45 when one H
2
/O
2
is adsorbed by sites 39, 41, 43, or 45. These figures show that adsorption of H
2
/O
2
by semiconducting sites converted these sites to metallic sites. Hence, this adsorption increases the current, while adsorption of H
2
/O
2
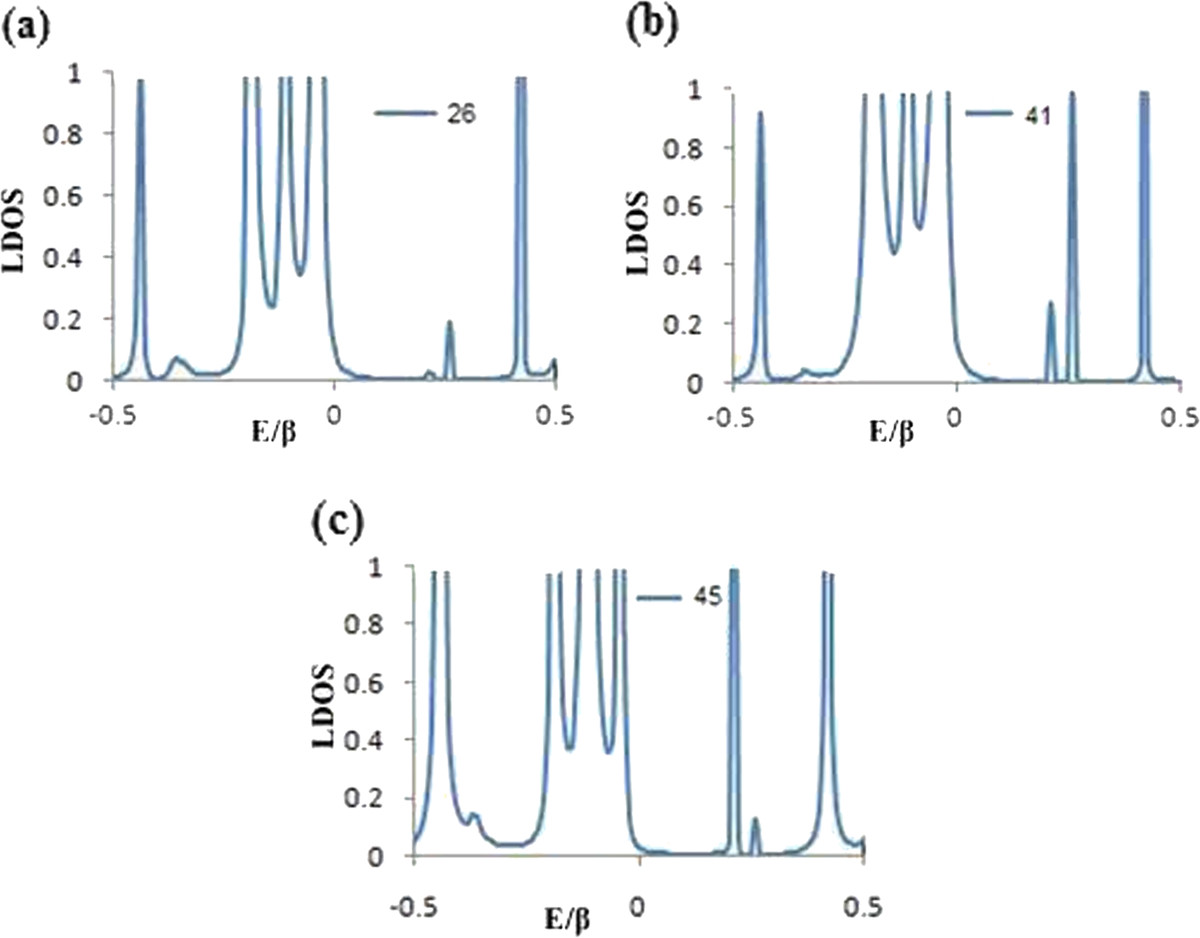
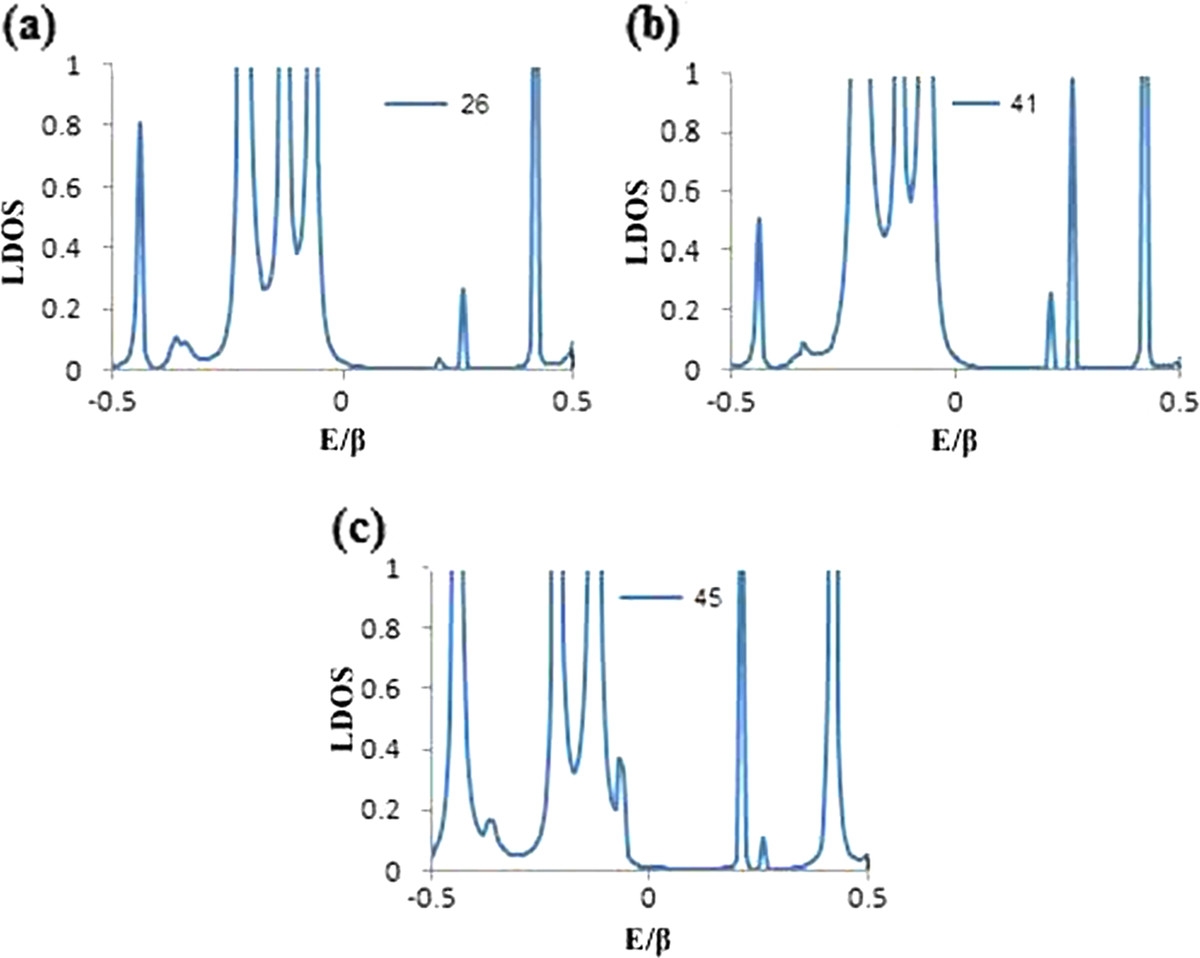
by metallic sites reduces the current. To clarify this result, we plotted LDOS of the neighbor sites of adsorption site 43. Figures
7a,b,c
and
8a,b,c
show LDOS of sites 26, 41, and 45, respectively, when one H
2
/O
2
is adsorbed by site 43. The semiconducting sites 26 and 41 are converted to metallic sites. In the next stage, we investigate adsorption concentration effects on the
I
-
V
curve of the HAGNR. Figure
9a,b
shows
I
-
V
curves of the HAGNR when three H
2
or three O
2
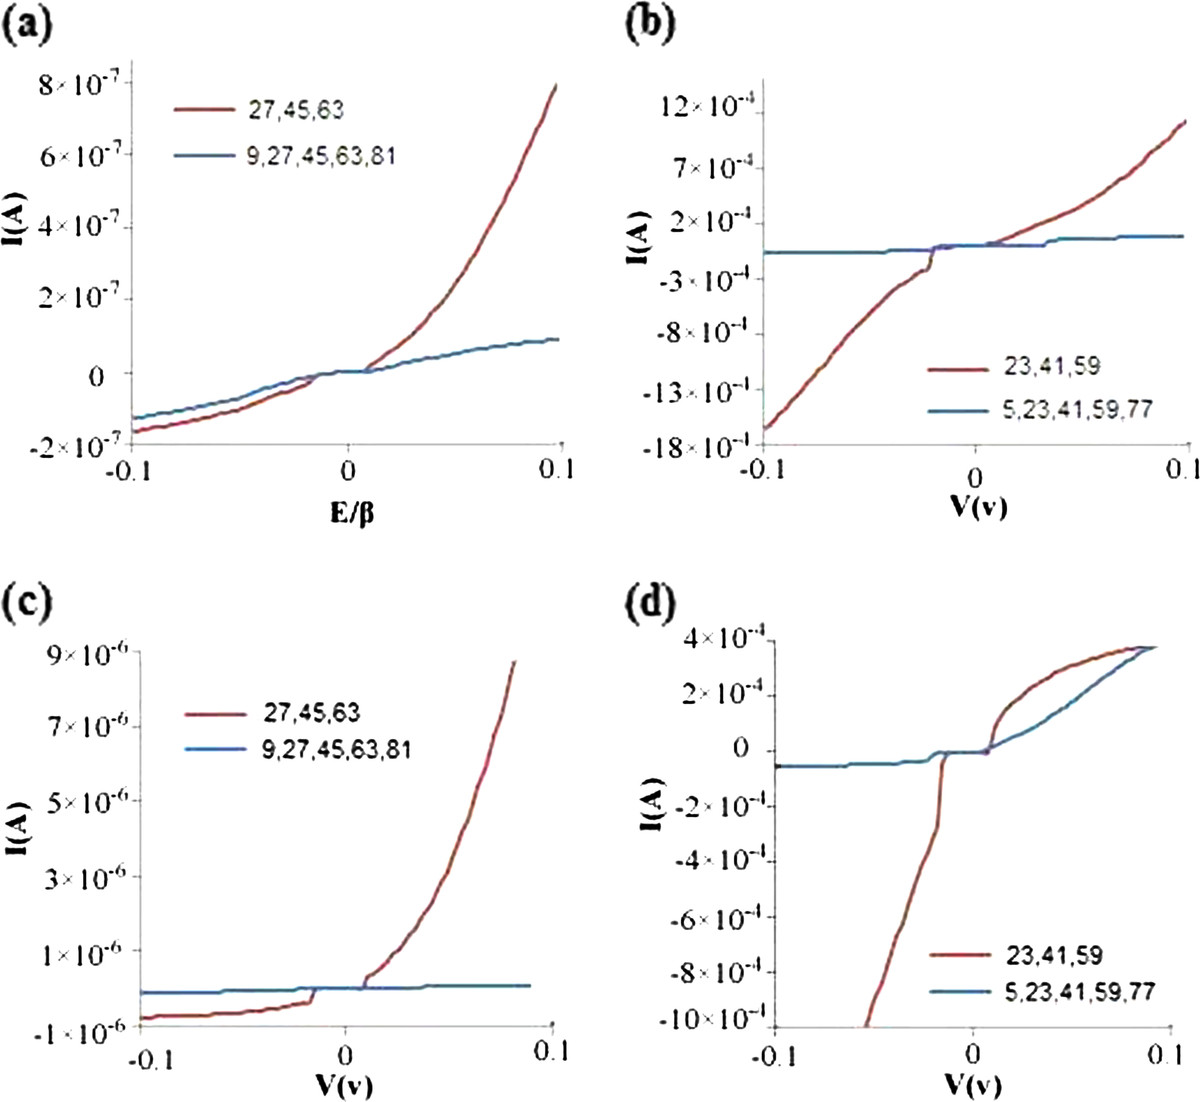
molecules are adsorbed by (a) sites 21, 39, and 57; (b) sites 23, 41, and 59; (c) sites 25, 43, and 61; and (d) sites 27, 45, and 63 along its length, respectively. We found that at high adsorption concentrations, adsorption by semiconducting sites with bigger energy gap increases current more than smaller energy gap semiconductor sites, and adsorption by more metallic sites decreases current with respect to those sites with low metallic features. Figure
10
illustrates the comparison of
I
-
V
curves in which metallic sites 27, 45, and 63 adsorbed three H
2
/O
2
molecules (Figure
10a
); sites 9, 27, 45, 63, and 81 adsorbed five H
2
/O
2
molecules (Figure
10c
); semiconducting sites 23, 41, and 59 adsorbed three H
2
/O
2
molecules (Figure
10b
); and sites 5, 23, 41, 59, and 77 adsorbed five H
2
/O
2
molecules (Figure
10d
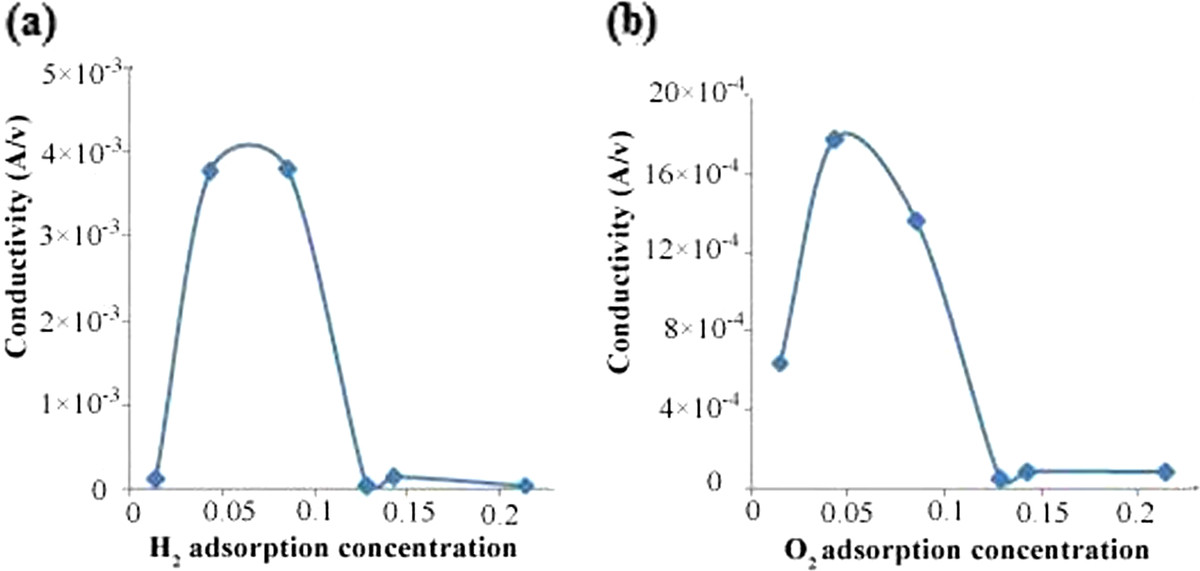
). We found that by increasing adsorption concentration, current decreases. To complete our results, we calculated the conductivity of the system in terms of H
2
/O
2
adsorption concentration. Figure
11a,b
illustrates conductivity in terms of H
2
/O
2
concentration, respectively. Since at high adsorptions these systems have metallic features, so for high concentrations, we expect such reductions.
Figure 3
Metallic and semiconducting regions for (a) lower edge nanowire and (b) middle nanowire
Figure 4
Current–voltage characteristics.I
-
V
characteristics of our system when (
a
) one hydrogen molecule or (
b
) one oxygen molecule is adsorbed by sites 39, 41, 43, and 45 along the width of HAGNR
Figure 5
LDOS of sites 39, 41, 43, and 45 when one H2isadsorbed by each site.
(
a
) LDOS of site 39, (
b
) LDOS of site 41, (
c
) LDOS of site 43, and (
d
) LDOS of site 45
Figure 6
LDOS of sites 39, 41, 43, and 45 when one O2isadsorbed by each site.
(
a
) LDOS of site 39, (
b
) LDOS of site 41, (
c
) LDOS of site 43, and (
d
) LDOS of site 45
Figure 7
LDOS of sites 26, 41, and 45 when site 43 adsorbed a H2molecule.
(
a
) LDOS of site 26, (
b
) LDOS of site 41, and (
c
) LDOS of site 45
Figure 8
LDOS of sites 26, 41, and 45 when site 43 adsorbed an O2molecule.
(
a
) LDOS of site 26, (
b
) LDOS of site 41, and (
c
) LDOS of site 45
Figure 9
I-Vcurves of HAGNR.I
-
V
curves of HAGNR when three (
a
) H
2
or three (
b
) O
2
molecules are adsorbed by (a) sites 21, 39, and 57; (b) sites 23, 41, and 59; (c) sites 25, 43, and 61; and (d) sites 27, 45, and 63 along its length
Figure 10
Comparison ofI-Vcurves.
Comparison of
I
-
V
curves when metallic sites 27, 45, and 63 and sites 9, 27, 45, 63, and 81 adsorbed (
a
) three and (
c
) five H
2
/O
2
molecules, respectively. Semiconducting sites 23, 41, and 59 and sites 5, 23, 41, 59, and 77 adsorbed (
b
) three and (
d
) five H
2
/O
2
molecules, respectively
Figure 11
Conductivity of HAGNR in Figure1in terms of (a) H2and (b) O2adsorption concentration
Conclusions
Using the NEGF (non equilibrium Green's function) method in the tight-binding approach, effects of gas adsorption on the electronic properties of hydrogenated armchair graphene nanoribbons are investigated. We found that at a low adsorption concentration, adsorption by metallic HAGNR sites decreases current, while adsorption by semiconductor HAGNR sites increases current in the current–voltage curve of these systems. At high adsorption concentrations, the whole system becomes metallic, so by increasing adsorption concentrations, current always decreases. Also, we found that at low adsorption, the conductivity of the system increases by increasing adsorption, while at high adsorptions, the conductivity of the system decreases by increasing adsorption. These results could be used to make a gas nanosensor.
Competing interests
The authors declare that they have no competing interests.
Authors' contributions
The authors' contributions in this article are the same. All authors read and approved the final manuscript.
Wang et al. (2009) Chemical self-assembly of graphene sheets (pp. 336-342) 10.1007/s12274-009-9031-x
Moradian and Mohammadi (2007) Finite-concentration gas molecule adsorption on carbon nanotubes investigated by a tight-binding approach10.1103/PhysRevB.76.155432
Moradian et al. (2008) Investigation of gas sensing properties of armchair graphene nanoribbons10.1088/0953-8984/20/42/425211
Panella et al. (2005) Hydrogen adsorption in different carbon nanostructures (pp. 2209-2214) 10.1016/j.carbon.2005.03.037
Sevinçli et al. (2008) Electronic and magnetic properties of 3d transition-metal atom adsorbed graphene and graphene nanoribbons10.1103/PhysRevB.77.195434
Giannozzi et al. (2003) Oxygen adsorption on graphite and nanotubes10.1063/1.1536636
Schimmel et al. (2003) Hydrogen adsorption in carbon nanostructures: comparison of nanotubes, fibers, and coals (pp. 4764-4770) 10.1002/chem.200304845
Ataca et al. (2009) Hydrogen storage of calcium atoms adsorbed on graphene: first-principles plane wave calculations10.1103/PhysRevB.79.041406
Jagiello and Thommes (2004) Comparison of DFT characterization methods based on N2, Ar, CO2, and H2 adsorption applied to carbons with various pore size distributions (pp. 1227-1232) 10.1016/j.carbon.2004.01.022
Moradian et al. (2009) Investigation of electronic transport through graphene nanoribbon quantum dots10.1016/j.physe.2008.12.014
Xue et al. (2002) First-principles based matrix Green's function approach to molecular electronic devices: general formalism (pp. 151-170) 10.1016/S0301-0104(02)00446-9