Results and discussion
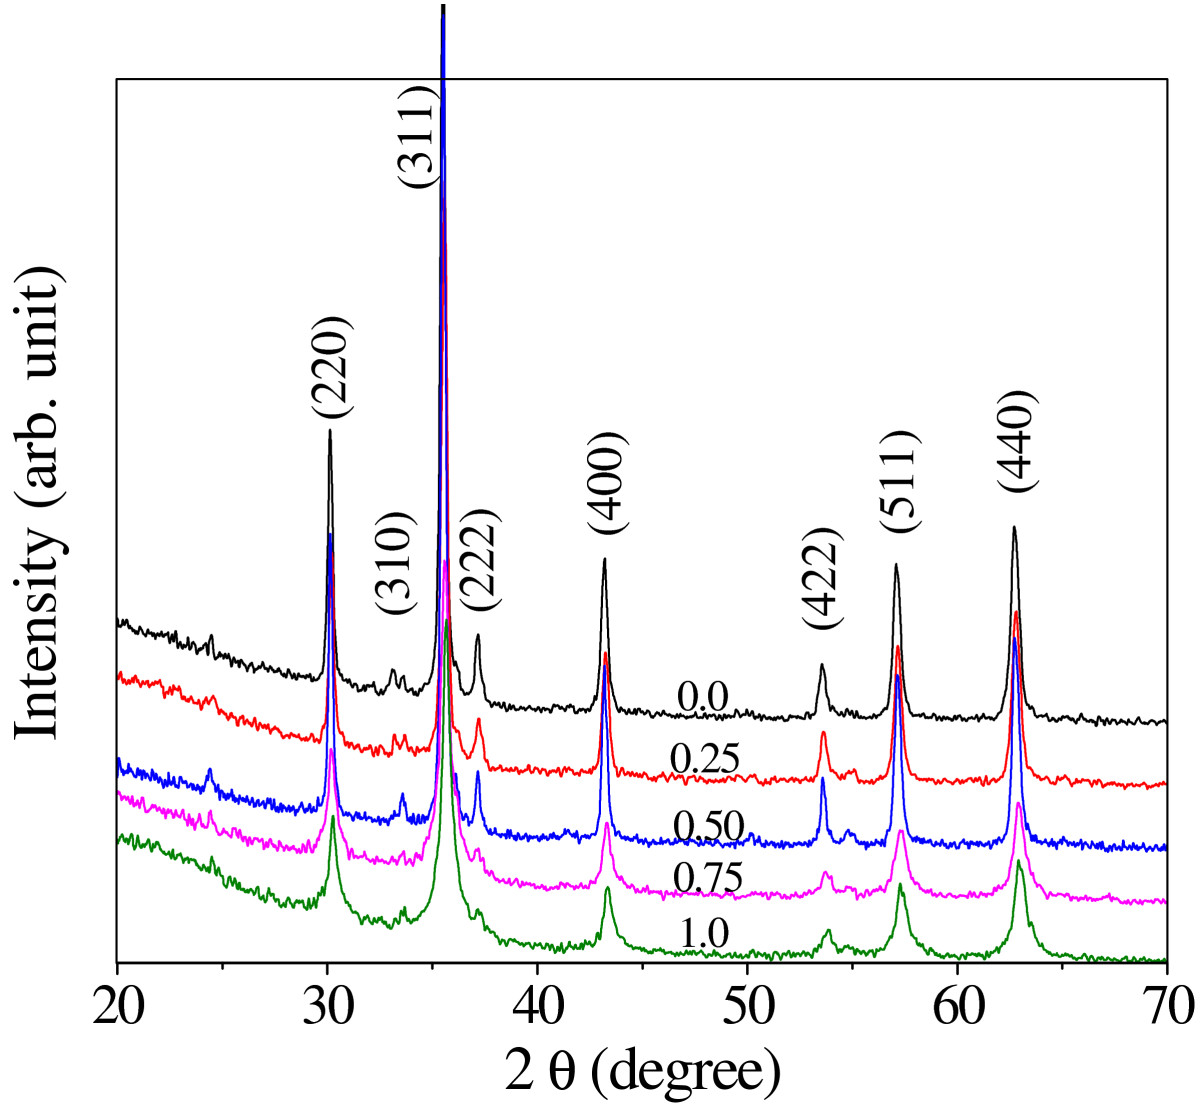
The X-ray diffraction (XRD) patterns of the Ni
0.4
Cu
0.4
Zn
0.2
Cr
x
Fe
2−
x
O
4
spinel ferrite system with
x
= 0.0 to 1.0 in steps of 0.2 are shown in Figure
1
. All of the Bragg peaks of the XRD patterns are broad and do not contain any extra peaks other than the cubic spinel phase. The X-ray diffraction analysis of these samples reveals the formation of a single-phase cubic spinel structure.
X-ray diffraction patterns of Ni
0.4
Cu
0.4
Zn
0.2
Cr
x
Fe
2−
x
O
4
.Figure 1
The lattice constant values were obtained for every sample using XRD data with an accuracy of ±0.002 Å and are listed in Table
1
. The decrease in the lattice constant is related to the difference in the ionic radii of Fe
3+
and Cr
3+
. In the present ferrite system, Fe
3+
ions (0.67 Å) are replaced by the relatively small Cr
3+
ions (0.64 Å). It can be seen from Table
1
that the X-ray density increases with increasing Cr content. The variation of the X-ray density with
x
is opposite to that of the lattice constant with
x
because the X-ray density is inversely proportional to the lattice constant. Further, the molecular weight of Cr
3+
ions is 51.94, whereas the molecular weight of Fe
3+
ions is 55.93. Therefore, as the Cr
3+
ions in the present case replace Fe
3+
ions, the molecular weight of the system continues to decrease with every substitution of Cr
3+
ions. This results in the decrease of the X-ray density of the sample. The bulk density (
d
B
) of the specimens was determined using Archimedes' method. The variation of the bulk density with Cr content
x
is shown in Figure
2
. The bulk density was found to decrease with increasing Cr
3+
content. In the present series, both the molecular weight of the Ni
0.4
Cu
0.4
Zn
0.2
Fe
2
O
4
spinel ferrite and the volume of the unit cell decrease with increasing Cr
3+
substitution, but the rate of the decrease of the molecular weight is more than that of the volume. Therefore, the bulk density decreases with Cr
3+
substitution in the present case, which leads to an increase in porosity (
P
) (Figure
2
). It is clear from Figure
2
that the sample density decreases and the porosity increases with increasing Cr
3+
content. The increase in porosity may be due to the decrease in crystallite size, which increases the grain boundaries of the crystallite and, accordingly, the porosity. TEM was adopted to determine the particle size. Figure
3
shows the typical TEM pattern for
x
= 0.5. Particle size decreases from 19 to 13 nm with the addition of Cr
3+
ions (Figure
4
). The specific surface area (
S
) was calculated from the diameter of the particle in nanometers and the measured density. The variation of surface area with Cr content
x
is shown in Figure
4
.
S
increases with increasing Cr
3+
content. The increase in
S
is due to the decrease in crystallite size.
Lattice constant (
a
), X-ray density (
d
x
), calculated magnetic moment (
n
B
) and resistivity (
ρ
) of Ni
0.4
Cu
0.4
Zn
0.2
Cr
x
Fe
2−
x
O
4 Composition ( 0.0 8.331 5.460 2.64 3.62 0.25 8.312 5.475 2.50 3.72 0.50 8.293 5.491 2.36 3.95 0.75 8.272 5.510 2.19 4.07 1.0 8.253 5.525 2.01 4.21 Variation of
d
B
and
P
with Cr
3+
content
x
. Typical TEM image of the sample
x
= 0.5. Variation of particle size (
t
) and
S
with Cr
3+
content
x
.Table 1
Figure 2

Figure 3

Figure 4

The introduction of Cr
3+
ions into the Ni-Cu-Zn ferrite greatly affects its magnetic properties. Figure
5
shows the plots of the hysteresis loops for Ni
0.4
Cu
0.4
Zn
0.2
Cr
x
Fe
2−
x
O
4
specimens. It is observed from Figures
5
and
6
that the saturation magnetization decreases with an increase in Cr
3+
substitution. The decrease in magnetization is explained by the A-B interaction. In the present case, Cr
3+
ions of low magnetic moment values (3μ
B
) replace Fe
3+
ions of high magnetic moment (5μ
B
). The magnetic moment in ferrite is mainly due to the uncompensated electron spin of the individual ions and the spin alignments in the two sublattices, which are arranged in an antiparallel fashion. In a spinel ferrite, each ion at the A site has 12 B-site ions as nearest neighbors. According to Neel's molecular field model [
5
], the A-B super-exchange interaction predominates the intrasublattice A-A and B-B interactions. Therefore, the net magnetic moment is given by the sum of the magnetic moments of the A and B sublattices. The magneton number (
n
B
) was calculated using the formula:
where
M
W
is the molecular weight of the composition and
M
S
is the saturation magnetization. It is observed from Table
1
that the magneton number decreases with an increase in Cr
3+
substitution. It is clearly observed from Figure
6
that the coercivity (
H
C
) increases as the Cr
3+
content increases, similar to porosity. Porosity affects the magnetization process because the pores work as a generator of a demagnetizing field. As the porosity increases, a higher field is needed to push the domain wall, increasing
H
C
. Also, the saturation magnetization
M
S
is related to
H
C
through Brown's relation [
6
]:
Magnetization curve for (a) 0.0, (b) 0.25, (c) 0.50, (d) 0.75, and (e) 1.0 of Ni
0.4
Cu
0.4
Zn
0.2
Cr
x
Fe
2−
x
O
4
. Variation of saturation magnetization and coercivity with Cr
3+
content
x
.Figure 5

Figure 6

According to this relation, H C is inversely proportional to M S , which is consistent with our experimental results.
Figure
7
shows the variation of
ε
′
with frequency at room temperature. It can be seen from Figure
7
that as the frequency increases, the dielectric constant decreases exponentially. The decrease in dielectric constant is rather sharp at a low-frequency region; as frequency increases, it remains almost constant for all the compositions under investigation. The variation of the dielectric constant with frequency reveals dispersion due to the Maxwell-Wagner-type interfacial polarization and is in agreement with Koop's phenomenological theory [
7
–
9
]. The polarization decreases with an increase in frequency and attains a constant value beyond a certain frequency limit. The decrease in dielectric constant with frequency indicates that the mechanism of polarization process in ferrite is similar to that of the conducting process. By electronic exchange, Fe
2 +
↔ Fe
3 +
+
e
−
, one obtains the local displacement of electron in the direction of the applied electric field. This displacement determines the polarization of the ferrite. The n-type charge transfer in the presently investigated ferrites is due to the hopping of electrons from Fe
2+
to Fe
3+
ions according to Fe
2 +
↔ Fe
3 +
+
e
−
, while the p-type charge transfer exists in Ni ions according to Ni
2 +
+ h ↔ Ni
3 +
.
Variation of dielectric constant with logarithm of frequency.Figure 7

DC resistivity of all samples was measured using a two-probe method. It is observed that DC resistivity shows a linear decrease with temperature (figure not shown here). This variation is explained by the location of the cations in the spinel ferrite. An increase in resistivity is observed with an increase in Cr 3+ concentration (Table 1 ). The observed increase in resistivity can be understood by considering the hopping mechanism, Fe 2 + ↔ Fe 3 + . The increase in Cr 3+ ions at the B site leads to replacement of Fe 3+ ions at B site, leading to a decrease of ferrous ions formed. Though the Cr 3+ ions do not participate in the conduction mechanism, they limit the degree of Fe 2 + ↔ Fe 3 + transfer, thereby obstructing electron hopping and resulting in an increase in resistivity.