Faculty of Chemistry, Government Arts College, Udumalpet, Tamilnadu, 642 126, IN
Research Scholar, Research and Development Centre, Bharathiar University, Coimbatore, Tamilnadu, 641 046, IN
Department of Science and Humanities, Rathinavel Subramaniam College of Engineering and Technology, Coimbatore, Tamilnadu, 641 402, IN
Department of Biotechnology, Karpagam University, Coimbatore, Tamilnadu, 641 021, IN
Abstract
A novel, simple, less time consuming and cost-effective sol–gel method has been developed to synthesize nano titania-silica with polyvinyl alcohol (PVA) composite relatively at low temperature in acidic pH. Titania sol is prepared by hydrolysis of titanium tetrachloride and was mixed with silicic acid and tetrahydrofuran mixture. The reaction was carried out under vigorous stirring for 6 h and dried at room temperature with the addition of PVA solution. The resulting powders were characterized by X-ray diffraction, scanning electron microscopy, transmission electron microscopy, Fourier transform infrared (FT-IR), UV-visible spectroscopy and thermal techniques. The grain size of the particles was calculated by X-ray diffraction; surface morphology and chemical composition were determined from scanning electron microscopy-energy dispersive spectroscopy; metal oxide stretching was confirmed from FT-IR spectroscopy; bandgap was calculated using UV-visible spectroscopy, and thermal stability of the prepared composite was determined by thermogravimetric/differential thermal analysis. Since TiO
2
got agglomerated on the surface of SiO
2
, effective absorptive sites increase which in turn increase the photocatalytic efficiency of the resulting composite.
Background
Polymers are of profound interest to society and are replacing metals in diverse fields of life, which can be further modified according to modern applications. Organic–inorganic hybrid materials are hi-tech because they can simultaneously present both the properties of an inorganic molecule and the usual properties of a polymer (an organic molecule). These hybrid materials sometimes lead to unexpected new properties, which are often not exhibited by individual compounds and thus open a new avenue for chemists, physicists and materials scientists. These hybrid materials are new, versatile class of materials, exhibiting a vast application potential due to their tailorable mechanical, optical and electrical properties [
1
].
Nanoparticles have been prepared by many methods such as Langmuir-Blodgett films [
2
], vesicles [
3
] and reverse microemulsions [
4
]. The chemical and physical properties exhibited by these materials depend, among others, on both the composition and the degree of homogeneity. Therefore, different synthesis strategies have been developed [
5
], such as co-precipitation, flame hydrolysis, impregnation and chemical vapour deposition. The sol–gel route has demonstrated a high potential for controlling the bulk and surface properties of the oxides [
6
–
10
]. Depending on the conditions, the binary oxides could be obtained as aerogels, either by supercritical drying or by silanization of the material by conventional drying [
11
]. Additionally, non-hydrolytic sol–gel routes have been also reported [
12
].
The physical and chemical properties of titania (TiO
2
) in the nanometer size range depend on phase composition, grain size and dispersity [
13
]. In many aspects, nanosized TiO
2
crystals of less than 10 nm show significant differences with bulk TiO
2
due to the quantum size effect [
14
]. TiO
2
hydrosols consisting of highly crystallized nanoparticles have been widely studied in the fields of photocatalytic degradation of pollutants [
15
], self-cleaning windows [
16
], sensors [
17
], solar cells [
18
] and electron chromic devices [
19
].
In this work, we report a novel sol–gel method to synthesize TiO
2
-SiO
2
:polyvinyl alcohol (TSP) nanocomposites at room temperature.
Methods
All reagents used were of analytical grade purity and were procured from Merck Chemical Reagent Co. Ltd. India.
The prepared nanoparticles were characterized for the crystalline structure using D8 Advance X-ray diffraction (Bruker AXS, Ettlingen, Germany) at room temperature operating at 30 kV and 30 mA, using CuKα radiation (
λ
= 0
.
15406 nm). The particle size was calculated by Scherrer’s formula. Surface morphology and their composition were studied using scanning electron microscopy-energy dispersive spectroscopy (SEM-EDS) (Model JSM 6390LV, JOEL, Peabody, MA, USA). UV–vis diffuse reflectance spectra were recorded with a Carry 5000 UV–vis-NIR spectrophotometer (Varian, Palo Alto, USA), and FT-IR spectra were measured on an AVATAR 370-IR spectrometer (Thermo Nicolet, Waltham, MA, USA) with a wave number range of 4,000 to 400 cm
−1
. Thermogravimetric analysis (TGA) was performed using a Perkin-Elmer, Diamond TG/DTA (Perkin Elmer, Waltham, MA, USA) at a heating rate of 10 °C/min under a nitrogen atmosphere.
The TSP composite was prepared by the following method. In the synthesis of Sol A, titanium tetrachloride (TiCl
4
) was used as a precursor and was mixed with ethanol, hydrochloric acid (0.1 M) solution and deionised water in the ratio 1:2:2:2, respectively. The mixture was stirred for an hour and maintained in the pH range from 1 to 2. In Sol B, silicic acid (6 g) was mixed with tetrahydrofuran (40 ml) solvent under a nitrogen atmosphere and stirred for an hour. Sol A was added to Sol B; the colourless solution turned reddish brown, and the mixture was stirred for 3 h at 60 °C. The polyvinyl alcohol (PVA) solution (1 %) was added to the above mixture at the rate of 20 ml/h and was stirred for 2 h. The gel turns from brownish to yellow colour. The gel was dried at room temperature. Finally, the mixture was heated at 120 °C for an hour.
Results and discussion
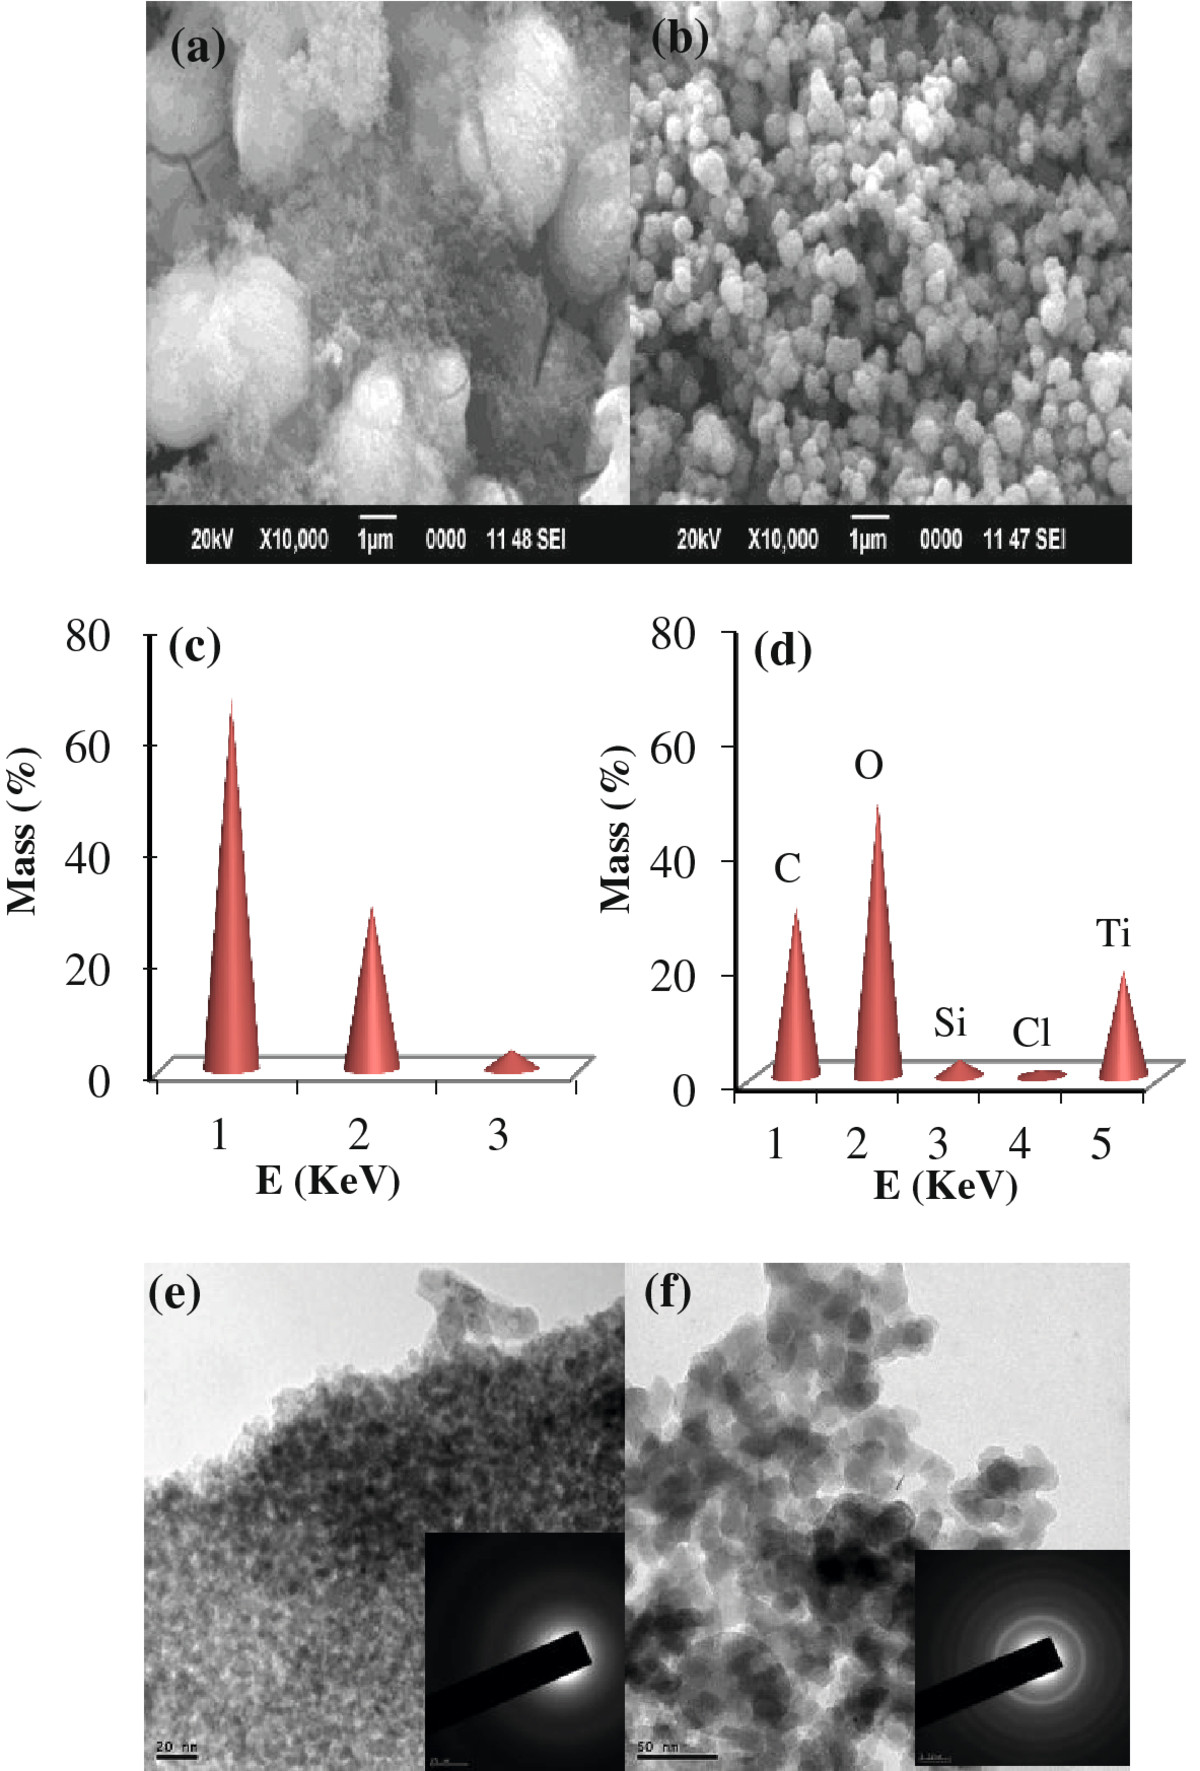
Figure
1
shows the SEM-EDS images along with particle size distribution of the pure TiO
2
sols and of the colloidal TS nanocomposites. The TS particles exhibited irregular morphology due to the agglomeration of primary particles and with an average diameter of 10 to 15 nm. On the other hand, the colloidal TS nanocomposites exhibited regular morphology (Figure
1
) since the TS cores were coated by PVA, which was confirmed by transmission electron microscopy (TEM) image (Figure
1
). The average particle size of the colloidal TSP nanocomposites was measured to be 20 to 25 nm.
Figure 1
SEM images, EDAX spectra and TEM images of TS and TSP composites.
(
a
,
b
) SEM image of nano TS and TSP composites, respectively; (
c
,
d
) Energy-dispersive X-ray (EDAX) spectra of nano TS and TSP composites, respectively; (
e
,
f
) TEM images of TS and TSP composites, respectively.
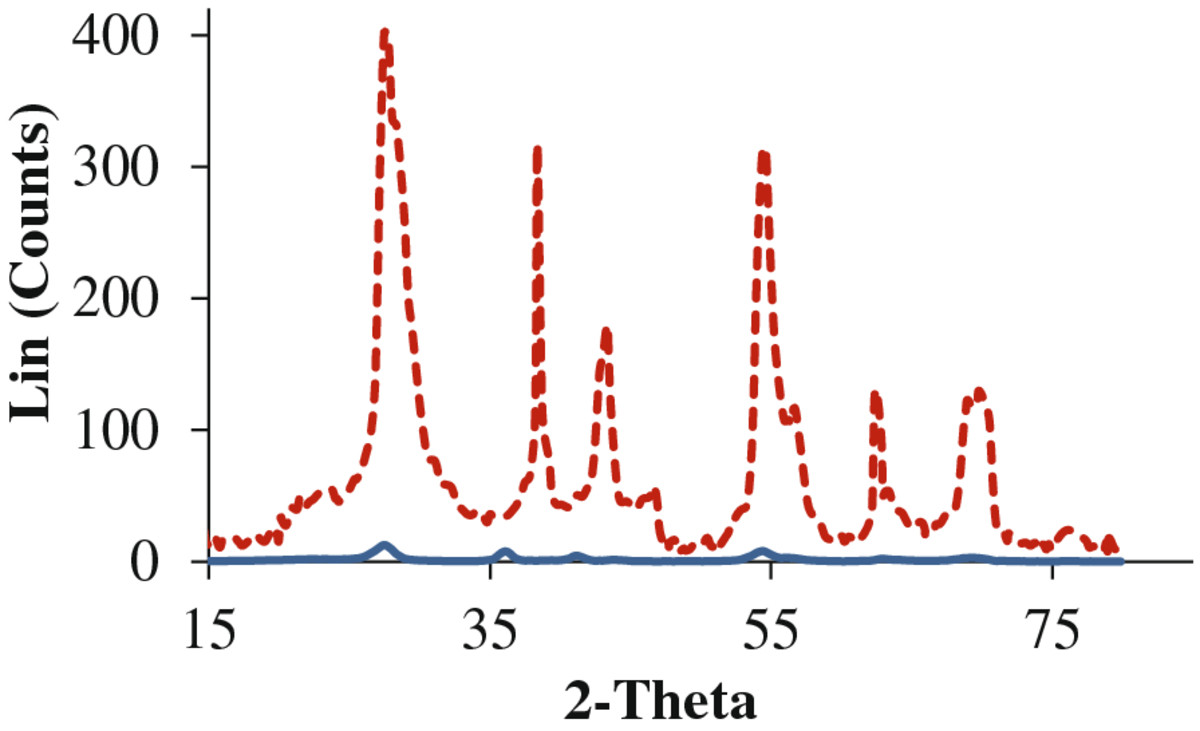
Figure
2
shows the XRD pattern of sol–gel-derived nano TS and TSP composites. The crystallite type of the TS nanocomposite particles was the pure anatase. The most intense reflection at 2
θ
= 27.5° is assigned to anatase (d
101
). Not much difference has been detected between patterns of TS and TSP composites. The powders showed the crystalline pattern, and the observed d-lines match the reported values for the anatase phase. The intensity of reflections appeared to be decreased for TSP as compared to TS due to inclusion of amorphous SiO
2
. The average crystallite size was determined by carrying a slow scan of the powders in the range of 24° to 27° with the step of 0.01° min
–1
from Scherrer’s equation using the (101) reflections of the anatase phase assuming spherical particles. Using the Scherrer formula,
G
= 0.9
λ
/ Δ(2
θ
) cos
θ
, an estimate of the grain size (
G
) from the broadening of the main (101) anatase peak can be done, where
λ
is the CuK
α
radiation wavelength and Δ(2
θ
) is the peak width at half-height. The nanocrystallite sizes were found to be 10 to 15 nm for TS while 20 to 25 nm for the TS-coated polymer (PVA). The weakening and broadening of the XRD peaks may be attributed to the decrease of the sample grain size and the increase of the SiO
2
content. The introduction of SiO
2
can effectively suppress the grain growth of anatase compared with pure TiO
2
. Moreover, the suppression is more remarkable with the introduction of higher silica content, which is consistent with the literature [
20
,
21
]. The major differences were the narrower first maximum and the broader second maximum.
Figure 2
XRD pattern for TS and TSP nanocomposites.
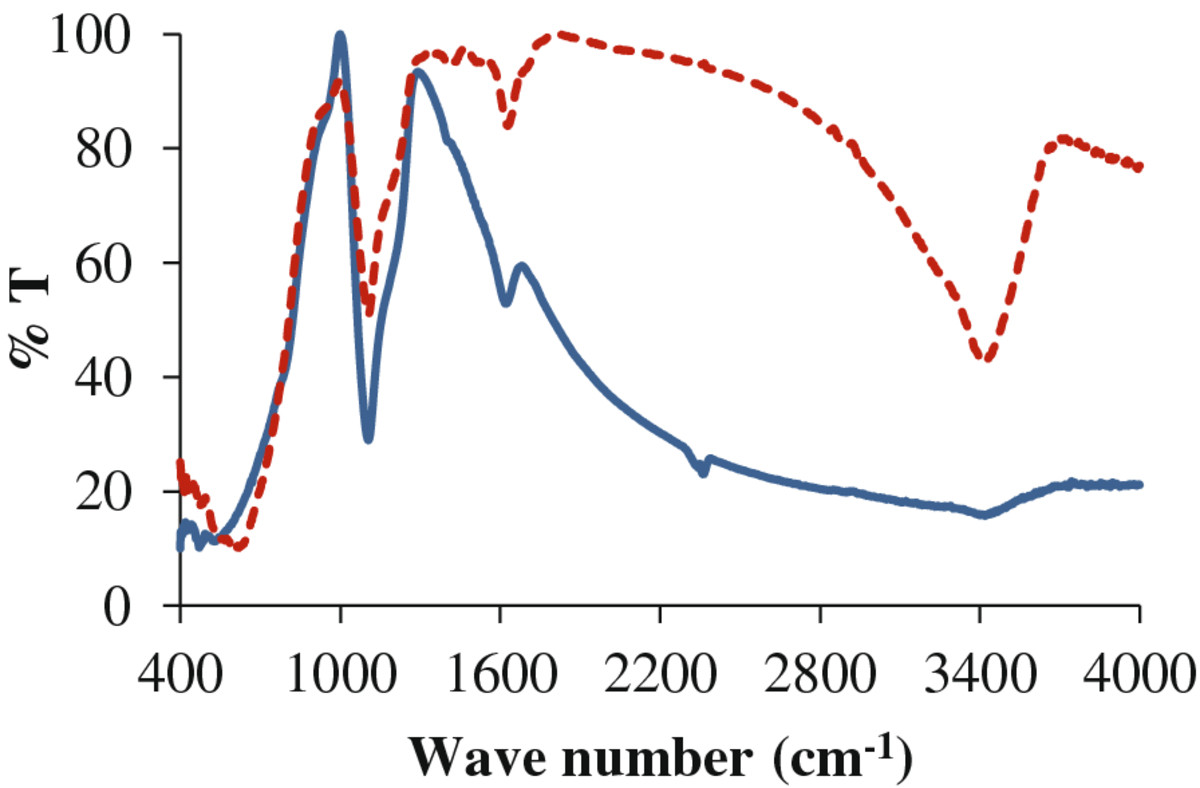
Figure
3
represents the FT-IR spectra of the sol–gel-derived nano TS and TSP composites. The peaks at 3,400 and 1,650 cm
−1
in the spectra are due to the stretching and bending vibration of the -OH group. In the spectrum of pure TiO
2
, the peaks at 550 and 1,479 cm
−1
show stretching vibration of Ti-O and Ti-O-Ti, respectively. The spectrum of TS shows the peaks at 1,400 cm
−1
and450 to 550 cm
−1
exhibiting stretching modes of Ti-O-Ti. The peak at 1,100 cm
−1
shows Si-O-Si bending vibrations, and the peak at 1,005 cm
−1
shows Si-O-Ti vibration modes which are due to the overlapping from vibrations of Si-OH and Si-O-Ti bonds. Several peaks appear at 1,284, 1,361 and 1,766 cm
−1
, which may be attributed to organic solvents, and as the treatment temperature increases, these peaks become quite weak and even vanish. These results indicate that TS nanoparticles were prepared by a combination of TiO
2
with SiO
2
nanoparticles [
21
,
22
]. SEM-EDS results show the presence of metal oxide bonds in both samples.
Figure 3
FT-IR spectra for TS and TSP nanocomposites.
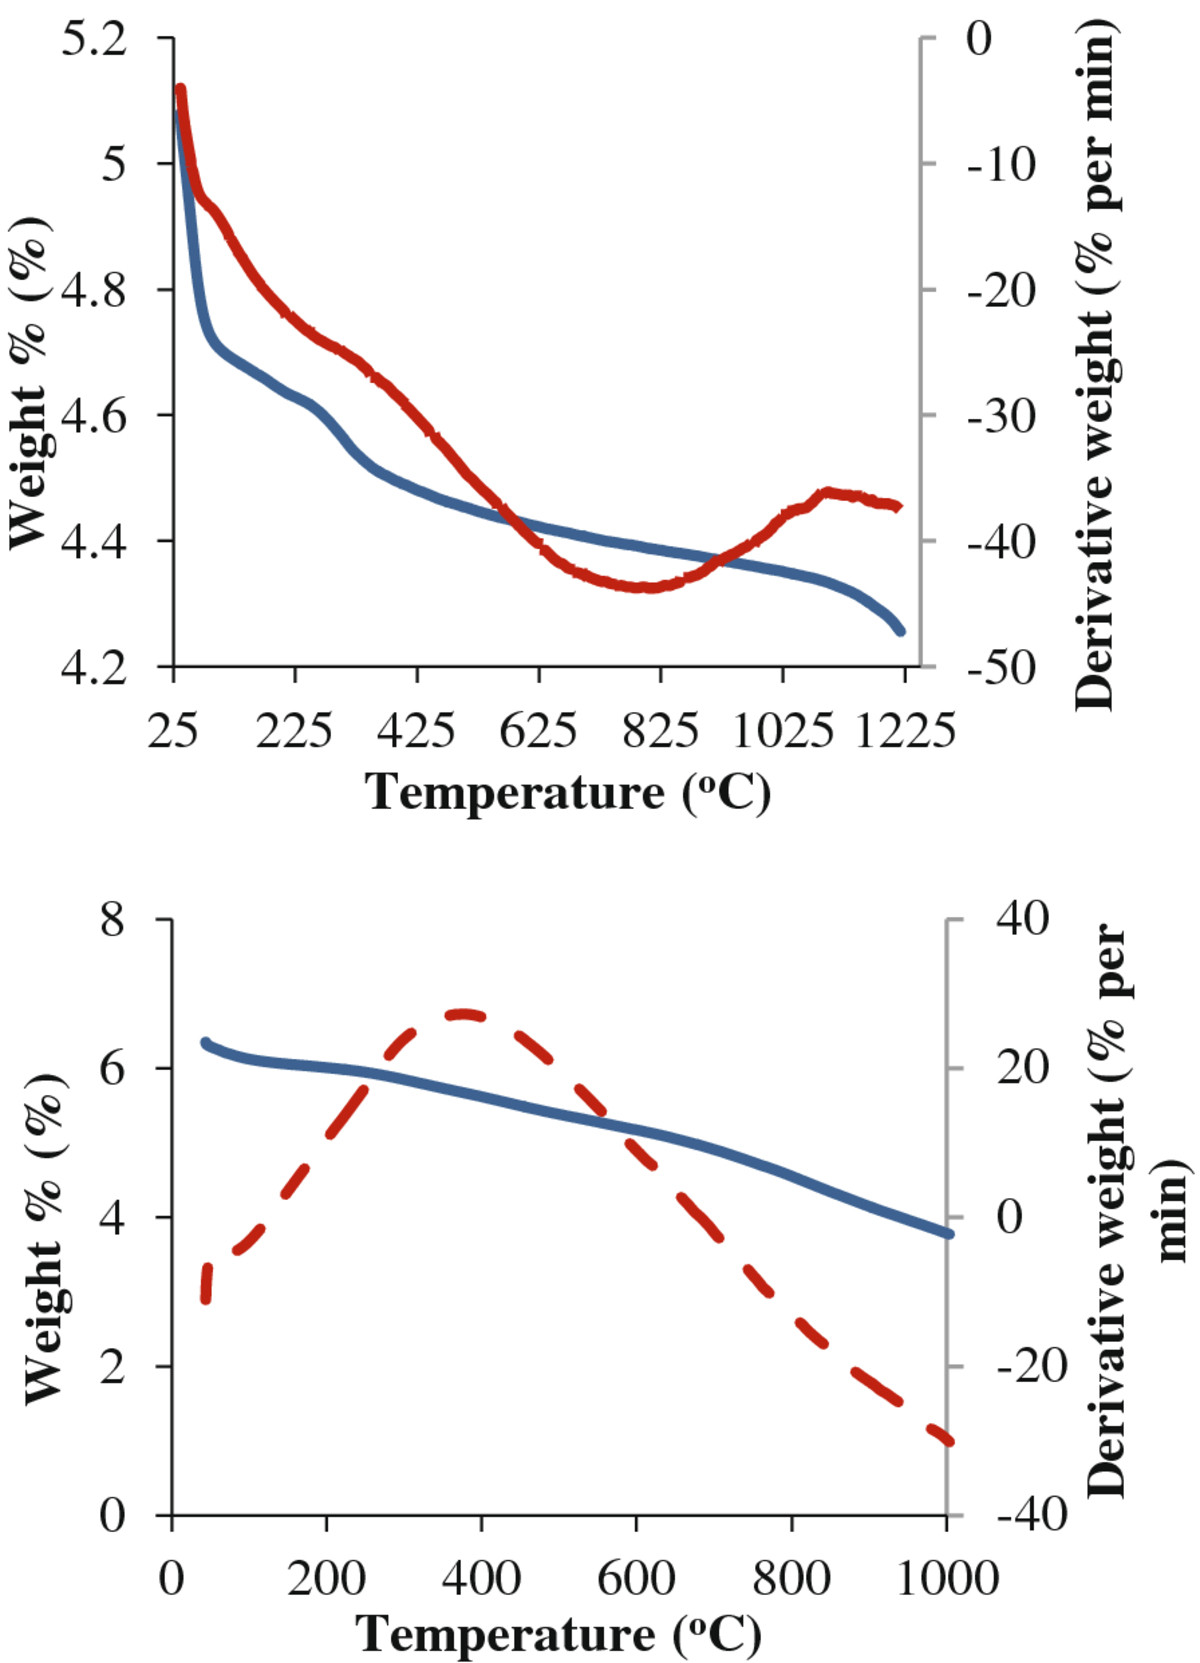
Figure
4
represents TG-differential thermal analysis (DTA) curves of TS and TSP composites. The major weight loss was in the range of 80 °C to 100 °C. The thermal stability of the hybrids was investigated by measuring the major decomposition temperature, which was determined from the first derivative of the TG-DTA curves. In TS
,
the second and third weight loss occurred at 210 °C and 410 °C, respectively, which indicates decomposition of organic molecules and shrinkage of the bonds of Ti-O-Si; For the TSP samples II, III and IV, weight loss occurred at 190 °C, 309 °C and 815 °C, respectively, which indicates the decomposition of hydroxyl groups and organic molecules; beyond which, there is no weight loss for both samples, and it may be assumed that the amorphous phase has changed to crystalline phase. TS and TSP composites were stable up to 1,000 °C, which indicates that the TS-doped sample is more stable than TSP. The result reports that the thermal stability of the hybrid materials was significantly improved compared with that of the bulk compound.
Figure 4
TG-DTA curve for TS and TSP nanocomposites.
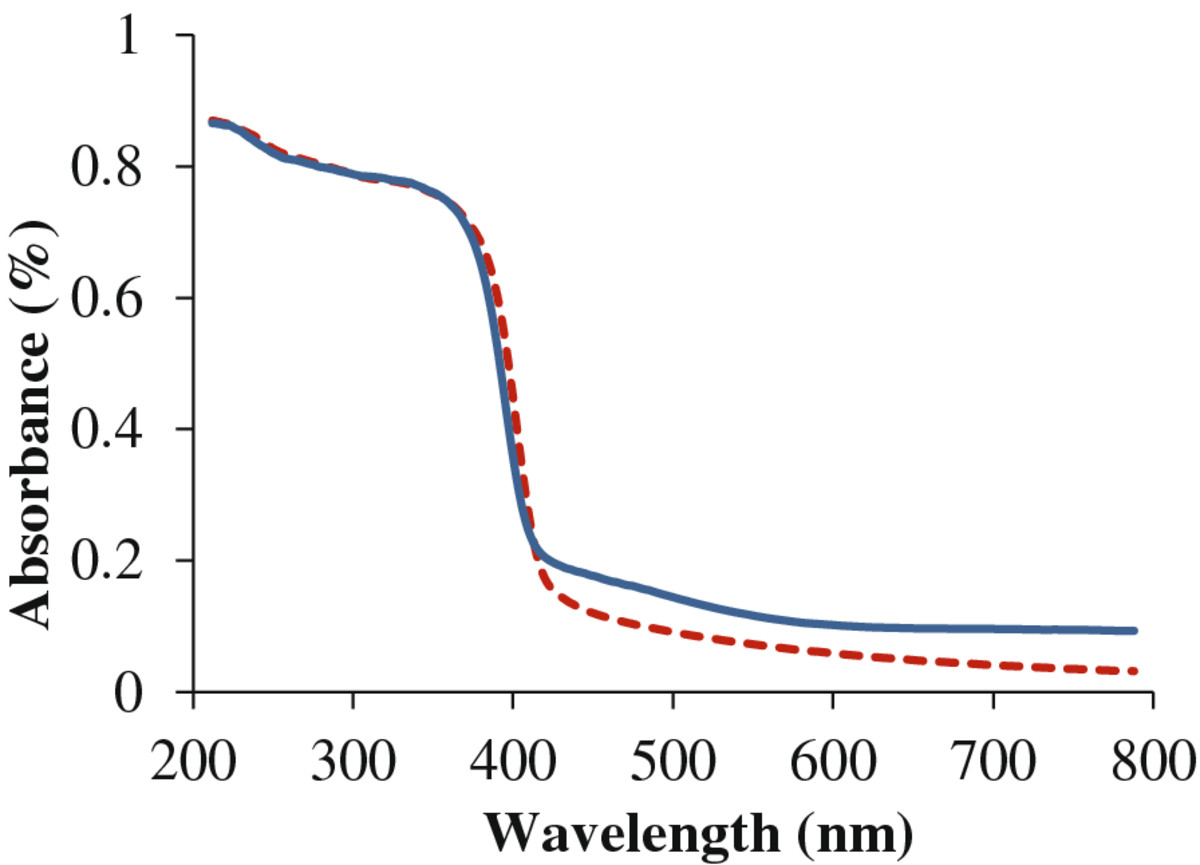
In Figure
5
, the UV-visible absorption spectra for both composites were observed at 340 nm. Actually, the band edge of bulk anatase is ≈ 3.2 eV and is also shown on the same graph. After heat treatment, a small modification was observed due to the presence of anatase nanocrystallites. Indeed, the gel was highly transparent, and any absorbance which appeared at energies below the bandgap energy was a result of interference fringes and of the high refraction index of titania. When Si was present, additional small peaks were observed in the absorption manifolds as seen in Figure
5
. Furthermore, due to the smaller particle size and higher dispersity, presence of SiO
2
content results in higher transparency in the visible region [
9
,
21
,
22
].
Figure 5
UV–vis spectra for TS and TSP nanocomposites.
Conclusions
The water-based colloidal TSP nanocomposite was successfully synthesized as anatase TiO
2
, TS particles and PVA by sol–gel method. FT-IR spectroscopy showed that the Ti-O and Ti-O-Si bonds were formed and that addition of SiO
2
particles alters the size and shape of the TS particles and also increases the thermal stability of TS particles. The addition of polymer (PVA) could effectively suppress the particle growth and improve the stability of TS hydrosols. It was also confirmed that the TSP mixture has high thermal stability, which results in the suppression of phase transformation of titania from anatase to rutile. The crystallite size of prepared particles decreased, and the surface area monotonically increased with an increase of the silica content with polymer.
Acknowledgement
The authors acknowledge Cochin University of Science and Technology for the support in characterization of nanocomposites.
Competing interests
The authors declare that they have no competing interests.
Authors’ contributions
VR and KB conceived the study, participated in its design and coordination and carried out the synthesis of nanocomposites. RS carried out the characterization studies. All the authors participated and drafted the manuscript. All authors read and approved the final manuscript.
Yi and Fendler (1990) Template-directed semiconductor size quantitation at monolayer-water interfaces and between the head groups of Langmuir–Blodgett films10.1021/la00099a015
Youn et al. (1998) Dihexadecyl phosphate, vesicle-stabilised and in situ generated mixed cadmium sulphide and zinc sulphide semiconductor particles: and utilization for photosensitized charge and hydrogen generation10.1021/j100333a029
Fendler (1987) Atomic and molecular clusters in membrane mimetic chemistry10.1021/cr00081a002
Gao and Wachs (1999) Titania–silica as catalysts: molecular structural characteristics and physico-chemical properties10.1016/S0920-5861(99)00048-6
Schraml-Marth et al. (1992) Porous silica gels and TiO2-SiO2 mixed oxides prepared via the sol–gel process: characterization by spectroscopic techniques10.1016/S0022-3093(05)80557-5
Matsuda et al. (2003) Evaluation of photo-catalytic activity of transparent anatase nanocrystals-dispersed silica films prepared by the sol–gel process with hot water treatment10.1023/A:1020751416445
Jiwei et al. (2001) Characteristics of laser-densified and conventionally heat treated sol–gel derived silica-titania films10.1016/S0257-8972(00)01158-0
Que et al. (2000) Optical and mechanical properties of TiO2/SiO2/organically modified silane composite films prepared by sol–gel processing10.1016/S0040-6090(99)00746-4
Liu and Davis (1994) Investigation of the structure of microporous Ti-Si mixed oxides by X-ray, UV reflectance, FT Raman, and FT-IR spectroscopies10.1021/j100055a035
Hay and Raval (1998) Solvent-free synthesis of binary inorganic oxides10.1039/a707549i
Wang et al. (2008) Comparison study on the size and phase control of nanocrystalline TiO2 in three Ti–Si oxide structures10.1007/s10853-007-2431-y
Zhao et al. (2008) Zn-doped TiO2 nanoparticles with high photocatalytic activity synthesized by hydrogen-oxygen diffusion flame10.1016/j.apcatb.2007.09.044
Liu et al. (2008) TiO2 hydrosols with high activity for photocatalytic degradation of formaldehyde in a gaseous phase10.1016/j.jhazmat.2007.07.003
Paz et al. (1995) Photooxidative self-cleaning transparent titanium dioxide films on glass10.1557/JMR.1995.2842
Carotta et al. (1999) Nanostructured pure and Nb-doped TiO2 as thick film gas sensors for environmental monitoring10.1016/S0925-4005(99)00148-3
O’Regan and Gräzel (1991) A low-cost, high-efficiency solar cell based on dye-sensitised colloidal TiO2 films10.1038/353737a0
Cinnsealach et al. (1999) Coloured electrochromic windows based on nanostructured TIO2 films modified by adsorbed redox chromophores10.1016/S0927-0248(98)00156-1
Ennaoui et al. (2006) Ch.: TiO2 and TiO2–SiO2 thin films and powders by one-step soft-solution method: synthesis and characterizations10.1016/j.solmat.2005.10.019
Balachandran et al. (2010) Synthesis of nano TiO2-SiO2 composite using sol–gel method: effect on size, surface morphology and thermal stability
Zhang et al. (2009) Synthesis and photocatalytic properties of highly stable and neutral TiO2-SiO2 hydrogel10.1016/j.jcis.2008.10.038