Results and discussion
Powder X-ray diffraction analysis
Phase identifications were performed on a powder X-Ray diffractometer Siemens D5000 using Cu-K α radiation. The morphology of the obtained materials was examined with a Philips XL30 Scanning Electron Microscope equipped with energy-dispersive X-ray (EDX) spectrometer. Absorption and photoluminescence spectra were recorded on a Jena Analytik Specord 40 and a Perkin Elmer LF-5 spectrometer, respectively.
Figure
1
a, b, respectively, shows the EDX spectra of the synthesized Nb
5+
-doped lithium metasilicate and lithium disilicate nanomaterials, which verify the doping and the compositional analysis of Nb
5+
in the nanoparticles of lithium silicates.
EDX spectra of the hydrothermally synthesized
a
Li
1.995
Nb
0.001
SiO
3+
δ
and
b
Li
1.985
Nb
0.003
Si
2
O
5+
δ
nanoparticlesFig. 1
The crystal phases of the synthesized materials were examined by powder X-ray diffraction technique. Figures
2
and
3
show the powder XRD patterns of the Nb
5+
-doped lithium metasilicate and lithium disilicate, respectively. The measured powder XRD data are in good agreement with those of corresponding undoped lithium metasilicate or lithium disilicate nanomaterials [
31
] and the obtained stable phases are, respectively, isostructural with Li
2
SiO
3
(space group Cmc21) [
31
–
41
] and Li
2
Si
2
O
5
(space group Ccc2) [
31
,
42
–
44
]. The measured data are in agreement with the respective Joint Committee on Powder Diffraction Standards (JCPDS) card for Li
2
SiO
3
(JCPDS 29-0829) (
a
= 9.3808 Å,
b
= 5.3975 Å and
c
= 4.6615 Å) and for Li
2
Si
2
O
5
(JCPDS 15-0637) (
a
= 5.825 Å,
b
= 14.56 Å and
c
= 4.796 Å). The standard crystallographic data for lithium metasilicate (JCPDS 29-0829) and lithium disilicate (JCPDS 15-0637) and the powder XRD data for respective hydrothermally synthesized undoped nanomaterials [
31
] are summarized in Tables
1
and
2
, respectively. Also, the powder XRD data for respective hydrothermally synthesized Nb-doped lithium metasilicate and Nb-doped lithium disilicate are summarized in Tables
3
and
4
for comparisons. Moreover, the intense sharp diffraction patterns suggest that the as-synthesized products are well crystallized.
PXRD patterns of the hydrothermally synthesized Li
2−2
x
Nb
0.4
x
SiO
3+
δ
nanomaterials where
a
x
= 0.0025,
b
x
= 0.005 and
c
x
= 0.01 PXRD patterns of the hydrothermally synthesized Li
2−2
x
Nb
0.4
x
Si
2
O
5+
δ
nanomaterials where
a
x
= 0.005,
b
x
= 0.0075,
c
x
= 0.01 Crystallographic data of the hydrothermally synthesized Li
2
SiO
3
nanomaterials obtained after 96 h at 180 °C 2 Int 18.881 1,064 2 0 0 26.979 1,231 1 1 1 33.05 706 3 1 0 38.419 586 3 1 1 38.608 618 0 0 2 43.23 107 2 2 1 51.467 182 5 1 0 55.448 123 4 2 1 58.955 173 6 0 0 59.183 120 3 3 0 62.998 63 1 1 3 66.219 42 4 2 2 69.732 103 3 1 3 Crystallographic data of the hydrothermally synthesized Li
2
Si
2
O
5
nanomaterials obtained after 120 h at 180 °C 2 Int 12.097 24 0 2 0 16.371 131 1 1 0 23.706 174 1 3 0 24.78 1,106 1 1 1 30.697 98 0 4 1 37.602 273 0 0 2 38.266 78 2 2 1 39.221 24 1 5 1 44.049 34 2 4 1 45.018 26 0 4 2 46.131 47 1 7 0 49.294 39 2 0 2 49.696 28 0 8 0 50.492 31 3 3 0 60.324 39 1 1 3 68.08 28 2 2 3 Crystallographic data of the hydrothermally synthesized Nb
5+
-doped Li
2
SiO
3
nanomaterials obtained after 96 h at 180 °C 2 Int 18.80 1,183 2 0 0 26.9704 1,414 1 1 1 33.0387 903 3 1 0 38.4283 845 3 1 1 43.2158 140 2 2 1 51.7762 250 3 1 2 55.4943 173 4 2 1 59.1616 253 3 3 0 62.9741 89 1 1 3 66.1219 42 4 2 2 69.5964 94 3 1 3 Crystallographic data of the hydrothermally synthesized Nb
5+
-doped Li
2
Si
2
O
5
nanomaterials obtained after 96 h at 180 °C 2 Int 16.31 121 1 1 0 23.84 102 1 3 0 24.70 1,392 1 1 1 30.60 142 0 4 1 37.44 389 0 0 2 38.11 32 2 2 1 43.95 36 2 4 1 46.10 52 1 7 0 49.20 48 2 0 2 50.58 31 3 3 0 60.33 53 0 3 3 68.12 37 2 2 3Fig. 2
Fig. 3
Table 1
Table 2
Table 3
Table 4
The doping limitations are 0–0.25 and 0–0.75 mol% of Nb 5+ for lithium metasilicate and lithium disilicate, respectively. Excess mol% concentration of the dopant agent in the reaction mixture, as shown in Figs. 2 and 3 , results in impurity peaks in the XRD patterns. The diffraction line at 2 θ ≈ 49° is assigned by its peak position to the excess Nb 2 O 5 [ 43 ]. Moreover, the formation of other phases of lithium silicates and raw materials was already detected for higher mol% concentration of the dopant agent in the reaction mixture (Figs. 2 , 3 ) [ 31 , 41 , 42 , 48 ].
Compared to those of the nanomaterials of undoped lithium silicates, the diffraction lines in the powder XRD patterns of the Nb
5+
-doped lithium silicates nanomaterials shift to lower 2
θ
values and, therefore, to larger
d
values. For the most intensive diffraction line (200) a diffraction line shift of ∆2
θ
= 18.881° (pure)−18.80° (doped) = 0.081° (∆
d
= 4.7206 Å (doped)−4.7005 Å (pure) = 0.0201 Å) for Nb
5+
-doped lithium metasilicate and for the most intensive diffraction line (040) a diffraction line shift of ∆2
θ
= 24.78° (pure)−24.70° (doped) = 0.08° (∆
d
= 3.600Å (doped)−3.589 Å (pure) = 0.011 Å) for Nb
5+
-doped lithium disilicate are calculated via Bragg’s law. Tables
5
and
6
show the crystal sizes of the Nb-doped materials in different dopant amounts via Debye–Scherrer equation.
Debye–Scherrer data information for pure and Nb
5+
-doped Li
2
SiO
3
nanomaterials Data information 2 cos Crystal size (nm) Pure Li2SiO3 26.979 13.4895 0.313217 0.0054639 0.97241 26.12 Nb5+-doped Li2SiO3 ( 26.970 13.485 0.27320 0.0047658 0.97243 29.95 Nb5+-doped Li2SiO3 ( 26.900 13.45 0.27115 0.0047300 0.97257 30.12 Debye–Scherrer data information for pure and Nb
5+
-doped Li
2
Si
2
O
5
nanomaterials Data information 2 cos Crystal size (nm) Pure Li2Si2O5 24.298 12.149 0.361680 0.0063093 0.97760 22.50 Nb5+-doped Li2Si2O5 ( 24.290 12.145 0.3000 0.005233 0.97762 27.13 Nb5+-doped Li2Si2O5 ( 24.283 12.1415 0.2900 0.005059 0.97763 28.02Table 5
Table 6
Since the ionic radius of the Nb 5+ (0.64Å [ 46 ]) is closer to the ionic radius of Li + (0.59Å [ 46 ]) rather than the Si 4+ (0.26Å [ 46 ]), in the Nb 5+ -doped lithium metasilicate and lithium disilicate, it may be expected that the dopant ion will replace with Li + ions in the structure. The larger radius of the dopant ion, compared to the Li + , may cause an expansion of the lattice parameter in the Nb 5+ -doped lithium silicate nanomaterials. Since both ionic radii and charges are not the same for the dopant and Li + ions, it is also possible that the dopant ion takes an interstitial position in lattice rather than replacing any Li + ions, where additional patterns will be observed in XRD pattern [ 47 ]. However, here, the powder XRD data measured for the doped samples are in accordance with those of the undoped materials without any residual or impurity phase formation. The powder XRD patterns of the doped samples, therefore, suggest the fact that the dopant ions are indeed going to lattice positions rather than interstitial positions.
Moreover, on replacing Li + ions, the dopant ions are bound to create some oxygen-related defect centers or Li + vacancies for charge compensation. Therefore, it is believed that the dopant ions will be in a structurally disordered environment.
Cellref version 3 was used to refine the cell parameters from the measured powder XRD data of the synthesized doped nanomaterials. Compared to the standard crystallographic data for lithium metasilicate (JCPDS 29-0829) and lithium disilicate (JCPDS 15-0637), the refined unit cell parameters of the synthesized Nb-doped lithium metasilicate and lithium disilicate nanomaterials are a = 9.3702 Å, b = 5.3994 Å, c = 4.6643 Å and a = 5.826 Å, b = 14.6168 Å, c = 4.878 Å, respectively.
Microstructure analysis
SEM images of the pure lithium metasilicate and lithium disilicate are present in our previous work [
31
]. Figure
4
shows typical SEM images of the synthesized Li
1.995
Nb
0.001
SiO
3
+
δ
nanoparticles. The synthesized sample is composed of multi-ply sheets (thickness and length of about 100 nm and 5 μm, respectively) join together to form nano-flowers. Typical SEM images of the synthesized Li
1.99
Nb
0.002
Si
2
O
5
+
δ
and Li
1.985
Nb
0.003
Si
2
O
5
+
δ
are given in Figs.
5
and
6
, respectively. The synthesized Li
1.99
Nb
0.002
Si
2
O
5
nanomaterial is composed of plate-like nanoparticles with homogenous dispersion (Fig.
5
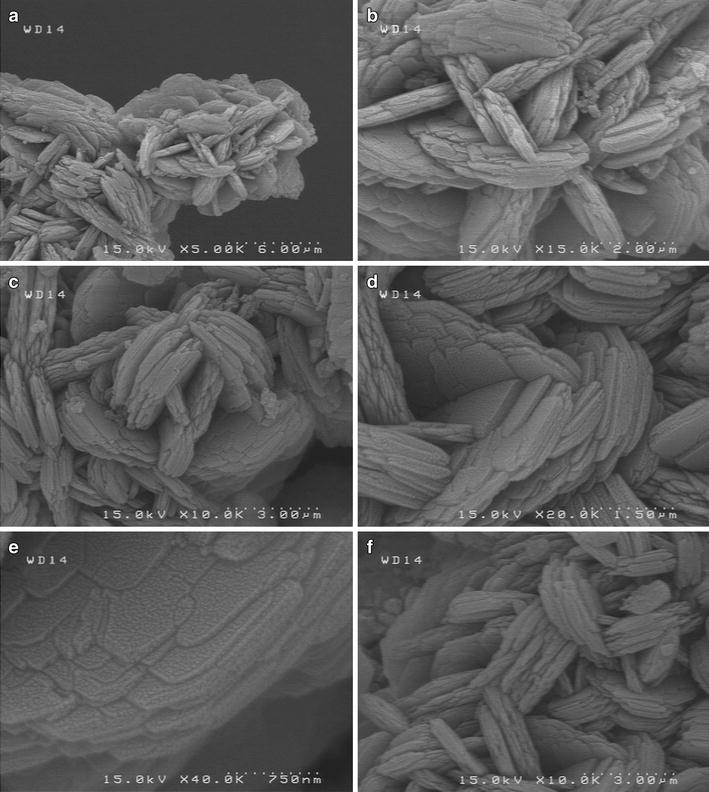
b, c). The length of the nano-plates is approximately 0.7–0.8 μm. As shown in Fig.
6
, with increasing the dopant concentration in the structure to
x
Nb
= 0.0075, the resultant nano-plates assemble to each other to form nano-flower-like structures. The length and thickness of the nano-plates are estimated to be 500 and 80–100 nm approximately.
SEM images of the hydrothermally synthesized Li
2−2
x
Nb
2x
SiO
3+
δ
(
x
= 0.0025) nano-flowers SEM images of the hydrothermally synthesized Li
2−2
x
Nb
2
x
Si
2
O
5+
δ
(
x
= 0.005) nanoparticles SEM images of the hydrothermally synthesized Li
2−2
x
Nb
2
x
Si
2
O
5+
δ
(
x
= 0.0075) nano-flowersFig. 4
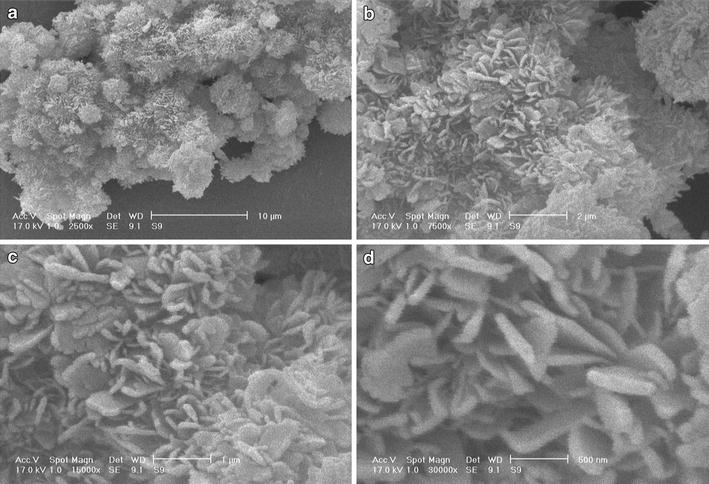
Fig. 5
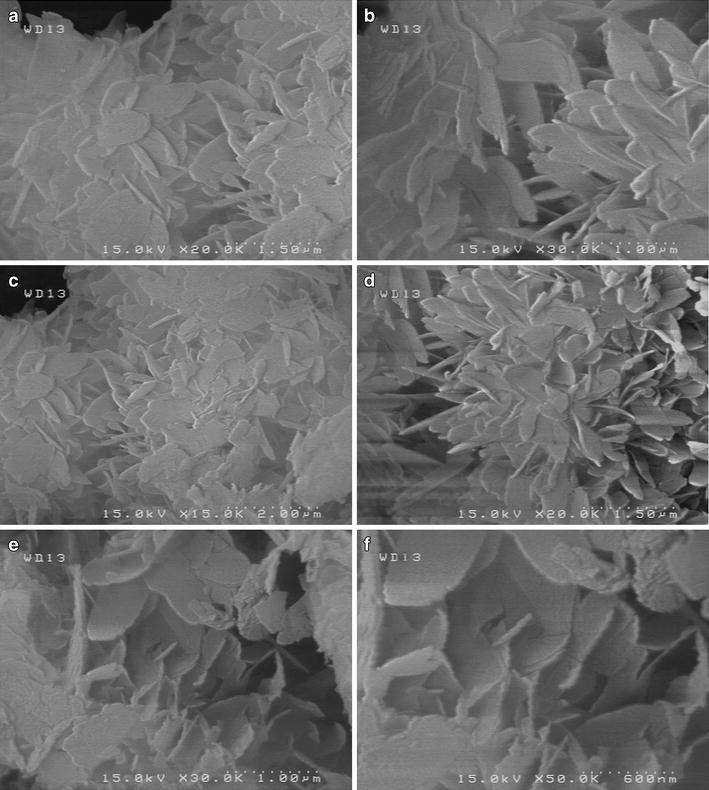
Fig. 6
Optical properties
The emission spectra of pure Li
2
SiO
3
and Li
2
Si
2
O
5
are shown in Figs.
7
and
8
. In the excitation spectrum of the synthesized Li
2
SiO
3
and Li
2
Si
2
O
5
nanomaterials, a band is observed with maxima at 360 and 250 nm, respectively. Accordingly, in the emission spectrum of the synthesized Li
2
SiO
3
nanomaterials, an intense peak appears at 410.03 nm. In comparison, an intense peak at 291.45 nm is observed in the emission spectrum of the synthesized Li
2
Si
2
O
5
nanomaterials. With increasing in the reaction time, no shift is observed in the emission spectrum of the obtained Li
2
SiO
3
and Li
2
Si
2
O
5
nanomaterials. However, increasing band intensities in the emission spectra of both compounds are observed with increasing reaction time. In the emission spectrum of Nb
5+
-doped lithium metasilicate nano-flowers (Fig.
9
), under excitation with light at 234 nm, the main emission band is located at 360 nm with shoulders at 310, 340 and 425 nm. The shoulder appeared at 310 nm is assigned to the band edge emission. Also, the broad band with maxima at 360 nm and the shoulder at 340 nm are assigned to the trap state emission of the nanoparticles. Considering that the energy gap of bulk lithium silicates is above 3.3 eV, the purple-blue photoluminescence appeared as a shoulder at 425 nm (approximately 2.92 eV) is probably due to a triplet to ground state transition of a neutral oxygen vacancy defect, as suggested by ab initio molecular orbital calculations for many other well-studied metal oxides. Also, the emission band related to the Nb(V) centers in the structure is expected to be superimposed on the shoulder at 425 nm [
44
]. In comparison, the synthesized Nb
5+
-doped lithium disilicate nanoparticles exhibit an intense broad emission band (
λ
ex
= 229 nm) at 420 nm (~2.95 eV) (Fig.
10
) assigned to the oxygen-related defects and Nb
5+
centers in the structure, which shows an increasing intensity with increasing the dopant concentration in the structure [
45
].
Emission spectrum of the hydrothermally synthesized Li
2
SiO
3
nanomaterial (
λ
ex
= 332 nm) Emission spectra of the hydrothermally synthesized Li
2
Si
2
O
5
nanomaterials (
λ
ex
= 231 nm) Emission spectrum of the hydrothermally synthesized Li
2−2
x
Nb
2
x
SiO
3+
δ
(
x
= 0.0025) nano-flowers (
λ
ex
= 234 nm) Emission spectra of the hydrothermally synthesized Li
2−2
x
Nb
0.4
x
Si
2
O
5
nanomaterials where
a
x
= 0.005 (
λ
ex
= 229 nm),
b
x
= 0.0075 (
λ
ex
= 229 nm)Fig. 7
Fig. 8
Fig. 9
Fig. 10