Unité de recherche matériaux et énergies renouvelables URMER, Université Abou bakrBelkaïd, Tlemcen, 13000, DZ
Unité de développement des équipements solaires, UDES, EPST/centre de recherche en énergies renouvelables, CDER, Tipaza, 42004, DZ
Abstract
The accuracy of a two-diode model for three different photovoltaic module technologies, namely monocrystalline, amorphous and micromorphous silicon, has been investigated in this paper. The I–V and the P–V characteristics for each type of module were simulated using the specifications given by the module’s manufacturer in their datasheet at standard tests conditions. An accurate technique was used for calculating the corresponding irradiation absorbed by each module type. To validate the model, a comparison between the simulation results and the experimental data obtained for each PV module type tested in outdoor conditions for a sunny and a cloudy day has been carried out. A good agreement was found between the calculated and measured data, both for the I–V and the P–V curves and the characteristic points (
Isc
,
Voc
,
Impp
,
Vmpp
) under simultaneous variation of temperature and irradiation.
Introduction
In order to reduce the global warming phenomenon, the world awareness has conducted most of the countries to use renewable energies such as solar, wind, geothermal, etc. Among the renewable energies, the photovoltaic (PV) energy, given its maturity and ability to be quickly deployed looked as the best choice for a fast contribution to the decrease of greenhouse gases emissions. PV holds good promise for universal electrical energy production [
1
]. Modeling is an important step before mounting PV systems on any location. As the module is considered as the main component of the PV system, several studies have been devoted to its modeling. For decades and nowadays silicon is still the most used photovoltaic conversion material even if relatively thin solar films have gained attention and appear to be a good substitute, but a lot of work has to be done to increase their efficiency. To assess the performance of a PV module of a specified technology depending on many factors as irradiation, temperature, and serial and shunt resistance, in indoor or outdoor conditions, it is useful to have a simulation tool [
2
]. This tool can be developed by using empirical models derived from the measured data, or based on established by the PV module performance models used to estimate a module’s I–V characteristic as a function of irradiance and module temperature. Many authors have experienced different methods for PV module modeling [
3
–
9
], which appeared are as not suitable according to the lot of information required and not delivered by the PV module’s producers. The one-diode and two-diode models seem as the most common models used for modeling solar module. The latter one appears the better choice because it is the most accurate even if it necessities more computational requirement [
10
–
13
]. The spectral effects can improve the accuracy of outdoor performance of a photovoltaic (PV) system; the effect of seasonal spectral variations on three different silicon PV technologies has been investigated by [
14
].
In this paper, we have developed our model presented in [
15
] using an improved modeling technique for the two-diode model suggested by Ishaque et al. [
16
] and by adding a new technique of calculating the real absorbed irradiation by three different photovoltaic module technologies: monocrystalline, amorphous and micromorphous silicon PV modules.
This work describes the first simulation results of improved two-diode model useful to evaluate the electrical performances of photovoltaic (PV) modules. This model is used in order to estimate the electrical parameters of a PV module and predict how the I–V characteristic varies with environmental parameters such as temperature and irradiance. This work is a part of a larger project whose final purpose is to have a tool, which allows the accurate modeling of the PV panels for different technologies available on the market, in order to predict their performances in different environmental conditions. The improved model has been validated using characterization data obtained in outdoor conditions tests of Solar Development Unit (UDES) site for three different PV module technologies: monocrystalline, amorphous and thin film silicon. The accuracy of the model has been shown by comparing the simulation results with the experimental measurements for a sunny and a cloudy day for each module type.
Experimental
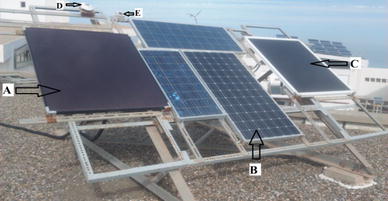
Our team at UDES is involved in the characterization of different type of PV modules. To this aim a PV characterization outdoor test bench, as shown in Fig.
1
, was set up at the UDES’s site which is located in Bou-Ismail region situated in the north west of Algeria at 36.64 North (latitude) and 2.69 East (longitude). This test bench is composed by a test platform on which are mounted the PV modules to be characterized in outdoor conditions. It includes a Kipp & Zonen standard pyranometers and a monocrystalline silicon reference solar cell for the irradiation measurement, a module temperature sensors, a PVPM electronic load which provides the I–V curve measurements of the PV modules, and a computer for the data acquisition where the measured parameters such as the current, the voltage, the temperature and the irradiance will be saved and then treated by a code locally developed by our team. The measurement uncertainty on the voltage the current is about ±0.5 V and ±0.01 A, respectively, for the irradiance it is lower than 10 W/m
2
and for the temperature it is about ±0.5 °C.
Fig. 1
Outdoor PV modules tests bench.
a
Si amorphous (a-Si),
b
Si monocrystalline (c-Si),
c
Si micromorphous (μm-Si),
d
pyranometer, and
e
c-Si reference solar cell
In this work the PV modules investigated, are based on three silicon modules technologies which are namely the monocrystalline, the amorphous and the micromorphous. The specifications under standard test conditions (STC) (1000 W/m
2
irradiation, 25 °C ambient temperature and AM1.5 air density) of the PV modules samples of each technology are given in Table
1
. The monocrystalline module (c-Si) is a JT-185M, which contains 72 solar cells, with a maximum power of 185 W [
17
]. The amorphous module (a-Si) is a SCHOTT ASI 100, based on 72 amorphous silicon a-Si/a-Si tandem solar cells (3 × 24), which generate a maximum power of 100 W [
18
]. The micromorphous module (μm-Si) is a Bosch Solar EU1510, composed by an amorphous and a microcrystalline silicon multi-junction solar cell, as described in [
19
].
Table 1
STC specifications of the three PV modules
STC modules parameters
Specifications
Si monocrystalline
JT-185 M
Si amorphous
SCHOTT ASI 100
Si micromorphous
Bosch solar μm-Si EU1510
Maximum power (Pm)
185 W
100 W
110 W
Open-circuit voltage (Voc)
43.2 V
40.9 V
87 V
Short-circuit current (Isc)
5.76 A
3.85 A
1.98 A
Maximum power current (Vmpp)
36 V
30.7 V
64 V
Maximum power voltage (Impp)
5.14 A
3.25 A
1.76 A
Number of cells
72
72
100
Open-circuit voltage temperature coefficient (kv)
−0.34%/K
−0.33%/K
−0.37%/K
Short-circuit current temperature coefficient (ki)
0.06%/K
0.08%/K
0.08%/K
Surface
1.581 × 0.809 m2
1.308 × 1.108 m2
1.300 × 1.100 m2
Modeling method
Solar cell equivalent circuit
The model used in this study is based on a two-diode equivalent circuit of a solar cell, as shown in Fig.
2
. The solar cell output current
I
is given by the following equation [
20
]:
I=Iph-Irs1expV+IRsn1Vt1-1-Irs2expV+IRsn2Vt2-1-V+IRsRsh
where
Iph
is the photocurrent,
Irs1
and
Irs2
are the diode reverse saturation current of diode 1 and diode 2, respectively,
Irs1
is for the contact losses,
Irs2
is for the recombination losses in the depletion region [
20
].
Vt1
and
Vt2
are the thermal voltages of the two diodes.
n1
and
n2
are the diode ideality factors. (
n1
= 1,
n2
= 1.2) are the values used in this work as recommended by [
16
].
Fig. 2
Two-diode model cell equivalent circuit
Determination of two-diode model parameters
The photo-generated current
The photo-generated current
IPh
is given by Eq. (
2
) [
21
]:
IPh=(IPh0+KiΔT).GGSTC
with:
ΔT=T-TSTC
where
T
is the cell temperature (in Kelvin),
TSTC
= 25 °C,
IPh0
(A) is the light generated current at STC (in this work
IPh0
=
Isc, STC
),
G
is the irradiance measured by the reference cell and
GSTC
is the irradiance at STC (1000 W/m
2
),
Ki
is the temperature coefficient of the short-circuit current, provided by the manufacturer.
The diode reverses saturation currents
The diodes reverse saturation currents
Irs1
and
Irs2
for the two-diode model is given by [
16
]:
Irs1=Irs2=(Isc,STC+KiΔT)expVoc,STC+KvΔT\{(n1+n2)p\}VT-1
where
p
=
n1
+
n2
(where the value of
p
needs to be ≥2.2) as suggested by [
16
],
Kv
is the temperature coefficient of the open-circuit voltage, this value is given by the manufacturer as well as
Isc,STC
and
Voc,STC
.
VT
is the thermal voltage at STC.
The series and shunt resistances
The values of the serial resistance
Rs
and the shunt resistance
Rsh
are calculated at the similar by the method suggested by [
16
], with matching the calculated peak power of the PV module with the peak power given in the datasheet by iteratively increasing the value of
Rs
and calculating
Rsh
at the same time, by using he following equations:
Rsh=(Vmpp+ImppRs)IPh-I0[exp((Vmpp+ImppRs)/VT)+ exp ((Vmpp+ImppRs)/((p-1)VT))+2]-Pmaxdat/Vmpp)
Rs0
= 0,
Rsh0=VmppIsc,STC-Vmpp-Voc,STC-VmppImpp
where
Pmaxdat
is the datasheet peak power,
Rs0
and
Rsh0
are the initial conditions for the series resistance
Rs
and shunt resistance
Rsh
, respectively.
The solar cell temperature
In order to assess the electrical performance of the module, the suitable temperature to be used is
Tc
the temperature of the single cell of a PV module. This temperature is influenced by several elements, such as solar irradiance, wind speed, ambient temperature [
22
].
Tc
may be higher by a few degrees than that of the back-side
Tm
of the module. This difference depends basically on the materials composing the module and on the intensity of the solar radiation flux [
23
,
24
]. In this work, the following expression is used to define the relation between the two temperatures [
25
]:
Tc=Tm+GGrefΔT
where
Gref
is the reference solar radiation flux incident on the module (1000 W/m
2
) and ∆
T
defines the difference between the PV cells temperature and the back surface module temperature.
Results and discussion
Adjusting the model
The irradiance used for the simulation is that measured by a pyranometer which includes all the wavelengths comprised between 285 and 2800 nm. It shows a practical flat response over this whole interval. As every PV technology uses a material or a materials assembly which is characterized by a specific spectral sensitivity curve, then the photo current has to be accurately estimated by using a relationship between the measured spectrum by the pyranometer and the spectrum effectively absorbed for generating photo current. This must be done for each type of PV technology considered in this study.
This paper proposes a simple method for adjusting the real absorbed irradiation
G
by each kind of PV module technology. This is based on the fact that there is only one value of
G
that warranties that
Isc,m
=
Isc,e
where
Isc,m
and
Isc,e
are the adjusted and the experimental short-circuit current, respectively, by taking care that both the I–V and the P–V curves must match the experimental data.
The proposed method is based on incrementing until
Isc,m
=
Isc,e
where the I–V and P–V curves fits the experimental data, obtained for two given days. The aim is to find out the value of
G
that makes the calculated short-circuit current
Isc,m
to coincide with the experimental short-circuit current
Isc,e
. This needs numerous iterations till
Isc,m
=
Isc,e
, where
G
must be slowly incremented starting from
G
= 1. Figure
3
illustrates how this iterative process works.
Fig. 3
Matching algorithm for calculating the adjusted irradiation
G
This is an accurate fitting method, which allows getting the real absorbed irradiation for a given PV module technology and determining the way to adjust the two-diode model for the technology considered. The relationship between the calculated irradiation
G
and the measured irradiation
Gm
by the pyranometer was found to be linear function for the two chosen days as shown in Fig.
4
. This fitting procedure leads to an irradiation absorption equation that will be integrated in the modeling of the modules.
Fig. 4
Irradiation adjustment relationship for the three PV modules technologies deduced from 2 days data measurements
Model validation
The accuracy of the model using the proposed irradiation adjustment method in outdoor conditions is investigated through the assessment of the error obtained between the adjusted model results and the manufacturerʼs specifications at STC conditions; in this case the relative error (RE) was found below 2% for all the parameters (Table
2
). The comparisons have been conducted between the outdoor PV module measurements and the simulated results, for two different days; a sunny day (May 11, 2015) and a cloudy day (December 13, 2015). The number of measurements for both I–V and P–V characteristics exceeded 150 per day beginning from 9 am to 4 pm. The results of the comparison are shown in Figs.
5
,
6
,
7
,
8
,
9
and
10
. Each figure shows six curves at different values of irradiation
G
and temperature
T
, including the STC conditions curve for every type of PV module technology.
Table 2
Comparison, at STC conditions, between the parameters obtained by the irradiation adjusted two-diode model and the manufacturerʼs specifications parameters
Parameters at STC
G = 1000 W/m2
T = 25 °C
c-Si
a-Si
μm-Si
Manfct specs [17]
Model results
RE (%)
Manfct specs [18]
Model results
RE (%)
Manfct specs [19]
Model results
RE (%)
Pm (W)
185
184
0,54
100
99.97
0.03
110
109.95
0.04
Voc (V)
43.2
42.5
1.62
40.9
40.5
0.97
87
86.2
0.91
Isc (A)
5.76
5.71
0.86
3.85
3.79
1.55
1.98
1.95
1.51
Vmpp (V)
36
35.9
0.27
30.7
30.1
1.95
64
63.6
0.62
Impp (A)
5.14
5.12
0.38
3.25
3.19
1.84
1.76
1.74
1.13
Fig. 5
I–V (
a
) and P–V (
b
) measured (
scattered points
) and simulated (
solid line
) for the c-Si module (JT 185 M) (cloudy day, December 13th, 2015)
Fig. 6
I–V (
a
) and P–V (
b
) measured (
scattered points
) and simulated (
solid line
) for the c-Si module (JT 185 M) (sunny day, May 11, 2015)
Fig. 7
I–V (
a
) and P–V (
b
) measured (
scattered points
) and simulated (
solid line
) for the a-Si module (SCHOTT ASI 100) (cloudy day, December 13, 2015)
Fig. 8
I–V (
a
) and P–V (
b
) measured (
scattered points
) and simulated (
solid line
) for the a-Si module (SCHOTT ASI 100) (sunny day, May 11, 2015)
Fig. 9
I–V (
a
) and P–V (
b
) measured (
scattered points
) and simulated (
solid line
) for the μm-Si module (Bosch Solar EU1510) (cloudy day, December 13, 2015)
Fig. 10
I–V (
a
) and P–V (
b
) measured (
scattered points
) and simulated (
solid line
) for the μm-Si module (Bosch Solar EU1510) (sunny day, May 11, 2015)
For the sunny day (May 11, 2015), a very good consistency can be seen from Figs.
5
,
7
and
9
between the measured curves and the simulated ones all the important points as
Isc
,
Voc
and
Pm
in the conditions considered. For the cloudy day (Dec 13, 2015), there is also a good agreement for most of the important points of the curves as
Isc
and
Voc
, except for
Pm
which is slightly far from the simulated power. This is probably due to the values of
Rs
and
Rp
, which were taken as constants. In the case of monocrystalline PV module, the model seems to underestimate the short-circuit current at higher operating temperatures (Fig.
6
; Table
3
). For the amorphous PV module, quite large differences were found between the measured the simulated I–V and P–V curve, especially in the case of low irradiations (Fig.
7
; Table
4
), large relative error for the maximum power estimation for the case of the micromorphous PV module, quite large differences between the measured and simulated I–V and P–V curve can be found, both in case of low and high irradiation as shown in Table
5
. The gaps are more pronounced for the cloudy day (Fig.
9
) than for the sunny day (Fig.
10
). These variations can be explained by the simplifications used in the model for the reverse diode saturation, the method used to calculate the
Rs
and
Rsh
, and the use of the temperature coefficients (
Ki
and
Kv
) given by the manufacturer which are not suited to the outdoor conditions.
Table 3
Parameters measured (m) and calculated with the adjusted model (e) for the c-Si module (JT 185 M)
G
(W/m2)
T
(°C)
Isc,m
(A)
Isc,e
(A)
Voc,m
(V)
Voc,e
(V)
Imp,m
(A)
Imp,e
(A)
Vmp,m
(V)
Vmp,e
(V)
Pmpp,m
(W)
Pmpp,e
(W)
December 13, 2015
473
28.3
2.49
2.49
43
42.83
2.32
2.33
36
34.92
83.63
81.37
549
31.4
2.9
2.91
42.7
42.76
2.71
2.7
35.4
34.68
95.97
93.79
820
44.4
4.49
4.43
41.2
41.71
4.18
4.05
32.9
32.8
137.69
132.68
712
31.8
3.73
3.82
43.1
43.28
3.5
3.53
35.3
34.71
123.44
122.67
645
39
3.41
3.48
41.6
42.15
3.18
3.19
34
33.93
108.17
108.27
295
33.8
1.56
1.62
41.1
41.29
1.44
1.49
34.7
34.37
49.87
51.17
May 11, 2015
672
48.1
3.69
3.78
40.6
40.75
3.43
3.52
32.8
31.63
112.51
111.22
713
50.1
3.92
4.01
40.4
40.71
3.65
3.65
32.4
32.08
118.11
117.09
771
49.3
4.24
4.33
40.7
40.85
3.94
3.96
32.5
31.84
128.09
125.99
865
53.6
4.77
4.87
40.1
40.56
4.42
4.41
31.7
31.22
140.17
137.77
914
54
5.04
5.15
40.2
40.62
4.67
4.62
31.6
31.36
147.54
144.96
952
54.2
5.25
5.37
40.2
40.84
4.86
4.88
31.5
31.02
153.06
151.44
Table 4
Parameters measured (m) and calculated with the adjusted model (e) for the a-Si module (SCHOTT ASI 100)
G
(W/m2)
T
(°C)
Isc,m
(A)
Isc,e
(A)
Voc,m
(V)
Voc,e
(V)
Imp,m
(A)
Imp,e
(A)
Vmp,m
(V)
Vmp,e
(V)
Pmpp,m
(W)
Pmpp,e
(W)
December 13, 2015
475
25.9
1.39
1.43
37.8
37.83
1.04
1.21
30.3
29.27
31.62
35.43
547
27.9
1.74
1.76
38.1
37.9
1.37
1.47
30.1
29.37
41.31
43.05
821
38.1
3.09
3.12
37.9
37.66
2.62
2.62
28.1
27.52
73.6
72.1
732
29.8
2.78
2.73
38.9
38.6
2.33
2.29
29.5
28.17
68.84
64.56
782
38.8
2.97
2.94
37.8
37.49
2.51
2.44
28.1
27.83
70.57
67.9
245
30.6
1.08
1.06
36.5
36.56
0.76
0.89
29.2
27.11
22.29
24.1
May 11, 2015
673
44.3
2.77
2.79
36.8
36.39
2.32
2.3
27.5
27.18
63.8
62.57
715
46.6
2.96
2.98
36.7
36.32
2.5
2.45
27
27.11
67.57
66.53
772
46.3
3.22
3.23
36.9
36.55
2.73
2.64
26.9
27.25
73.55
71.86
865
49.4
3.65
3.67
36.7
36.26
3.11
3.04
26.2
26.43
81.58
80.24
935
47.8
3.97
3.98
37.1
36.61
3.39
3.31
26.2
26.22
88.84
86.92
951
48.8
4.1
4.1
37.1
37.06
3.51
3.35
25.9
26.8
90.96
89.89
Table 5
Parameters measured (m) and calculated with the adjusted model (e) for the μm-Si module (Bosch Solar EU1510)
G
(W/m2)
T
(°C)
Isc,m
(A)
Isc,e
(A)
Voc,m
(V)
Voc,e
(V)
Imp,m
(A)
Imp,e
(A)
Vmp,m
(V)
Vmp,e
(V)
Pmpp,m
(W)
Pmpp,e
(W)
December 13, 2015
471
27.7
0.77
0.78
80.4
81.04
0.57
0.63
67.4
61.73
38.27
38.87
547
31.1
0.95
0.96
80.4
81.23
0.75
0.76
66.5
63.41
49.7
48.11
819
44.1
1.65
1.63
79.5
79.64
1.42
1.35
61.8
58.99
87.78
79.74
703
32.8
1.38
1.4
81.3
82.45
1.15
1.13
65.2
62.08
75.25
70.01
786
38.2
1.55
1.55
80.5
81.18
1.32
1.24
63.5
61.49
83.56
76.03
373
31.6
0.72
0.74
79.3
79.29
0.53
0.61
66.5
59.85
35.1
36.39
May 11, 2015
672
45.7
1.35
1.36
78.7
77.62
1.19
1.14
59.2
56.84
70.72
64.95
708
44.9
1.42
1.44
79
77.99
1.26
1.2
59
57.52
74.55
69.24
768
44.3
1.55
1.56
79.4
78.44
1.38
1.29
58.4
59.51
80.61
76.64
856
46.7
1.73
1.75
79.2
78.07
1.55
1.51
56.8
57.83
88.12
87.12
933
44.8
1.89
1.91
79.9
79.27
1.7
1.65
56.2
58.72
95.48
96.67
952
52.4
1.92
1.96
78.3
77.3
1.74
1.64
58.9
59.2
102.44
97.2
Figure
11
shows the evolution of the absolute error of the power between the measured values and the simulated ones as a function of time, for the 2 days considered. For the sunny day (a), the values of the absolute errors of the power for all the module types are small. The average error is: 0.45% for the monocrystalline, 1.74% for the amorphous and 1.4% for the micromorphous. For the cloudy day (b), the average error is: 2.39% for the monocrystalline, 3.19% for the amorphous and 7% for the micromorphous. As it is shown in Fig.
12
, the gap between the simulated and measured efficiency of the modules versus the time for the 2 days is small for the case of the amorphous and the micromorphous module, but it is relatively high for the monocrystalline module which could be due to the fact that the monocrystalline module is older than the others and in the model used the aging aspect was not taken into account.
Fig. 11
Absolute error of the power for the c-Si, a-Si and μm-Si modules as function of time
a
sunny day and
b
cloudy day
Fig. 12
Measured (
scattered points
) and simulated (
solid line
) efficiency for c-Si, a-Si and μm-Si modules as function of time.
a
Sunny day and
b
cloudy day
Generally a good agreement was found between the calculated and measured results, both for the I–V and the P–V curves and for the characteristic points and this validates the accuracy of the adjusted two-diode model presented. The average absolute error of the power for all the modules is comprised between 0 and 5% depending on the type of the module technology. This error can be reduced in the future researches, by taking into account other correlation parameters, such as the effect of partial or total shading of the cells of the photovoltaic module, the measurement error of the temperature modules caused by the thermocouples and a more accurate modeling of the
Rs
and
Rsh
by using the collected data by our PV platform for different seasons during the year and for each module type.
Conclusion
An accurate electrical model for PV module based on two-diode model is presented in this work using a new method for adjusting the irradiation received by each type of module’s technology. In order to show the effectiveness of the model three types of PV modules technologies have been used. A comparison between the predicted performance given by the adjusted model and the measured ones in outdoor conditions modules for two specific days (sunny and cloudy) was presented. Both I–V and P–V show consistency and accuracy of the model for different values of irradiances and of temperature. The average absolute error between the measured and the simulated power for all modules is between 0.01 and 5% depending on the type of the module technology. As a future perspective, we propose the development of this model by taking into account the influence of temperature in evaluating the adjusted irradiation
G
in order to reduce the gap between the simulation and the experimental results, using our installed PV platform.
Acknowledgements
The authors gratefully acknowledge the Development Unit of Solar Equipment-UDES/Renewable Energy Development Center-CDER, Algeria, the URMER, University of abou-bakr belkaid, Tlemcen-Algeria and Mr. Hachemi Rahmani for his help in developing the codes.
References
Muneer and Asif (2003) Generation and transmission prospects for solar electricity: UK and global markets (pp. 35-52) 10.1016/S0196-8904(02)00043-2
Silverman and Jahn (2014) Characterization of performance of thin-film photovoltaic technologies
Unknown ()
Groenewolt et al. (2016) Methods for modelling and analysis of bendable photovoltaic modules on irregularly curved surfaces 7(3) (pp. 261-271) 10.1007/s40095-016-0215-3
Jamadi et al. (2016) Very accurate parameter estimation of single- and double-diode solar cell models using a modified artificial bee colony algorithm 7(1) (pp. 13-25) 10.1007/s40095-015-0198-5
Kurobe and Matsunami (2005) New two-diode model for detailed analysis of multi-crystalline silicon solar cells 44(200) (pp. 8314-8321) 10.1143/JJAP.44.8314
Zaghba et al. (2016) A combined simulation and experimental analysis the dynamic performance of a 2 kW photovoltaic plant installed in the desert environment 7(3) (pp. 249-260) 10.1007/s40095-016-0216-2
Nishioka et al. (2007) Analysis of multicrystalline silicon solar cells by modified 3-diode equivalent circuit model taking leakage current through periphery into consideration (pp. 1222-1227) 10.1016/j.solmat.2007.04.009
Unknown ()
Gow and Manning (1999) Development of a photovoltaic array model for use in power electronics simulation studies (pp. 193-200) 10.1049/ip-epa:19990116
Magare et al. (2016) Effect of seasonal spectral variations on performance of three different photovoltaic technologies in India 7(1) (pp. 93-103) 10.1007/s40095-015-0190-0
Unknown ()
Ishaque et al. (2011) Simple, fast and accurate two-diode model for photovoltaic modules (pp. 586-594) 10.1016/j.solmat.2010.09.023
Unknown ()
Unknown ()
Unknown ()
Unknown ()
Unknown ()
Almonacid et al. (2010) Characterisation of PV CIS module by artificial neural networks. A comparative study with other methods (pp. 973-980) 10.1016/j.renene.2009.11.018
Skoplaki et al. (2008) A simple correlation for the operating temperature of photovoltaic modules of arbitrary mounting (pp. 1393-1402) 10.1016/j.solmat.2008.05.016
Skoplaki and Palyvos (2009) Operating temperature of photovoltaic modules: a survey of pertinent correlations (pp. 23-29) 10.1016/j.renene.2008.04.009