Faculty of Electrical Engineering, Bialystok University of Technology, Bialystok, PL
Abstract
To promote the use of renewable energy (RE), several types of RE policies have been implemented globally. Among these, feed-in tariff (FiT) is one of the most accepted mechanisms of pricing policy. However, choosing the best policy for a market with a high RE penetration is a challenge. A case of Bhutan is considered in this paper as the source of electrical energy is predominantly hydropower. Additionally, a generous subsidy is provided by the government to keep the electricity tariff to a minimum. Recently, there has been an increase in the advocacy and motivation for other forms of RE sources (RES) to supplement hydropower and increase energy security in Bhutan. Bhutan aims to achieve a total of 20 MW of non-hydro RES by 2025 as per the RE policy of Bhutan. However, Bhutan still does not have an RE pricing policy, and therefore, there is a need to institute a suitable pricing mechanism to accommodate the penetration of the planned non-hydro RES. This paper discusses the challenges in introducing FiT for non-hydro RES in an electricity market dominated by hydropower in Bhutan. Subsequently, recommendations are made in the wake of subsidised electricity tariff, which is the lowest in the region at 0.0171 USD/kWh for low voltage customers. FiTs for solar photovoltaic based on different categories of customers have been computed and proposed.
Introduction
Globally, there has been an increase in the use of renewable energy sources (RES) primarily to discourage the use of fossil-fuelled energy generation, reduce greenhouse gas emissions and increase energy security. Policy schemes such as feed-in tariff (FiT), net-metering and other mechanisms have been instituted to promote the use of RES. However, in regions where the share of RE is dominant, designing and implementing RE policy becomes a challenge. One such region is Bhutan, where the source of electricity is predominantly hydropower and a policy to provide incentives for the installation of RE is yet to be instituted.
Bhutan is blessed with a huge hydropower potential of 36,900 MW with annual production capacity of 154,000 GWh [
1
]. Chukha Hydropower Plant, the country’s first hydropower plant (HP) was established in 1986–88. Since then, there has been a considerable progress in the development of HPs in Bhutan. The total installed capacity of hydropower in Bhutan today stands at 2335 MW [
1
], which is 6.32% of the total potential. About 70% of the total generation is exported and sold to India [
2
], Bhutan’s closest neighbour and ally because of which there has been a surge in the country’s economy. The electricity exported to India topped 4,465 MU fetching Indian Rupees (Rs.) 10,080 million (~ USD 136 million) in 2020, and the revenue from hydropower is approximately 7.5% of the country’s gross domestic product (GDP) [
2
].
In addition, Bhutan had set up an ambitious target of providing 100% electricity coverage to all households by 2020, but this target was brought forward, to be achieved by the year 2013 [
3
]. In May 2008, Bhutan and India signed the
Protocol to the 2006
Agreement concerning Cooperation in the Field of Hydroelectric Power and agreed to achieve a total generation of 10,000 MW by the year 2020 in Bhutan [
4
]. However, considering the current pace of development and complexities involved in the construction of HPs and the fact that excessive dependence on a single resource for electricity would imperil the country’s energy security, the country has recently started identifying RES that would be most appropriate for Bhutan. Wind power and solar power are the front runners among others in Bhutan. The theoretical solar potential in Bhutan is estimated at 6 TW, while the restricted technical potential is estimated at 12 GW [
5
]. As per [
5
], the wind energy potential is estimated at around 760 MW, mostly in the northern region of Bhutan, with Wangduephodrang district in the north accounting for around 19% of the total potential. The two districts in southern Bhutan; Chukha has 12% and Dagana, 10% of the total wind power potential [
5
]. Other renewable technologies such as biomass and biogas are mainly limited to cooking purposes in rural areas. RE policy has not been implemented yet in Bhutan and there are no private generation companies (GenCos). As the country look towards diversifying the sources of energy in Bhutan, there is a need to institute an appropriate RE pricing scheme. Among the existing RE policies, FiT is considered the most effective and widely implemented RE policy in the world [
6
],[
6
]. This paper discusses the challenges in introducing FiT in Bhutan and subsequently proposes recommendations in the wake of subsidised electricity tariff and a non-liberalised market dominated by hydropower.
Methodology
Energy sector in Bhutan
The energy sector in Bhutan has been restructured to address the need of the changing market scenario and to keep pace with the global change. The restructuring of the energy sector in Bhutan has not been long. It was only in 2002, when the energy sector, which was fully state-owned was restructured to derive maximum benefits for the country and the consumers.
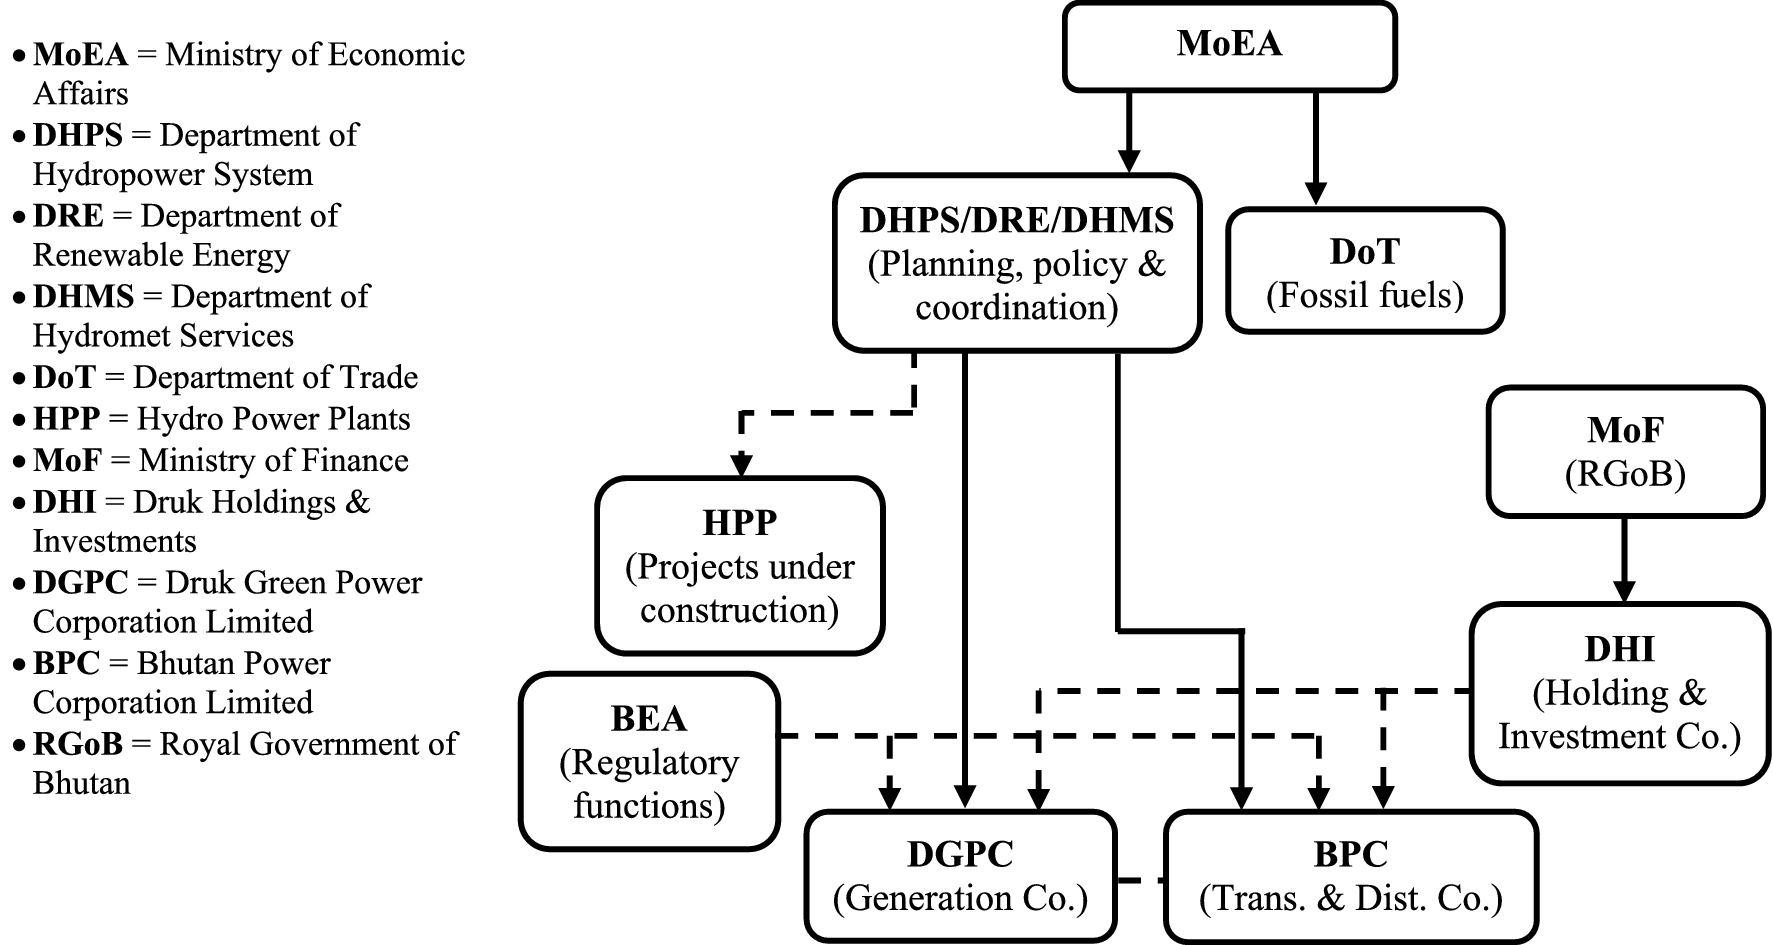
Bhutan Power Corporation Limited (BPC), established on July 1, 2002, serves as the system operator for Bhutan and is responsible for both transmission and distribution of electricity in the country. In addition, BPC also looks after the Bhutan Power System Operator (BPSO), small/micro HPs and wind power plant comprised of two wind power generators of 2×300 kW in Rubessa, Wangduephodrang. Therefore, the role of BPC is comparatively unique from that of a conventional system operator elsewhere. Besides providing electricity services to the nation, BPC as one of the companies of Druk Holding and Investments (DHI) is also mandated to generate revenue for the company. Figure
1
shows the overall structure of energy sector in Bhutan. In general, the power and energy sector in Bhutan is comprised of only government entities and currently, there are no private GenCos, except as end-user consumers.
Fig. 1
Structure of energy sector in Bhutan
Renewable energy in Bhutan
Driven by the increasing domestic demand, risks due to reliance on a single source of electricity and the need to harness other forms of clean energy, the Ministry of Economic Affairs of Bhutan (MoEA) had come up with a draft RE policy in 2011, which was finalised and released as the ‘Alternative Renewable Energy Policy 2013 (AREP)’, the first edition of the renewable energy policy in Bhutan. Bhutan shall strive to generate 20 MW by 2025 through a mix of renewable technologies such as solar power, wind power, biomass, and others [
8
]. However, the targets set in AREP [
8
] as shown in Table
1
are comparatively lower than what is available [
5
].
Table 1
Renewable energy scenarios proposed in Bhutan by 2025 [
5
,
8
]
Source
Capacity by 2025 (MW)
AREP target
Low case
Base case
High case
Small Hydro
–
37.2
67.5
110
Wind
5
2.4
5.1
7.8
Solar PV
5
2
6.1
11.9
Biomass
5
0.6
1
8.1
Others
5
–
–
–
Total
20
42.2
79.7
137.8
Although focus on small hydropower has been made in [
8
], no specific target has been set for small hydropower less than 25 MW.
In Bhutan, the development and implementation of wind power and solar photovoltaic (PV) and their integration into the national grid is prioritised over other non-hydro RES [
9
]. The current priorities are small hydropower, wind power and solar PV as they seem most appropriate and viable considering the rugged mountain terrains of Bhutan [
8
]. In a country where hydropower is the main source of electricity and that major portion of the country’s economy depends on hydropower, penetration of other sources of renewable energy is seen as a challenge, primarily due to the overall costs and associated turnover. Keeping in view the challenges associated with hydropower generation, the threat to energy security due to reliance on a single source of electricity, and the increasing imports of fossil fuels, Bhutan has started diversification of its energy resources [
8
]. As per [
9
], major activities have been planned to promote RE and include the following types of RES:
Wind power
Solar PV
Biomass, and
Small hydropower.
In 2014, two wind electric generators were installed in Rubessa, Wangduephodrang. The 2×300 kW wind power plant was established mainly to reduce the import of electricity during the lean period, increase sale during summer and diversify energy resources in the country. Although non-hydro RES for the generation of electricity (RES-E) has penetrated the market, BPC does not levy a separate tariff to its customers.
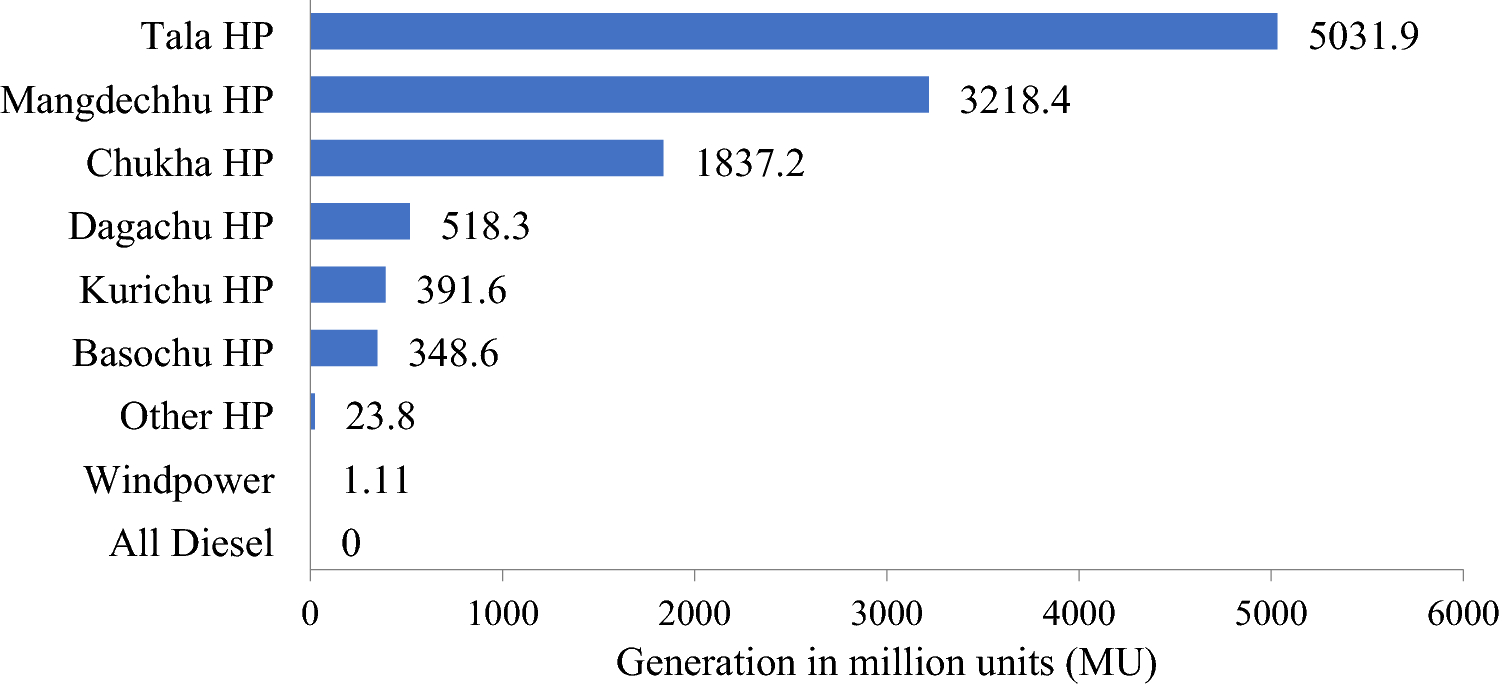
BPC is responsible for the transmission and distribution of electricity to residential, commercial, and industrial customers irrespective of the type of source of electricity. However, with the increase in the percentage of RE penetration, there will be a need to appropriately design and implement a pricing mechanism to suitably benefit investors as well as meet the objectives of the government. Additionally, the RE policy of Bhutan also indicates a FiT scheme to be introduced [
8
]. At the moment, non-hydro RES penetration has remained insignificant and therefore, the electricity pricing modality and the tariff thereof continue to remain unchanged. The electricity generation from various sources in 2020 is shown in Fig.
2
. [
10
].
Fig. 2
Electricity generation from various sources in 2020
Electricity generation from non-hydro RES-E will grow and the share of these RES-E is expected to reach 20 MW by 2025. The DRE had planned to install three major renewable power plants: A 30 MW solar power plant at Shingkhar, Bumthang, a 17 MW solar power plant at Sephu, Wangduephodrang and a 23 MW wind power plant at Gaselo, Wangduephodrang [
11
]. The planned solar power plants will be the first of their kind and the largest solar power plants in the country. While the plan to install the 17 MW Solar PV plant in Sephu is in progress, the 30 MW solar PV plant in Shingkhar has been suspended due to community issues.
Additionally, a utility scale 180 kW grid-tied ground mounted solar power plant was inaugurated on October 4, 2021, in Rubessa, Wangduephodrang as a pilot project. The solar power plant is expected to provide electricity to around 90 households in the locality through the grid. Therefore, FiT, or other pricing mechanisms will have to be carefully planned to suit the needs of the country in view of the increase in non-hydro RES-E.
Feed-in tariff
Feed-in tariff in general is a government driven policy to promote and support investments in renewable power generation. FiT scheme enables the RE GenCos, such as solar, wind or small hydropower to receive an incentive for electricity generation.
As per [
7
], there are two types of FiT models: (i) Market-dependent or Feed-in Premium (FiP) model and (ii) Market-independent or Fixed Price model, where the main distinction is the dependency on the actual electricity market price. While the market-dependent model is associated with an additional premium on top of the market price, the market-independent model offers a guaranteed minimum payment for every unit of electricity injected into the grid. FiTs facilitate long-term financial incentive to those who participate as GenCos and contribute electricity to the grid. Unlike the current system of unit-based pricing, the pricing is based on the conditions of the FiT contract with the utility company. A well-planned FiT can create a robust market for RE and encourage increased participation of RES-E. In addition to FiT, the following types of regulatory instruments in the promotion of RE are implemented:
Feed-in Premium
Auction
Quota
Certificate system
Net-metering
Mandate, and
Registry
Fiscal incentives and other benefits such as grid access, access to finance and socio-economic benefits are also being implemented in the promotion of RE technologies. FiT schemes have been conducive to RE development since the early 2010's, however the focus has now shifted from FiTs to competitive tendering schemes such as auctions [
12
]. In [
13
], they have carried out an analysis to determine the effectiveness of the FiT policy and conclude that there are multiple avenues that can be leveraged to achieve a larger representation of RE. There is a preference for auctioning, net-metering and mini-grids as alternative mechanisms to FiT policies. It is reported that the implementation of these options should be done effectively to avoid challenges faced with the FiT policy [
13
]. In Malaysia, successful utilisation of RES for electricity generation and the global implementation of FiT has encouraged the implementation of FiT. Although FiT can be conveniently implemented for biomass, biogas and solid waste energy, FiT has not attracted expected investment in solar and wind RES due to their requirement of higher FiTs [
14
]. In Taiwan, the government has adopted FiTs coupled with a bidding process to determine subsidised tariffs due to difficulties in setting tariff each year and because FiTs often cannot catch up with the market and technology-varying conditions [
15
]. Several nations have introduced technology-specific FiTs combined with net-metering scheme.
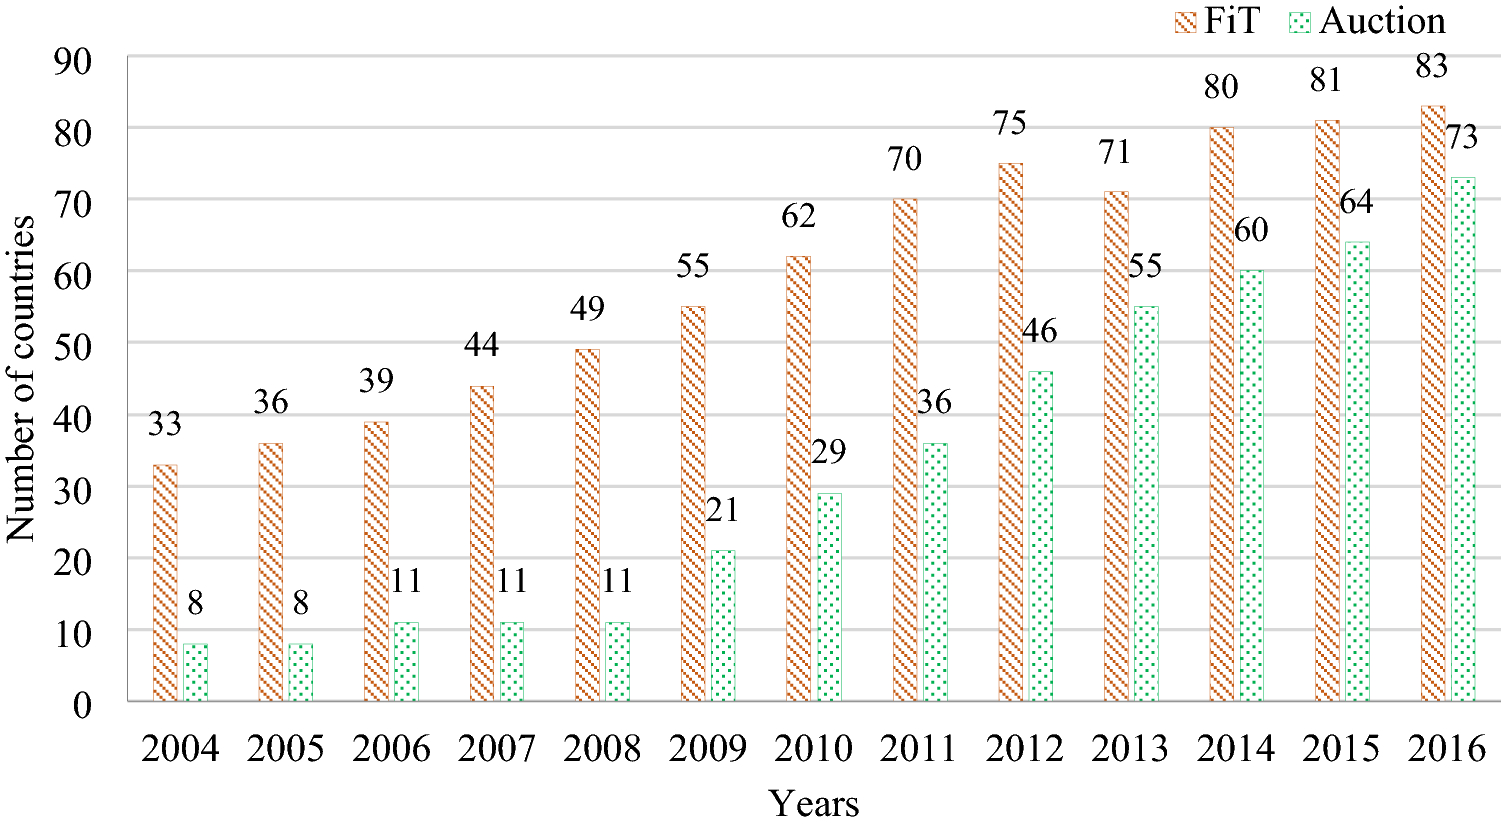
Although FiT is an effective RE policy, it is interesting to note that several countries have either revised or discontinued their FiT policy. In few cases, due to reduction in the solar PV costs, FiTs were replaced by combined policies and to prevent over-subsidisation in the markets [
16
]. More number of countries have opted auctions modality over FiTs as their renewable energy pricing policy [
17
]. The number of countries following FiT and Auction modality from the year 2014 to 2016 is shown in Fig.
3
[
17
]. As seen from the trend, by the end of 2016, more than 70 countries had adopted auctions as opposed to FiT. A substantial increase in the number of countries adopting auctions is noted as opposed to FiT, mostly due to their flexibility of design and because they can be made country specific.
Fig. 3
Number of countries adopting FiT and Auction [
17
]
Results and discussions
Feed-in tariff in Bhutan
At the moment, there is a lack of FiT and other incentive schemes for RES in Bhutan. It would require a robust enabling policy environment for Bhutan to achieve a total of 20 MW of alternative RE generation by 2025 as planned. To enable a promising policy environment for alternate RE resources in Bhutan, the following are considered the highest priorities [
18
]:
formulation of renewable energy master plan to identify, assess, and forecast the resources,
formulation of feed-in tariff framework, and
preparation of implementation rules and guidelines of the alternative renewable energy policy.
With a feed-in policy in place, regulatory agencies such as the Bhutan Electricity Authority (BEA) and the DRE could initiate the development, implementation, and monitoring of the FiT programme. Further, the lack of private GenCos in Bhutan has not conditioned the government to pursue such feed-in policies. Further, in a study conducted by [
19
], it has been opinioned that there is a barrier to promoting non-hydro RES due to the absence of a FiT policy in Bhutan. Based on the nature of the feed-in policy (feed-in tariff or feed-in premium), several types of incentives can be developed. As per [
8
], BEA shall design and develop the following:
fed-in tariff as per the principles contained in the policy, and
norms related to grid connectivity/interfacing and load dispatch, etc.
Considering all circumstances, the current choice of RE pricing policy in Bhutan is FiT [
8
].
Electricity pricing in Bhutan
Bhutan’s current electricity market structure is unique as all components of the power sector (generation, transmission, and distribution) operate under one entity, the DHI, which is the largest and only government-owned holding company in Bhutan. To encourage additional participants in the electricity market, the government will have to devise various strategies, and this will necessitate a major reform in the electricity market structure. Further, Bhutan currently exports electricity to only a single customer, which is India. To benefit more customers, enhance cross-border energy trade, and increase energy security, Bhutan will have to continue exploring opportunities to export energy to other neighbouring countries such as Bangladesh, Nepal, and Myanmar. Additionally, Bhutan’s dependency on energy export from hydropower, a single source of energy comes with a challenge to its energy security.
The electricity pricing in general is determined by the generation cost, transmission cost, distribution cost, interests and depreciation of assets, salaries of employees, and profit. These costs further depend on numerous factors, such as connected load, load conditions, demand factor, load factor, diversity factor, plant capacity factor, etc., which makes the fixation of tariff in an electricity market rigorous. BPC as the state-owned system operator, levies electricity costs on customers and these prices are regulated by BEA. The past and current end-user tariff is shown in Table
2
[
20
,
21
].
Table 2
Electricity tariff in Bhutan
Tariff Structure
Unit**
1/1/2017 – 30/6/2017
1/7/2017 – 30/6/2018
1/7/2018 – 30/6/2019
1/10/2019 – 30/6/2020
1/7/2020 – 30/6/2021
1/7/2021 – 30/6/2022
Low Voltage (LV)
LV Block I (Rural)
Nu./kWh
0
0
0
0
0
0
0–100 kWh
LV Block I (Highlanders)
Nu./kWh
–
–
–
0
0
0
0–200 kWh
LV Block I (Others)
Nu./kWh
1.28
1.28
1.28
1.28
1.28
1.28
0–100 kWh
LV Block II (All)
Nu./kWh
2.52
2.60
2.68
2.68
2.68
2.68
101–500 kWh*
LV Block III (All)
Nu./kWh
3.33
3.43
3.53
3.57
3.60
3.64
> 500 kWh*
LV Bulk
Nu./kWh
3.79
3.90
4.02
4.06
4.10
4.14
Medium Voltage (MV)
Energy Charge
Nu./kWh
2.00
2.07
2.16
2.24
2.45
2.65
Demand Charge
Nu./kWh
250
275
300
325
325
325
High Voltage (HV)
Energy Charge
Nu./kWh
1.59
1.59
1.59
1.50
1.50
1.50
Demand Charge
Nu./kVA/Month
262
262
262
292
292
292
Wheeling
Nu./kWh
0.195
0.195
0.195
0.27
0.27
0.27
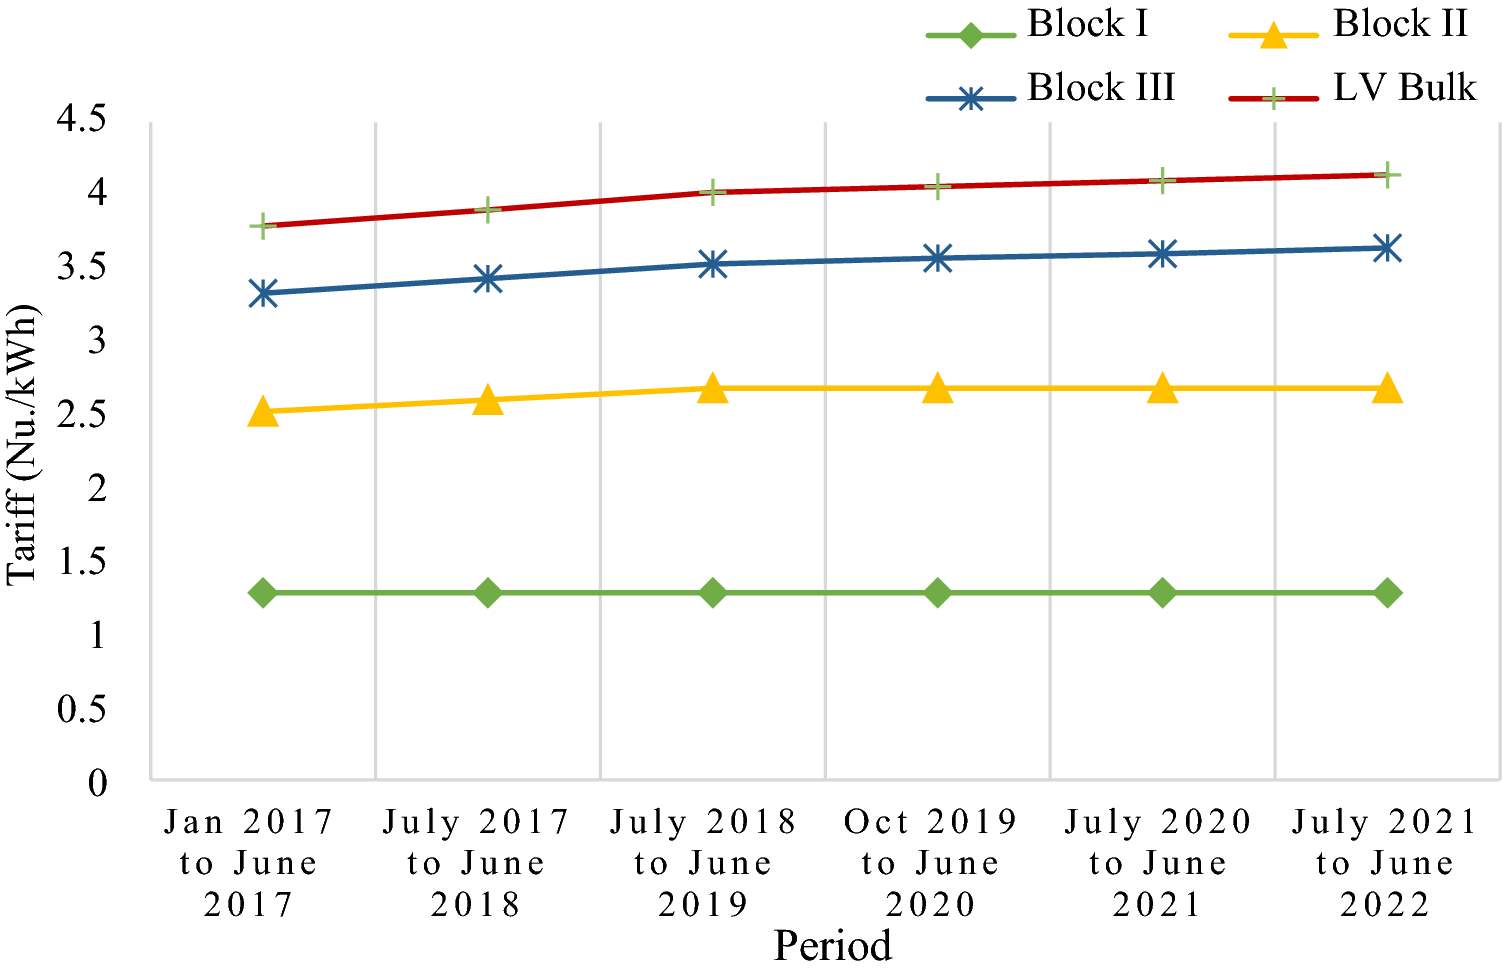
Over the years, there has been a steady rise in the domestic electricity tariff based on numerous factors. Although small, the rise has been steady, and an extrapolation of the tariff gives an average annual increase of 1.8%. The variation in the tariff for low voltage (LV) customers from 2017 to 2022 (projected) is shown in Fig.
4
. It can be concluded that the rise over the years is held minimum due to subsidies provided by the government.
Fig. 4
Increase in the LV tariff from 2017 to 2022
The electricity prices in Bhutan are determined by the BEA and fixed in accordance with the
Tariff Determination Regulation 2016
of Bhutan. The regulation provides for the electricity prices in accordance with the
Electricity Act of Bhutan 2001
and the
Domestic Electricity Tariff Policy 2016
. These prices apply to all licensees including the following [
22
]:
Generation licensee.
Transmission licensee.
Distribution and supply licensee.
System operation licensee.
Further, all electricity tariffs for the sale of electricity must comply with the terms of the regulation, except for the following [
22
]:
import of electricity from other countries,
export of electricity to other countries, and
sale of electricity from generators under
Power Purchase Agreements
(PPA).
The existing low tariff has enabled significant success in the overall socio-economic growth in Bhutan. There has also been an increase in the small, medium, and large energy intensive industries due to the access to reliable and affordable electricity. This is evident from the government’s initiative of establishing various special economic zones in the country [
7
], where citizens are encouraged to establish various industries through government-led schemes. However, hydropower projects have their own share of shortfalls. Environmentalists continue to question whether hydropower projects in Bhutan can really be considered as ‘clean’ sources of electricity.
In addition, there have been bottlenecks in the construction of hydropower projects, such as the construction of the 1200 MW Punatshangchhu-I which began in 2008 and was scheduled to be completed in 2016, but the completion date has been further delayed. The project has been facing serious challenges due to geological conditions in the construction of the dam. The delay in the completion of the project has caused serious financial and resource implications to the government.
Considering all circumstances, the government has now started embracing other forms of RE. Several projects are in the pipeline and constructions will begin soon. A pricing modality needs to be developed to encourage the establishment of non-hydro RES-E projects in the country. As per [
8
], all RE projects for electricity generation except for mini, micro, and small hydropower are to be developed under Build, Own, Operate (BOO) model.
Electricity tariff computation
The electricity tariff payable to BPC is derived as follows [23]:
ET=CoS-SRUSD/kWh
where
CoS=GC+NC
.
The cost of supply
CoS
is the sum of generation cost
GC
from DGPC and network cost
NC
(transmission and distribution) from BPC.
CoS
includes the allowances for operation and maintenance costs, depreciation, return on fixed assets, i.e., including an allowance for company taxation, cost of working capital and any regulatory fees, duties, or levies that the licensee is liable to pay.
The network cost
NC
, includes the operation and maintenance costs, depreciation, return on fixed assets i.e., including an allowance for company taxation, cost of working capital and any regulatory fees, duties, or levies that the licensee is liable to pay, cost of losses to transmit, distribute and supply electricity to the customers.
SR
is the subsidy granted by the royal government of Bhutan (RGoB) to BPC to keep the MV and LV customer tariffs lower than the
CoS
.
The end-user tariff for LV, MV and HV works out as shown in Table
3
for the tariff sample of 2017 [
23
]. From the table, we see that the unit price of LV for all levels of block is Nu. 5.81 (USD 0.0776). The subsidy provided by the government ranges from 0 to 5.81 Nu./kWh (0 to 0.0776 USD/kWh), based on the customer type and consumption. For the LV customers, it ranges from 1.91 to 5.81 Nu./kWh (0.0255 to 0.0776 USD/kWh), which works out to a minimum of 32.87% to a maximum of 100% for LV customers. Likewise, subsidy is also provided to MV customers. Therefore, it is evident from Table
3
that the government provides electricity subsidy based on different category of customers, mainly supporting those in rural areas.
In Bhutan, all generation plants fully owned by the RGoB must provide 15% of the annual generation as royalty energy to the government free of charge [
24
]. This enables the government to grant significant subsidies so that the domestic tariff is kept at minimum. To ascertain the impact of the subsidy provided by the government which eventually benefits the end-user customers in Bhutan, electricity pricing in the South Asian region is compared.
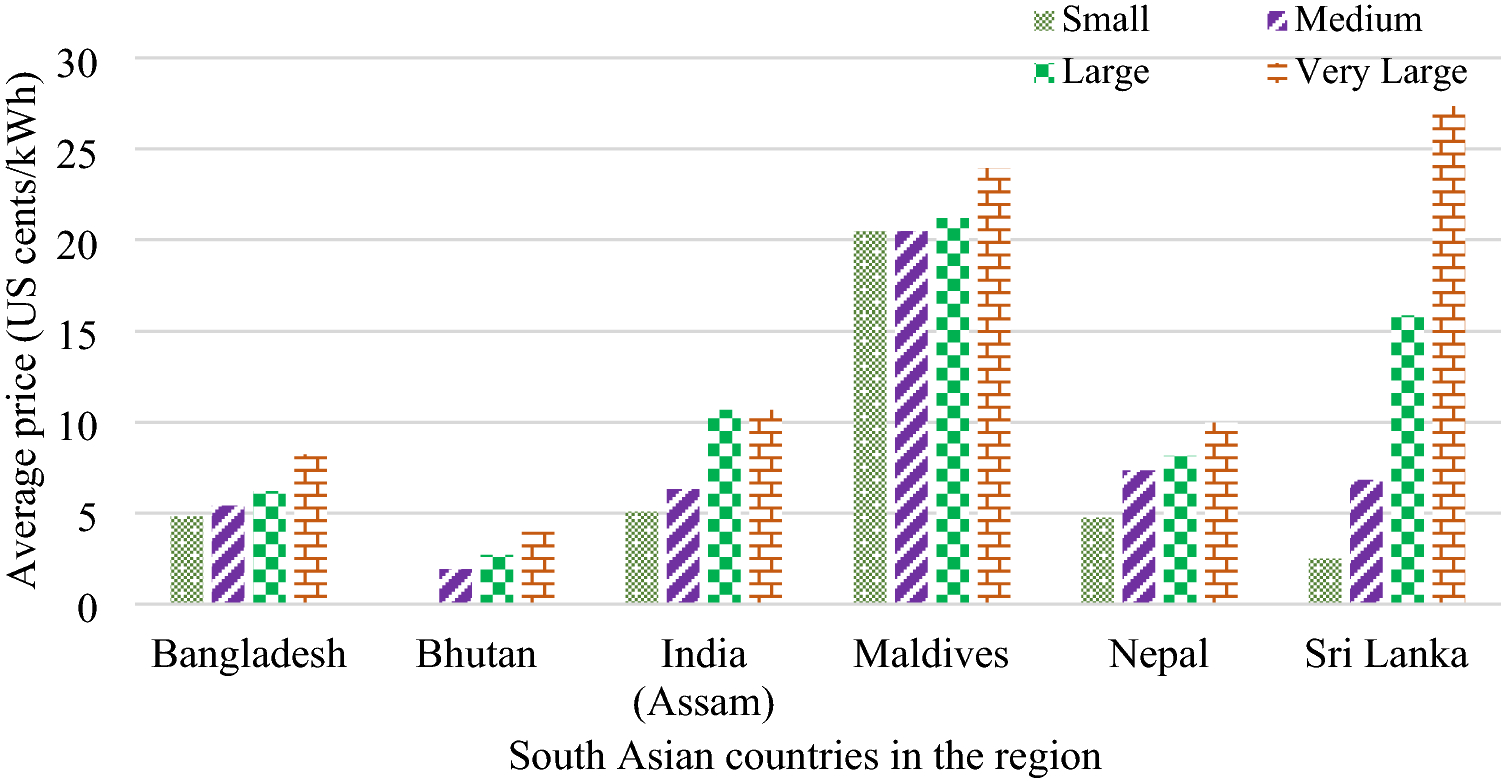
Table
4
gives a comparison of the average electricity pricing across South Asian countries and Fig.
5
compares the average electricity price for household customers as of October 2015 [
24
]. From the comparisons, it is evident that Bhutan has the lowest unit price for household customers among the South Asian countries, while Sri Lanka has the highest unit price with a monthly consumption of 600 kWh. The comparison also indicates that the average unit prices of household customers as well as that for commercial and industrial customers are the lowest in Bhutan. Unfortunately, these lead to bigger challenges for those wishing to venture into non-hydro RES-E in Bhutan. Consequently, designing a renewable pricing policy becomes a bigger challenge.
Table 4
Average electricity price in South Asian countries in US cents/kWh at unity power factor [
24
]
Customer category
Class
Electricity use (kWh/month)
Max. demand (kW)
Bangladesh
Bhutan
India (Assam)
Maldives
Nepal
Sri Lanka
Household
Small
30
–
4.82
0.00
5.09
20.47
4.76
2.50
Medium
90
–
5.42
1.92
6.32
20.47
7.35
6.84
Large
180
–
6.21
2.70
10.68
21.18
8.16
15.89
Very Large
600
–
8.24
3.97
10.68
23.93
9.99
27.35
Commercial
Small
1000
–
12.76
5.53
12.15
30.99
9.82
15.52
Medium
58,000
180
9.97
4.74
12.18
34.05
9.46
17.99
Large
600,000
1500
9.83
3.62
12.18
34.11
9.46
16.90
Industrial
Small
5000
–
10.07
5.53
8.05
33.49
7.83
8.71
Medium
65,000
180
9.97
4.63
10.51
34.06
7.39
11.30
Large
270,000
600
9.84
3.54
11.48
34.10
6.65
10.86
Very Large
1,050,000
2250
9.83
3.52
11.48
34.11
6.31
10.85
Fig. 5
Comparison of average electricity price for household customers in South Asian countries
Pricing mechanism
In the context of the current discussion, the following two objectives among others given in [
25
] are relevant and important:
(i) to promote a safe and reliable supply of electricity throughout the country (leading to increased energy security), and
(ii) to promote development of renewable energy resources.
It has been established that a well-designed FiT scheme offer multiple benefits to all stakeholders as the tariff can be both cost-effective and cost-efficient. However, in a RE-rich market with subsidised electricity prices, designing an effective FiT scheme will demand careful analysis and planning. Additionally, once these subsidies are withdrawn, private players may see promising prospects while the general population may end up paying an increased tariff. Further, the introduction of a FiT without careful analysis may drive the existing electricity tariff to rise considerably. This may put economic pressure on the general mass, while only a handful of private participants operating as GenCos may benefit financially. Currently, there is a lack of standard for private sectors to participate in RE generation and the rate of subsidy provided by the government makes it difficult for private individuals and business entities to participate in RE business in Bhutan. This also poses one of the biggest challenges in implementing a FiT policy, aggravated by the lack of adequate grid infrastructure to support such schemes. As the overall design of FiT scheme is also influenced by the market design and the availability of resources, the FiT scheme may not allow an effective market integration of RE. FiT in a non-liberalised, monopolised electricity market is not encouraging, perhaps only when there are adequate number of private participations. Further, as recommended by [26], FiT policies must be kept transparent, less complex and consider local conditions such as RES-E potential.
This work proposes FiT scheme taking into consideration the following factors:
(i) Energy is almost entirely hydropower based.
(ii) Subsidy is provided by the government that results in a lower tariff for end-users.
(iii) Lack of private participation and knowledge of the benefits of investing in RES.
Globally, favourable policies such as FiTs, renewable portfolio standards, tenders, and tax incentives have contributed to the growth in RES-E although these were aimed at overcoming initial barrier to the development of RES-E when compared to the costs related to conventional sources of generation [
27
]. Further, increase in the RES-E penetration could impact electricity prices and consequently, the revenue opportunities for RES-E plants. It will be a challenge to maintain rapid RES-E supply growth against decreasing costs and technical and market operation challenges associated with high penetration levels of RES-E [
27
]. In the case of Bhutan, where such initiatives are yet to take place, modifications in the FiTs will have to be made to address the required needs of the investors and the government in future.
The levelised cost of energy (LCOE), which serves as a cost indicator for various RE technologies has an influence on the design of pricing strategies for RES-E. LCOE will continue to decrease for solar PV and wind power, while for hydropower, it will increase, primarily due to inflation and labour cost [
28
,
29
–
30
]. Therefore, it is more viable to opt for non-hydro RES-E, especially solar PV.
In terms of evolution in the incentive schemes, [31] gives a historical perspective of the introduction of the Grid Feed-in Law in 1990 in Germany, which was replaced by the Renewable Energy Sources Act (EEG 2000) based FiT scheme in 2000. They further give the underlying reasons for moving from fixed FiT scheme to auctions since 2016, although exceptions have been made for smaller-sized installations of less than 750 kW where these installations continue to receive FiTs. In Germany, solar PV investors between 300 to 750 kW are provided with the following two options [32]:
(i) Tender scheme for utility scale PV without self-consumption, and
(ii) FiT, halved compared to smaller systems, allowing self-consumption is allowed.
For the existing market in Bhutan, subsidy provided by the government is based on ‘blocks’ of consumers. Currently, there are no grid regulations and no incentives for private participants. Therefore, to determine FiT for effective implementation, the following components of the FiT pricing as per the traditional definition of FiT will need to be considered:
(i) Generation tariff – where the generator is paid for every kWh of electricity generated.
(ii) Export tariff – where the generator is paid for every kWh injected into the grid.
(iii) Rate of own usage – rate at which deficit energy is bought from the grid.
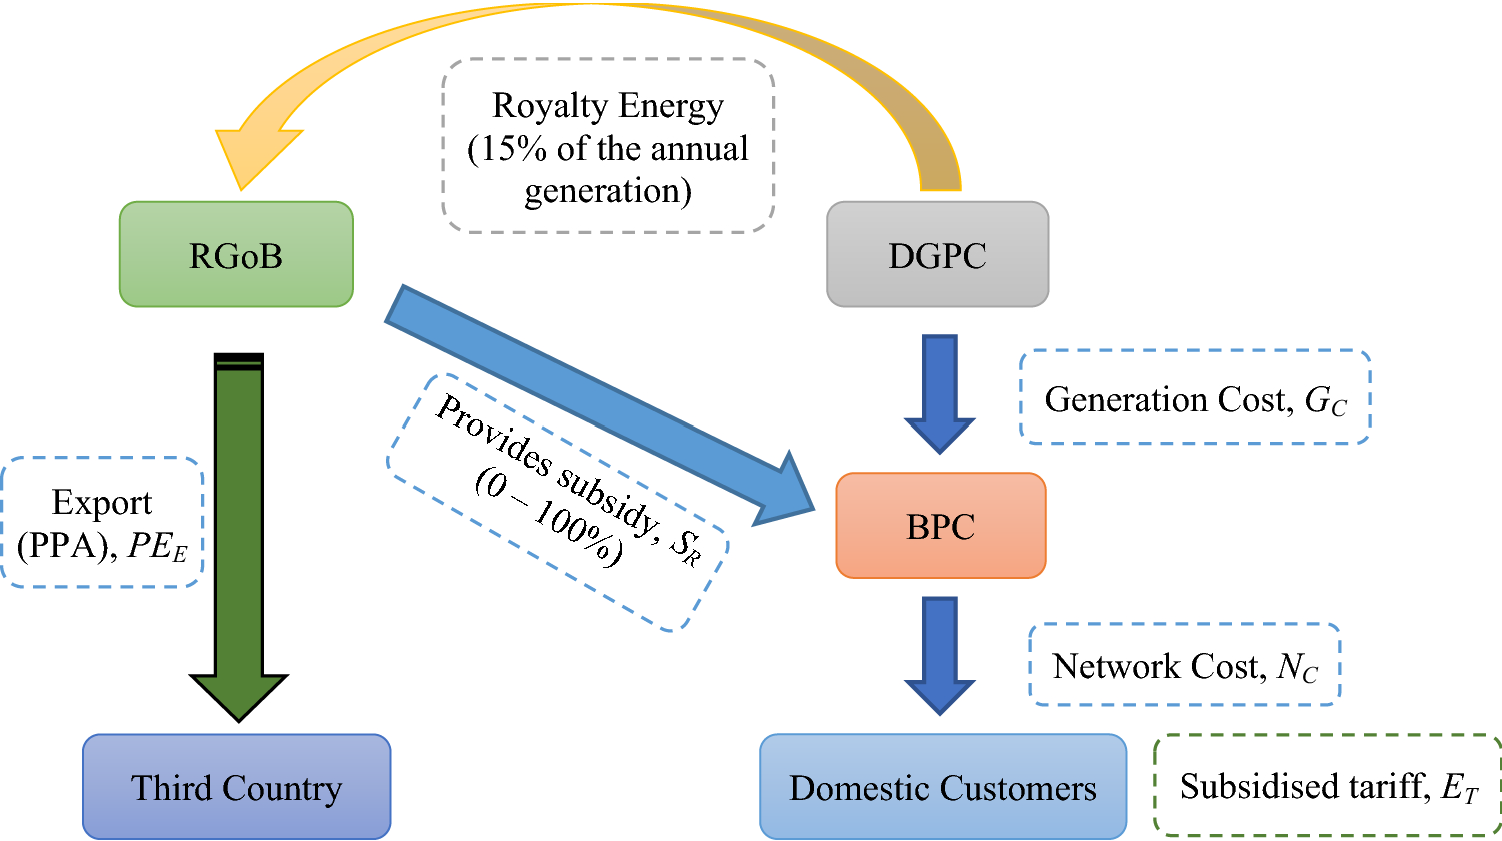
The existing pricing modality in Bhutan is shown in Fig.
6
. Customers pay subsidised electricity tariff
ET
and the rate at which power is exported to the third country
PEE
is based on the power purchase agreement (PPA) signed with the third country. In absence of fossil-fuelled energy sources in the country, and the existence of a well-established energy sector with hydropower as the primary source, support for other forms of RE is not well pronounced. Further, as per the energy policy, there is a cap of 25 MW of total generation from non-hydro RES-E by 2025. Therefore, based on the prioritised non-hydro RES-E in [
8
], a suitable FiT scheme needs to be designed for solar power and wind power.
Fig. 6
Existing pricing mechanism
While designing the scheme, it must be noted that the non-hydro RES-E investors do not suffer any losses. FiT is based on several economic and cost aspects, including LCOE for various RE technologies. The LCOE of residential PV systems in 2019 was between 0.063 USD/kWh and 0.265 USD/kWh [
33
]. India and China had the lowest country/market average LCOE for commercial PV up to 500 kW. Further, for onshore wind, the global weighted-average LCOE in 2019 was 0.053 USD/kWh. The most competitive weighted average LCOE below 0.050 USD/kWh was observed in India and China and the LCOE is expected to further reduce [
33
].
While information on LCOE for different RE technologies in Bhutan would be ideal for this study, reliable information and data is not available. Therefore, data from India, 0.063 USD/kWh is used instead, owing to the proximity, and having a similar market scenario. The average residential load is assumed to be 5 kW.
To assess LCOE since it has an influence on the pricing strategy, LCOE in select countries have been reviewed. Table
5
shows the LCOE for residential solar PV and onshore wind power in various countries. Further, the lifetime of solar PV is between 20 and 35 years [
33
]. Therefore, it is safe to assume the project lifetime
n
of solar PV to be 25 years in the current work. For wind power plants, [
34
] has concluded that the useful life of wind power plant has changed over time and today it stands at an average of 30 years.
Table 5
LCOE (USD/kWh) for residential solar PV & onshore wind power in various countries in 2019 [
33
]
RES-E
India
Japan
China
USA
Germany
Wind
USD/ kWh
0.049
0.113
0.047
0.046
0.068
PV
0.063
0.163
0.067
0.171
0.138
An investor or a homeowner will only opt for non-hydro RES-E if it offers an undue advantage over that from the grid. If
TCRES-E
is the total cost in its lifetime
n
with electricity from non-hydro RES-E and
TCgrid
is the total earnings in its lifetime
n
with energy into the grid, the following preliminary condition for an investor to invest in RES-E must be satisfied:
TCRES-E<TCgrid
The total costs
TCRES-E
and
TCgrid
are given by,
TCRES-E=nEgLCOETCgrid=nmEiET1+rn-1
where
Eg
is the total energy generation in
n
number of years and
m
is the number of months in a year,
Ei
is the kWh injected into the grid, and
ET
is the retail LV tariff with an annual increase
r
at 1.8% per year as indicated in Fig.
4
. The simplest forms of determining the total costs are considered in Eq. (
3
) and it does not account for taxes, discount rates and other associated costs pertaining to Bhutan.
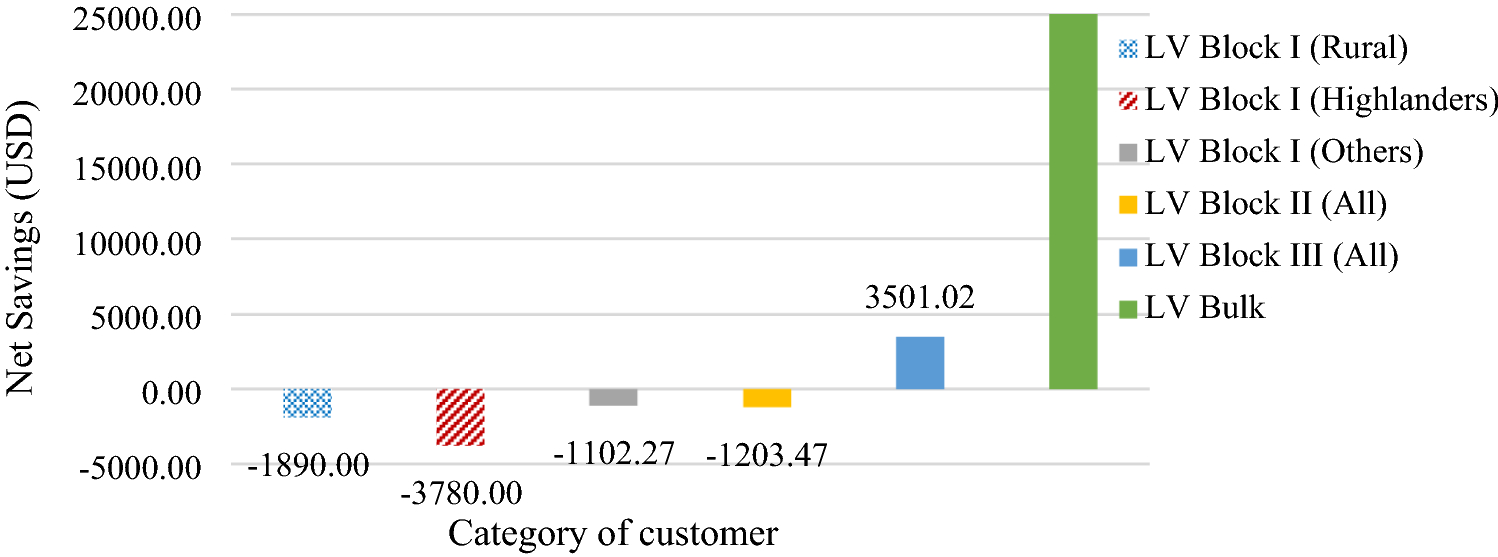
Results
Considering the current market scenario, it is proposed that the FiT is pegged with the block-wise subsidy to enable each category of customer to make net savings for injecting equivalent kWh into the grid. FiT is computed based on the maximum subsidy
SR_max
and electricity tariff
ET
for each category of LV customer. As a sample, FiT for LV Block-I (others)
FiTLVB1_o
is fixed as given below:
FiTLVB1_o=SR_max-ET_LVB1_0
FiTLVB1_o=5.81-1.28=4.53Nu./kWh=0.0606USD/kWh
, and LCOE is 0.063 USD/kWh. The proposed FiTs with net savings that each category of customer/investor can make, considering a plant life of 25 years with 1.8% annual increase in the retail tariff have been computed and shown in Table
6
.
Table 6
Comparison of costs and the proposed FiT
Category of Customer
kWh injected into grid/ month, Ei
Retail electricity tariff, ET
Proposed FiT (USD/kWh)
Total earnings from grid, TCgrid (USD)
Total cost for RES-E, TCRES-E (USD)
Net savings (USD/kWh)
LV Block I (Rural)
100
0.0000
0.0777
0
1890
−1890
LV Block I (Highlanders)
200
0.0000
0.0777
0
3780
−3780
LV Block I (Others)
100
0.0171
0.0606
788
1890
−1102
LV Block II (All)
500
0.0358
0.0418
8247
9450
−1203
LV Block III* (All)
1000
0.0487
0.0290
22,401
18,900
3501
LV Bulk*
5000
0.0553
0.0223
127,390
94,500
32,890
The preliminary condition for an investor to opt for non-hydro RES-E based on Eq. (
2
) is shown in Fig.
7
.
Fig. 7
Condition for investors to opt for RES-E
The following conclusions can be drawn from Table
6
and Fig.
7
:
The proposed FiT will not be effective for LV customers in rural, highland areas, Block I (others) and Block II (all) as they receive subsidies of 0.0777, 0.0777, 0.0606 and 0.0418 USD/kWh respectively.
Only LV Block III and LV Bulk customers with net injection of 500 and 1000 kWh per month respectively will be able to make savings if they opt for RES-E (solar PV). The proposed FiTs are 0.0290 and 0.0223 USD/kWh respectively, when export tariff component is pegged with the subsidy.
To encourage maximum number of participants in the RE market, a generation tariff pegged with the lowest tariff (0.0171 USD/kWh) can also be provided in addition to the export tariff. This will result in a higher net savings for all categories of LV customers, including rural and highlanders.
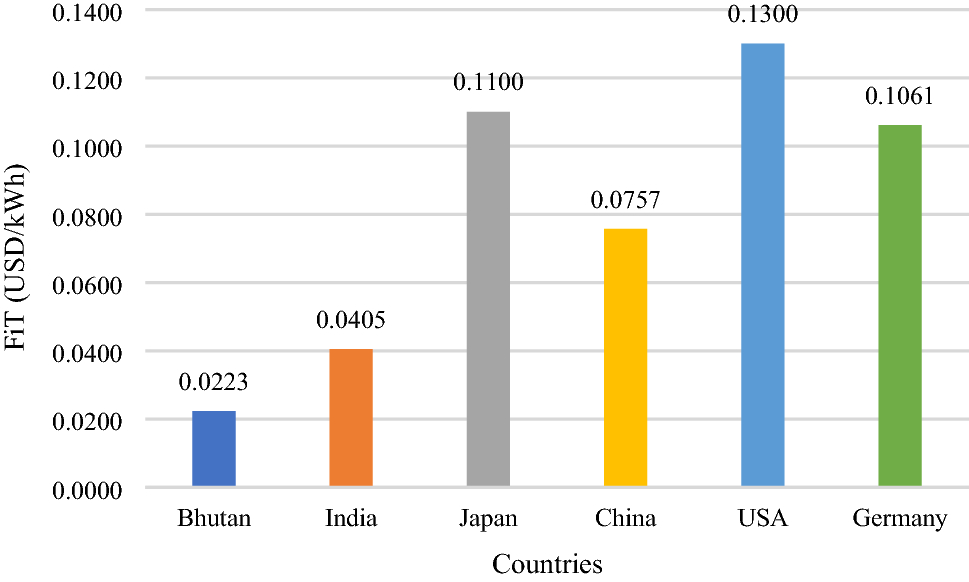
Further, FiTs for different countries in the region and other areas where it has gained significant success are shown in Table
7
for the purpose of drawing comparison with the proposed FiT.
For the purpose of drawing comparison between the proposed FiT and the FiTs given in Table
7
, the lowest values of FiTs in these respective countries are considered. The comparative analysis is drawn and shown in Fig.
8
. From the comparative analysis, it can be concluded that the proposed FiT in Bhutan remains the lowest for all categories of customers, as it is pegged with the rate of subsidy provided by the government. This will not be encouraging for the private investors who wish to participate in FiT scheme in Bhutan, and therefore, a more rigorous scheme will have to be instituted to encourage private investors.
Fig. 8
Proposed FiT and FiTs in countries where it has been successfully implemented
To encourage private participants to invest in non-hydro RES-E in a country with high ratio of RE (hydropower) and to achieve reasonable return on investment, the following recommendations are made:
For a system with block rate tariff, FiTs can be fixed based on the ‘blocks’ of kWh injected into the grid.
Export tariff component of FiT can be pegged with the block rate tariff. LV customers will continue to draw benefits for their investment in non-hydro RES-E. Any sale of electricity after
n
years can be considered as ‘profit.’
The generation tariff (FiT) can be pegged to the lowest subsidy rate. However, for the government to make marginal profit, the FiT remains lower or equal to the power export tariff (
PEE
) based on the power purchase agreement, which may also include framework for future bilateral cooperation in the field of energy between two nations.
In place of ‘generation tariff,’ a tax credit can also be provided. As the percentage of non-hydro RES-E installation is going to be minimal due to the 25 MW cap on the installation of RES-E, this will not have any major financial constraints on the government. This strategy will encourage a greater number of participants.
The above analysis pertains to a rooftop solar PV, however, LCOE is technology-based and to make the proposal generic, pricing modality is proposed as shown in Table
8
for both wind and solar PV for a period of 25 years.
Table 8
Proposal for FiT scheme
Option
FiT
Benefit to the investor/generator
Benefit to the government
A
Generation tariff+Export tariff
Yes
Yes
B
Export tariff
Yes, but only to higher category of customers
Yes, more than Option A
It must be noted that the retail tariff as well as the power export tariff keeps varying based on the market scenario and PPA, respectively. These variations must be taken into consideration while designing FiT so that the government nor the investor incurs loss. Although many RE-matured countries like United Kingdom and Germany are moving towards tendering scheme, for Bhutan, where there is lack of i) deregulated market ii) RE pricing modality, and iii) private participants, the pricing modality can be initiated with FiT scheme as proposed. With experience and increase in the number of participants, the following alternatives as shown in Table
9
can be proposed in place of FiT.
Table 9
Alternatives to FiT scheme
1. Net-metering
There is no time-bound obligation or project time-period
Additional design complications, such as those related to block rate tariff, project cost, LCOE will be minimised
Allows investors to sell or use the units generated at any time without a specific contract
2. Auction
As the bid is evaluated by the government, it offers flexibility to make appropriate decisions
Creates a competitive electricity market
Limitations and future work
The proposed schemes are based on a simplified method where assumptions are made on the LCOE of the two variable renewable energy (VRE) sources due to lack of data specific to Bhutan. Recommendations made in this paper would serve as a guideline for decision making, planning, and instituting a more robust system to introduce RE policy for non-hydro RES-E. As it would be a challenge to introduce an RE policy in Bhutan primarily due to the source of electricity being hydropower and generous subsidies provided by the government, it would necessitate the cooperation of all players: MoEA, BEA and DHI (BPC & DGPC) to work on a suitable RE policy. One of the immediate research works would be to determine LCOE for various RE technologies in Bhutan, in particular wind power and solar PV. Thereafter, we draw comparisons on different RE policies suitable for Bhutan’s unique energy market on the basis of LCOE and subsidies provided by the government.
Conclusion
In a market with high share of RE, promotion and investment in additional RES-E is seen as a challenge. With the increase in the share of RE installations globally, several countries have started moving away from the traditional FiT scheme into tendering and other revised schemes. In the case of Bhutan, it is a challenge to promote and invest in non-hydro RES-E since the electricity tariff is the lowest in the South Asian region. However, apart from the financial aspects, there is a need to consider energy security and related challenges, such as dependency on a single source of energy in the country. Therefore, as Bhutan gradually begins diversifying its energy resources, suitable RE policy will need to be instituted.
Two RE technologies, solar power and wind power are considered in this paper. FiT for solar power has been computed and proposed for different blocks of customers. The analysis indicates that LV Block I customers would not benefit from the FiT scheme as they receive subsidies ranging from 0.0418 to 0.0777 USD/kWh/month. Only two categories of customers, LV Block III and LV Bulk, are able to make savings if they opt for the FiT scheme of 0.0290 and 0.0223 USD/kWh respectively. Further, two favourable alternatives, (i) net-metering and (ii) auction have been proposed. However, these recommendations are subject to change based on the market scenario and the government policies. A more robust RE policy will need to be instituted to benefit all players.
Publisher's Note
Springer Nature remains neutral with regard to jurisdictional claims in published maps and institutional affiliations.
References
Unknown ()
Unknown ()
Unknown ()
Unknown ()
Unknown ()
Unknown ()
Couture and Gagnon (2010) An analysis of feed-in tariff remuneration models: implications for renewable energy investment (pp. 955-965) 10.1016/j.enpol.2009.10.047
Unknown ()
Unknown ()
Unknown ()
Unknown ()
Unknown ()
Ndiritu and Engola (2020) The effectiveness of feed-in-tariff policy in promoting power generation from renewable energy in Kenya (pp. 593-605) 10.1016/j.renene.2020.07.082
Wang and Cheng (2012) The evolution of feed-in tariff policy in Taiwan (pp. 130-133) 10.1016/j.esr.2012.05.002
Unknown ()
Unknown ()
Unknown ()
Yangka et al. (2019) Carbon neutral policy in action: the case of Bhutan (pp. 672-687) 10.1080/14693062.2018.1551187
Unknown ()
Unknown ()
Unknown ()
Unknown ()
Unknown ()
Unknown ()
Unknown ()
Unknown ()
Yao et al. (2021) Untangling global levelised cost of electricity based on multi-factor learning curve for renewable energy: wind, solar, geothermal, hydropower and bioenergy10.1016/j.jclepro.2020.124827
Ram (2018) A comparative analysis of electricity generation costs from renewable, fossil fuel and nuclear sources in G20 countries for the period 2015–2030 (pp. 687-704) 10.1016/j.jclepro.2018.07.159
Jung et al. (2018) A scenario analysis of solar photovoltaic grid parity in the Maldives: the Case of Malahini Resort10.3390/su10114045
Leiren and Reimer (2018) Historical institutionalist perspective on the shift from feed-in tariffs towards auctioning in German renewable energy policy (pp. 33-40) 10.1016/j.erss.2018.05.022
Unknown ()
Unknown ()
Unknown ()
Unknown ()
Unknown ()
Dong et al. (2021) Rushing for subsidies: the impact of feed-in tariffs on solar photovoltaic capacity development in China10.1016/j.apenergy.2020.116007
Unknown ()
Winter and Schlesewsky (2019) The German feed-in tariff revisited: an empirical investigation on its distributional effects (pp. 344-356) 10.1016/j.enpol.2019.05.043