Centre for Renewable Energy Systems Technology, Loughborough University, Loughborough, GB
Abstract
This paper aims to determine the economic and technical feasibility of developing a thermally enhanced digester in the Andean area using solar collectors. Communities in the rural area of the Andes lack access to electricity and other basic services which impact negatively on their everyday life and exposes them to harmful and inefficient fuels. Several experiences with anaerobic digestion prove that this technology could be applied in the Andean area, although its performance is limited due to low temperatures. To overcome this constraint, an enhanced digester was modelled and simulated using TRNSYS Software. The system consisted of two solar collectors, a storage tank and a digester with a wrapped-around heat exchanger. The average digester temperature in the simulation was 30.7 °C. The enhanced temperature was used in a model to calculate the daily biogas production. The Net Present Value and Internal Rate of Return were calculated and confirm the economic viability of the project. The biogas production fully covers the requirements of the system for household cooking and lighting, making a significant social impact. This simulation indicates that it is technically possible to develop an enhanced digester in the Andean area that is economically viable as well.
Introduction
Communities in the Andean area of Peru are located at high altitude and, because of the difficult geography and remoteness, many of them do not have access to electricity from the national grid. In the Andes 92% of the rural population uses manure, agricultural waste or wood as fuel for cooking [
1
]. These fuels have low efficiency and their use generates indoor pollutants that can cause illnesses to people [
2
]. These also generate greenhouse gas emissions that contribute to climate change.
To overcome this, it is necessary to expand the national grid into rural areas, which is an important objective for many developing countries, including Peru (Sustainable Development Goal N° 7, United Nations). Nevertheless, factors like remoteness, tough geography, and the low demand of rural households makes this very difficult to achieve. The economic activities of families in the rural area are mainly agriculture and livestock which makes anaerobic digestion an ideal technology since they provide the necessary feedstock for this technology. It is important however, to analyse other technical factors that are necessary for anaerobic digestion. The Andean area is characterized for its high altitude and low temperatures, two factors that are very important for the performance of a biodigester and thus, the biogas production. The major cities in the Andes are located from 2000 to up to 4380 m above sea level [
3
] and the weather can vary from − 15 °C in the coldest month to 25 °C in the warmest one [
4
]. This means that the two constraints to develop anaerobic digesters in this area are the altitude and the temperature. However, while the temperature effect has been reported by many researchers [
7
,
8
,
9
,
10
,
11
,
12
,
13
–
14
], the effect of the pressure (altitude) was found not to significantly affect the production of biogas or the methane content in the Andean area [
5
].
The biogas production from anaerobic digesters in the Andean area is low (around 0.04–0.47
m3/m3digester∗day
) due to the low temperatures and, therefore, does not fully meet the households requirements for cooking [
6
]. This means that, in order to have a useful production, it is necessary to overcome the temperature constraint. Thus, enhancing production would make a great difference for these communities. They could solely rely on the biogas for cooking, which would improve their health, or use it for electricity generation which could give them access to educational resources and communication services, to potentially improve their life quality. An increase in agricultural production, due to the by-product organic fertilizer, could also mean an economic benefit.
If mesophilic 20 °C < T < 45 °C or thermophilic 50 °C < T < 65 °C conditions can be reached the process will see higher biogas yields from anaerobic digestion [
7
]. However, psychrophilic conditions T < 20 °C such as those found in the Andes result in lower biogas production because of the linear relationship between methane yield and temperature [
8
]. A higher temperature inside the digester could increase the production of biogas and the methane yield. Studies using cow manure show a four times increase of biogas production when rising the digester temperature from
11
°C to 35 °C [
5
]. Other studies [
8
,
9
] show that the digestion process responds immediately to the temperature increase which suggests the bacteria activity is preserved during the low temperature period. However, 97% of the total biogas production occurs during a higher temperature (e.g. 25 °C) period [
9
], thus making the production during low temperature insignificant. This also suggests that the temperature inside the digester should be kept stable or at least between narrow limits. One of the advantages of the thermophilic process is the higher rate of digestion and shorter HRT, however, process stability is reduced [
10
]. On the other hand, methane production is enhanced 25% in the mesophilic process which, along with the lower temperature (and energy) required, make the mesophilic process the most appropriate to use.
Thermally enhanced digesters can be achieved using heated chambers (at laboratory scale) [
11
], through water jackets [
10
], using greenhouses [
12
], or immersed heat exchangers [
13
]. For this project, a small-scale digester with a water jacket was modelled using solar collectors to heat the water going in the wrapped-around heat exchanger of the water jacket. The aim of this project was to determine the viability of developing an enhanced anaerobic digestor using solar collectors in the Andean area of Peru and assess the socio-economic impacts. In order to achieve this, the first stage was to identify and assess the technical resources for anaerobic digestion in the Andean regions and select an optimal system to develop this project. This required consideration of the environmental conditions, and the suitable renewable energy and feedstock resources that would be available. The next step was to design a solar collector system that can provide enough energy, all year round, to maintain the digester at mesophilic conditions and model the predicted biogas and methane yields for the process. In addition to the technical aspects, in order for the project to be successful it was necessary to calculate the socio-economic impacts of implementing the enhanced digester as appraise the most sensitive variables that could affect the viability of the digester.
To identify an optimal region in the Andean area of Peru, a literature review was conducted. Government censuses and national reports were analysed in order to locate a region with a significant part of the population involved in agriculture and livestock activities. This would ensure the necessary feedstock to develop the technology. The region should also lack or have limited access to electricity as well as difficult or no access to fuels like diesel, gasoline or gas. This way biogas could be seen as an opportunity and ideally be welcomed by the people. The presence of agriculture was also important because the fertilizer could be allocated within the same region.
Methodology
Locating the region of the study
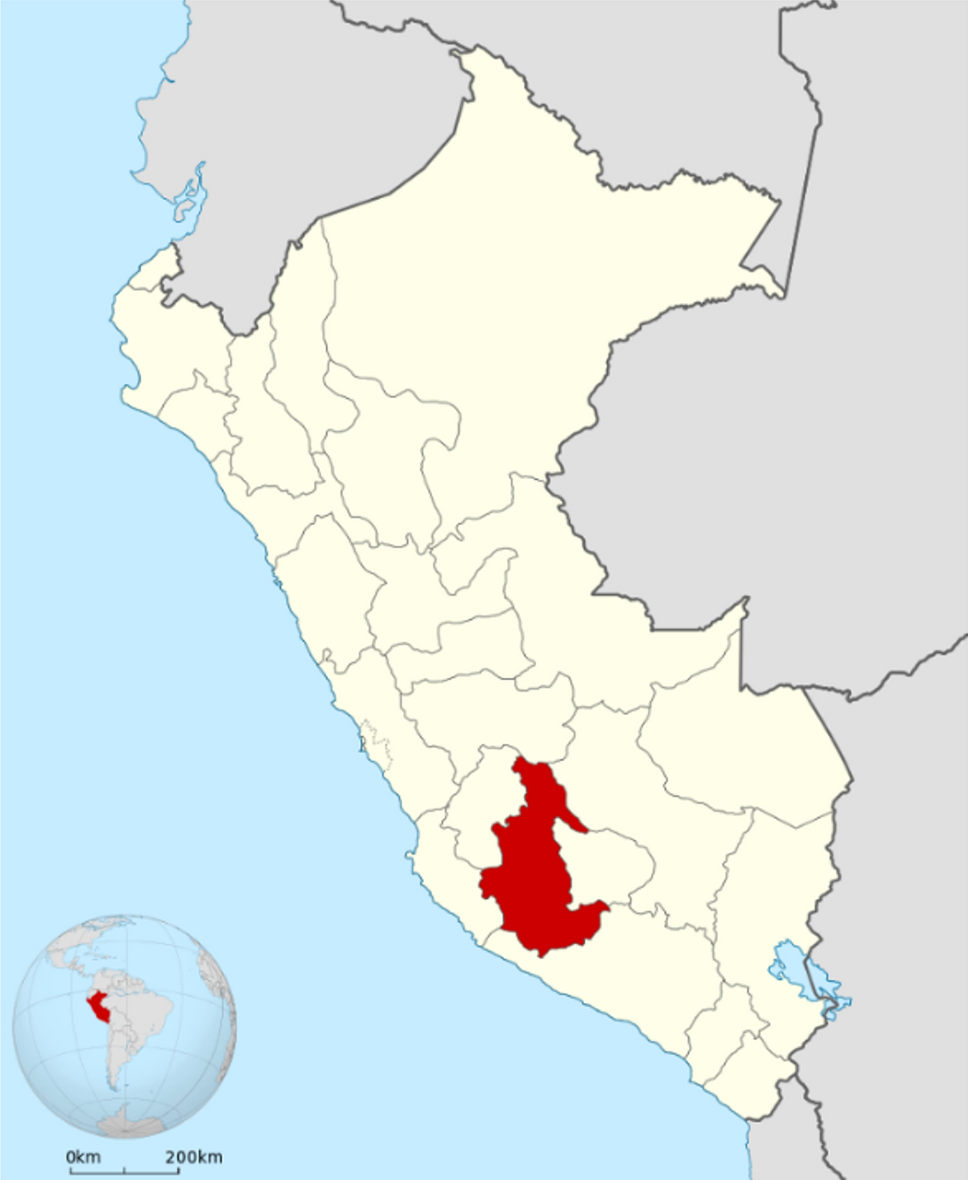
The region selected following the review was Ayacucho. This area is located in the Andean part of Peru, also called the “Sierra”, see Fig.
1
. It consists of 11 provinces and has a population of 616,176 people, of which 45% live in rural areas [
14
]. Ayacucho is one of the three poorest regions in Peru with poverty focused mainly in the rural area where 9 of 10 homes are poor and 43% of households are not connected to the national grid [
14
]. The effect of these factors can be seen in in the educational level of the rural areas, where 47% of the population only have primary education, 22% are illiterate and there is a high rate of absenteeism (because children have to participate in home activities) [
15
]. Another consequence of this is the Fertility Rate, which is 3 times higher for women in the rural areas [
14
].
Fig. 1
Location of the study area Ayacucho, Peru
Ayacucho is also known for its agriculture and livestock activities which represent 23% of the regional GDP [
14
] and 20% of the population is involved in them [
3
]. In this region, each family is considered a production unit (for agriculture and/or livestock), the crops are mainly destined for self-consumption or livestock feeding, furthermore, 75% of the cattle units are small sized (from 1 to 9 animals) [
15
]. This makes small-scale anaerobic digestion a potential and accessible technology to produce clean energy in the rural areas of Ayacucho to avoid the consumption of harmful fuels. The cattle would provide the necessary feedstock for the process and the fertilizer, obtained as a by-product, could improve the production from agriculture. The detail of all this information can be found in Appendix 1.
Designing the digester
In Ayacucho, 51% of the livestock is dairy cattle, which is why it was selected as the feedstock for the digester. For the type of digester to use, another literature review specific for the Andean area was conducted. There are different types of digesters used around the world but the most common ones in the Andean area are the fixed dome and the tubular digester. Fixed dome digesters have a high investment cost, require specialized labour for construction and the materials are not always available in the rural areas [
16
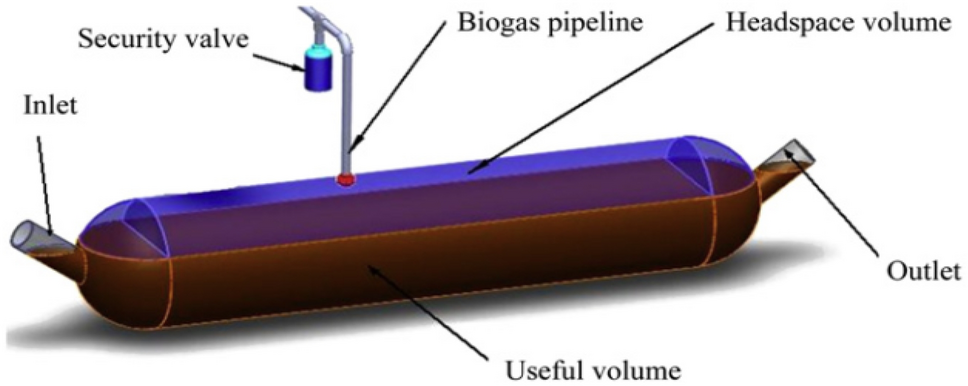
]. The tubular digester was adapted from the Taiwanese model and consists of a tubular bag that can be either plastic or a geomembrane. In the Andes it is preferred because of the lower investment costs, ease of installation and maintenance. The material is PVC since it is more resistant and can be repaired in case of small ruptures, see Fig.
2
. The size of the tubular digesters can vary but, generally, in poor rural areas with self-consumed agriculture and family farming, the volume is around 6–10 m
3
[
16
]. Considering this, it was decided that an 8m
3
tubular digester was going to be used for this project. The Hydraulic Retention Time (HRT), Organic Loading Rate (OLR) and daily feed were calculated according to the process design presented by [
17
].
Fig. 2
Schematic diagram of a low-cost plastic tubular digester [
8
]
Calculating the solar resource
Meteonorm Software was used to calculate the irradiation and temperatures in Ayacucho. This software uses weather stations and satellite data. The data provided from national weather services must fulfil the quality criteria of the World Meteorological Organisation (WMO) and Meteonorm calculates hourly values of all parameters using a stochastic model [
18
] and generates a “typical year” as output. This software was selected because of the sophisticated interpolation models which allow a reliable calculation of parameters at any site in the world with low uncertainty values. The limitation found was that Ayacucho does not have a weather station in Meteonorm’s network, so the temperature had to be interpolated from data of nearby regions. Despite this, the output temperature was compared to up to date information from local weather stations [
4
] and no significant difference was found (± 1.5 °C).
Using TRNSYS to build a simulation of the enhanced digester and the temperature output
TRNSYS Software was used due to its modelling capacity, which makes it easy to build a new project and establish connections between components. Several studies have used this software [
13
,
19
,
20
] because it allows a dynamic simulation with input parameters changing over time as well as outputs. This is necessary for this project since the temperature variation is the most important input and output. In addition, are the tabular and graphic outputs from the program which allows for fast and comprehensive visualization of the results while also allowing access to the raw data to generate new tables or graphs. The components used for this simulation are listed in Table
1
.
Table 1
Components used for the TRNSYS simulation
Components used
Explanation
Weather data reader
The TMY2 format was used so the Meteonorm data could be read correctly
Quadratic efficiency collector
This type allows for the user to input the efficiency parameters according to the specification sheet of the collector
Storage tank
Allows to model thermal stratification and adjust the inlet’s positions which was necessary for this model. It also allows different flowrates
Pump to solar collector and controller
This pump is connected to a controller which activates it every time the water in the storage tank goes below 40 °C and needs to be heated in the collector again
Pump to water jacket and controller 2
This pump moves the water to the heat exchanger at a flow rate that allows a turbulent flow. Another controller is connected to stop the flow in case the temperature inside the digester goes above 41 °C
Digester with water jacket
This type models a cylindrical tank with a wrapped around heat exchanger. All the characteristics of the fluid inside the tank and inside the digester can be changed by the user which was necessary for the manure
Load profile
Since the flowrate of the manure is not continuous throughout the day but only for a few hours a day, this load profile is necessary to model the right quantities of the inlet manure
All the parameters and input values of each component of the system were selected or calculated based on a thorough literature review, the details of these can be seen in Appendix 2. The number of solar collectors and size of the storage tank were selected through an iterative simulation process to select the most efficient considering the available space in Andean households and the economical aspect of each component. Two flat plate collectors of 2 m
2
placed in series and a storage tank of 1 m
3
were the optimal sizes to reach a mesophilic temperature.
Developing a numerical model to predict the performance of the enhanced digester
In order to determine the biogas production according to the new conditions created through the simulation, it was necessary to characterize the anaerobic digestion process. This was done by reviewing and comparing different papers, experiences and existing models [
7
,
20
,
21
,
22
,
23
,
24
–
25
]. From this it was noted that the majority of models in the literature review use the base equation developed by Chen and Hashimoto [
22
], to design digesters using the ultimate methane yield of the manure:
B=Bo1-K(μmθ)-1+K
B
= Methane yield
m3CH4/kg VS
.
Bo
= Ultimate methane yield (
B
at infinite
θ
)
m3CH4/kg VS
.
θ
= Hydraulic Retention Time (days),
μm
= Maximum specific growth rate of microorganisms (
day-1
),
K
= kinetic parameter.
This equation uses the ultimate methane yield (
Bo
), which will depend on the animal diet [
26
], the kinetic parameter (
K
), which will vary according to the content of volatile solids to digest, the maximum specific growth rate of microorganisms (
μm)
, which will be temperature dependant and the Hydraulic Retention Time (HRT or
θ
). To calculate the kinetic parameter, the equation by Hashimoto [
23
], specific for cattle manure was used.
K=0.8+0.0016e0.06So
In which
So
is the total content of volatile solids going inside the digester during the HRT. To calculate the maximum specific growth of microorganisms, the following equation by Chen and Hashimoto [
22
] was used.
μm=0.013T∘C-0.129
To determine the appropriate Organic Loading Rate (OLR) for the digester with an improved temperature, the equation presented by Safley and Westerman [
7
] was used. This equation considers the same HRT for different OLR:
LR2/LR1=epT2-T1
where
LR1
and
LR2
are the loading rates (
kgVS/m3∗day
),
T1
and
T2
are the temperatures (°C),
p=0.1
is the rate constant (
∘C-1
) and VS are volatile solids.
Using the tabulated results from TRNSYS and exporting them to Excel, Eqs.
2
and
3
were used to calculate the key parameters and Eq.
1
to determine the biogas production, using the daily average temperature and the HRT and OLR defined during the digester design. The daily methane production for a year was calculated and compared to the production of other psychrophilic digesters in the Andean area. A limitation for this was that not all studies used the same units to express the performance of the digester, which can be confusing. It is important to mention that a 6 m
3
volume was considered for the production, although an 8 m
3
digester was used because is necessary to leave at least 20% of space for the biogas, thus 25% head space was left.
Statistical analysis was also conducted using the software IBM SPSS Statistics to confirm if the variables used in the model were statistically significant for the biogas production. Correlation analysis was performed between the local radiation, the temperature in the storage tank, the digester temperature and the biogas production. A linear regression analysis was also executed to determine if a linear relation existed between the digester temperature and the biogas production.
Calculating the economic and social impact of the enhanced digester
A cost–benefit analysis was conducted to determine if the enhanced digester would have a positive and significant economic impact. Local vendors were contacted to obtain costs of materials and other studies from the Andean area were also consulted to obtain costs. Using Microsoft Excel, the Net Present Value (NPV) of the project and the Internal Rate of Return (IRR) were calculated to determine the economic viability. The social impacts of the enhanced production were determined by the potential uses for the biogas production. Each month the production of biogas was compared to the amount needed for basic activities and services.
Performing a risk analysis for the proposed model
A sensitivity analysis using the “What-if” tool in Excel was conducted to determine which variables have the highest impact in the viability of this project. Since the economic parameters were already analysed in the previous section, this analysis focused on the impact of technical parameters in the biogas production. Key parameters such as the
Bo
,
So
, HRT and digester temperature were evaluated by changing the values ± 50% in steps of 10%.
Results and discussion
Digester design
The digester size is 8 m
3
with a useful volume of 6 m
3
to allow 25% of space for the biogas build-up [
27
]. Using Eq.
4
and comparing it to other digesters [
6
] it was found that the OLR should be around
3.8
kg/VS/m
3
.day. Using this value as a starting point, other characteristics were calculated, which are listed in Table
2
.
Table 2
Digester characteristics
Digester characteristics
Value
Units
Useful capacity
6
m3
OLR
4
kgVS/m3.day
HRT
20
days
Influent
80
kgVS/m3
Daily feed
0.3
m3/day
According to [
17
], the HRT and OLR values are within range for an optimal mesophilic digester. A smaller HRT could increase the daily biogas production but would compromise the stability of the digester [
28
]. The OLR was also adequate to maintain a stable digestion and avoid stress inside the digester [
23
].
A 1:3 dilution is necessary and recommended [
27
] when using cow manure to avoid clot formation inside the digester. The amount of cow manure necessary for the daily feed can vary depending on the quality, which will determine the percentage of total and volatile solids. Different types of manure [
5
,
6
,
8
,
9
] were compared and, according to the production of each animal [
29
], it was calculated that between 5 to 18 animals are needed to achieve the amount of manure necessary for the daily feed. This means that the digester could be fed with the production from one unit/family or (in the worst case) by two, depending on the number of cattle.
Solar resource
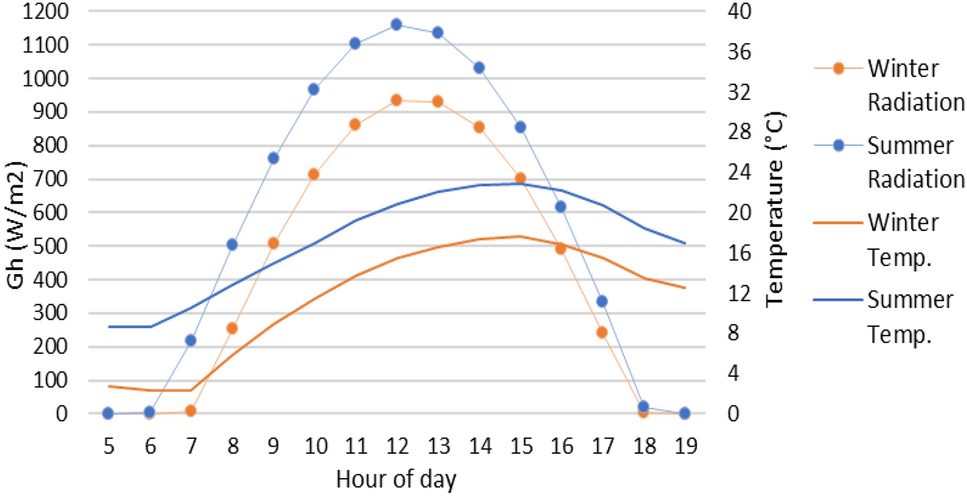
The summer in Ayacucho occurs during November, December, January and February which are also the months of rain. The coldest day occurs in mid-July with 0.35 °C and the warmest in December with 23.6 °C. As seen in Fig.
3
, there is a good solar resource in summer and winter which is not unexpected given the low latitude of the region. The diffuse radiation increases during the summer because of the rain. The average temperature variation within one day is 11 °C. This means that the heat provided by the water jacket needs to be enough to reduce this variation inside the digester, so the biogas production does not get affected.
Fig. 3
Typical summer and winter day solar and temperature conditions in Ayacucho [
18
]
TRNSYS simulation
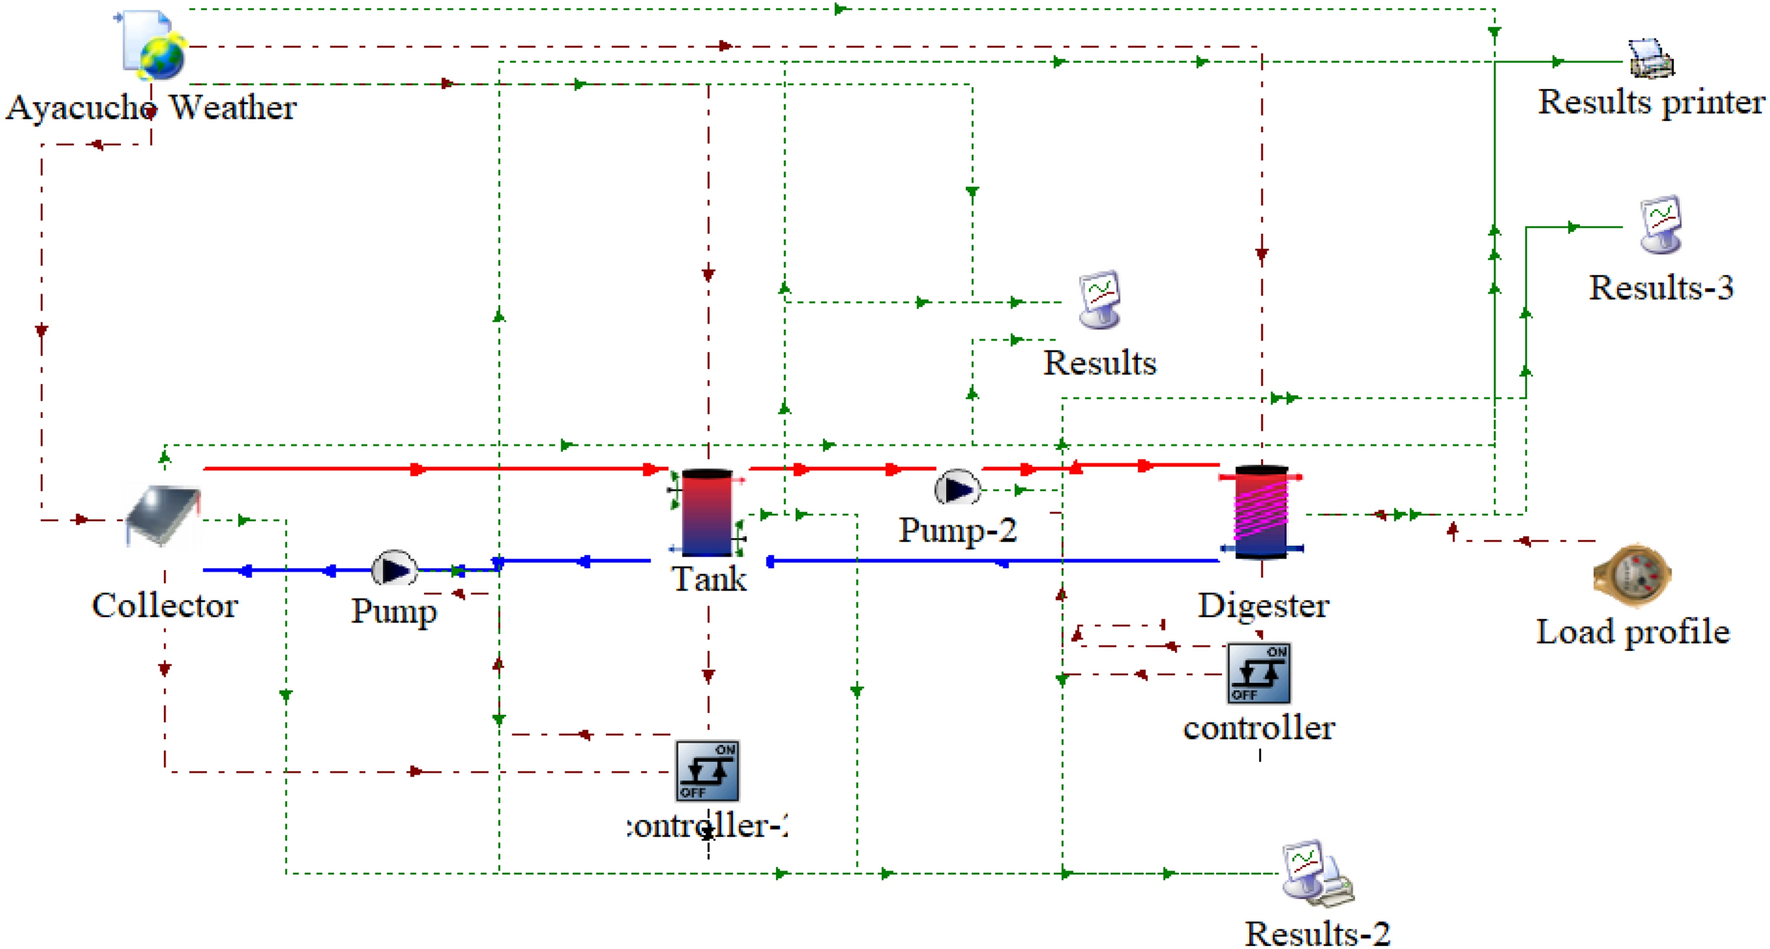
The TRNSYS design model for the solar enhanced anaerobic digester is presented in Fig.
4
, based on the parameters identified in Sect.
2
. and Appendix 2. According to the simulation results of the system presented in Fig.
5
, the digester temperature (Tave_BD) is kept on average 13 °C higher than the ambient temperature (T_Amb) throughout the year. The variation of temperature inside the digester within one day was a maximum 1.5 °C which will not affect the biogas production [
10
]. Figure
5
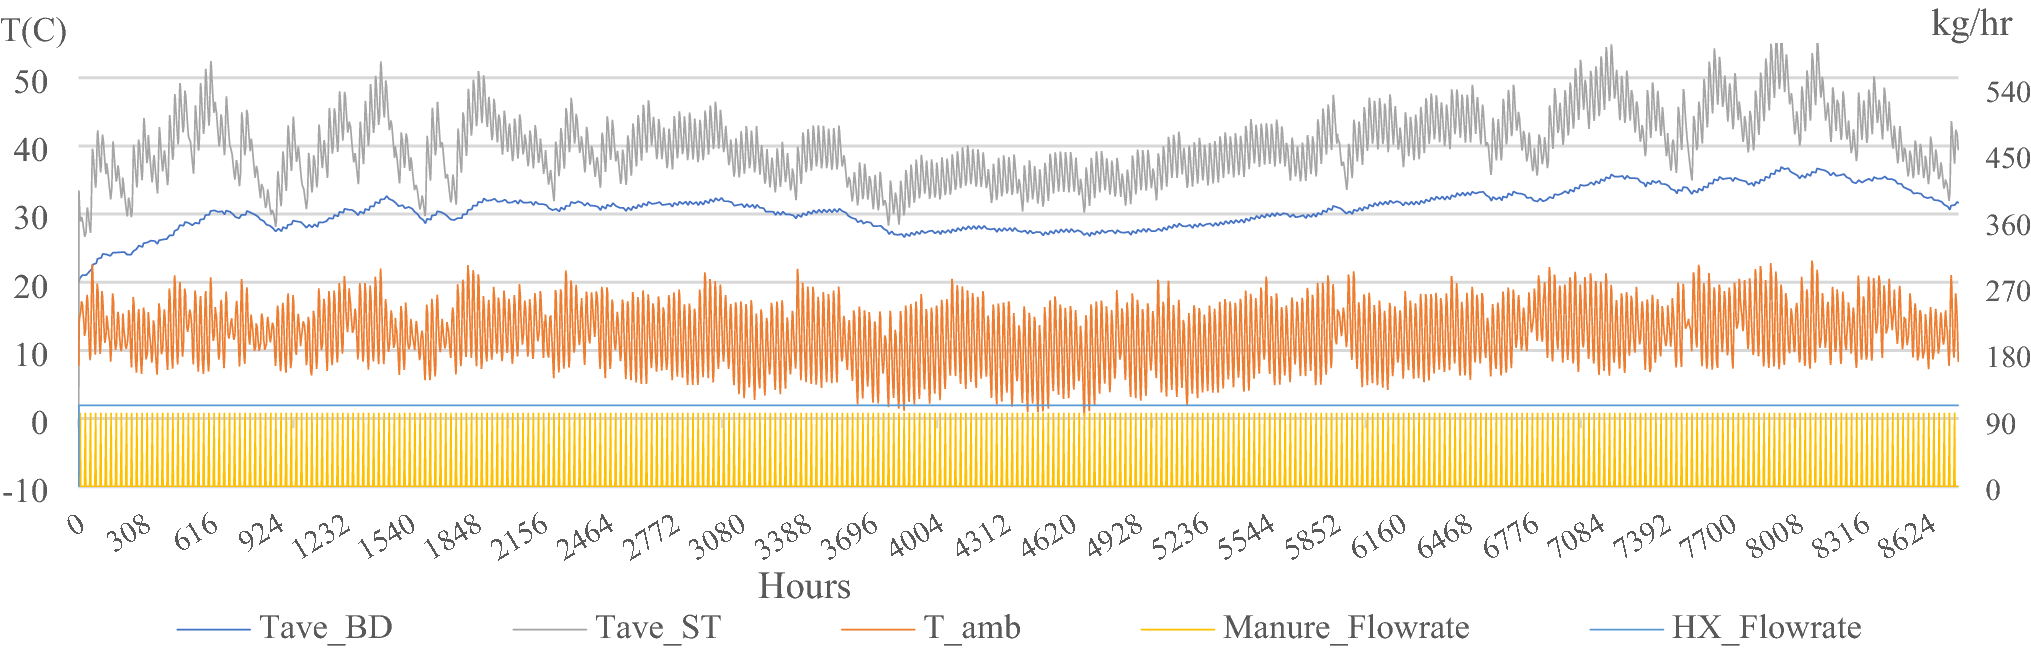
shows that the highest temperature is 37 °C and was achieved during November. The lowest temperature of 20 °C occurs during January at the beginning of the simulation and represents the start-up of the digester. The next low temperature period occurred in winter with a temperature around 26 °C during June. However, the average modelled temperature of the biogas digester was 30.7 °C with a standard deviation of 2.9. Figure
5
clearly shows that the average temperature of the storage tank (Tave_ST) is maintained at 40 °C over the study period. There is more variation due to the ambient climatic conditions over the year. but this value is higher than the digester temperature which is necessary considering the heat losses in the piping, and the heat exchanger.
Fig. 4
Enhanced digester system modelled in TRNSYS
Fig. 5
Hourly temperatures and flowrates
The flowrate of the manure and heat exchanger are also displayed in Fig.
5
. The heat exchanger (HX_Flowrate) has a steady flow of 110 kg/hr which means the flow inside the tube is turbulent at all times with a Reynolds Number of 4195, see Appendix 2, optimizing heat transfer. The simulation considers a controller in case the temperature of the digester goes above 41 °C, to avoid non-optimal temperatures for digestion [
20
] but, in this case it was not needed. However, it is a necessary system component to be considered in the design process. The manure flowrate (Manure_Flowrate) is 100 kg/hr during three hours per day according to the daily feed regime, to represent the time that users will spend each day during the digester operation.
The advantage of using TRYNSYS is the dynamic response to changes in inputs over time allowing for the demonstration of feedback control in the model. This was demonstrated with the relatively stable digester temperature compared to the ambient and solar collector (Tave_ST) temperatures over the yearlong modelling period. Furthermore, confidence in the system model can be drawn from this timeframe, unlike [
13
] who only modelled a solar heater digester in TRYNSYS for a sample period of just 10 days. Based on this model the biogas production system for the project is now discussed in the next section.
Biogas production
The daily average temperature and the volatile solids content (
So
), previously calculated, were used to calculate daily values of the kinetic parameter (
K
) and the maximum growth rate of microorganisms (
μm
). The ultimate methane yield
(Bo)
can vary from 0.17 to 0.24
m3/kgVSadded
depending on the feeding ration the animal receives [
7
], the age of the animal and the how old the manure is [
24
]. Given the importance of this parameter ideally laboratory analyses on the manure to stablish an accurate
Bo
to design the digester based on this. However, it was not possible to do this for this study so the value used was 0.21 considering that the cattle in Ayacucho is mainly fed with silage [
26
].
Using the calculated values for
K
and
μm
in Eq.
1
, the daily biogas production was calculated. Figure
6
shows the monthly accumulated production of methane per cubic meter of useful digester volume and the biogas production, considering a methane content of 60% [
30
,
31
]. The average methane yield per kilogram of volatile solids (VS) added and the average daily production were also calculated and can be seen in Table
3
.
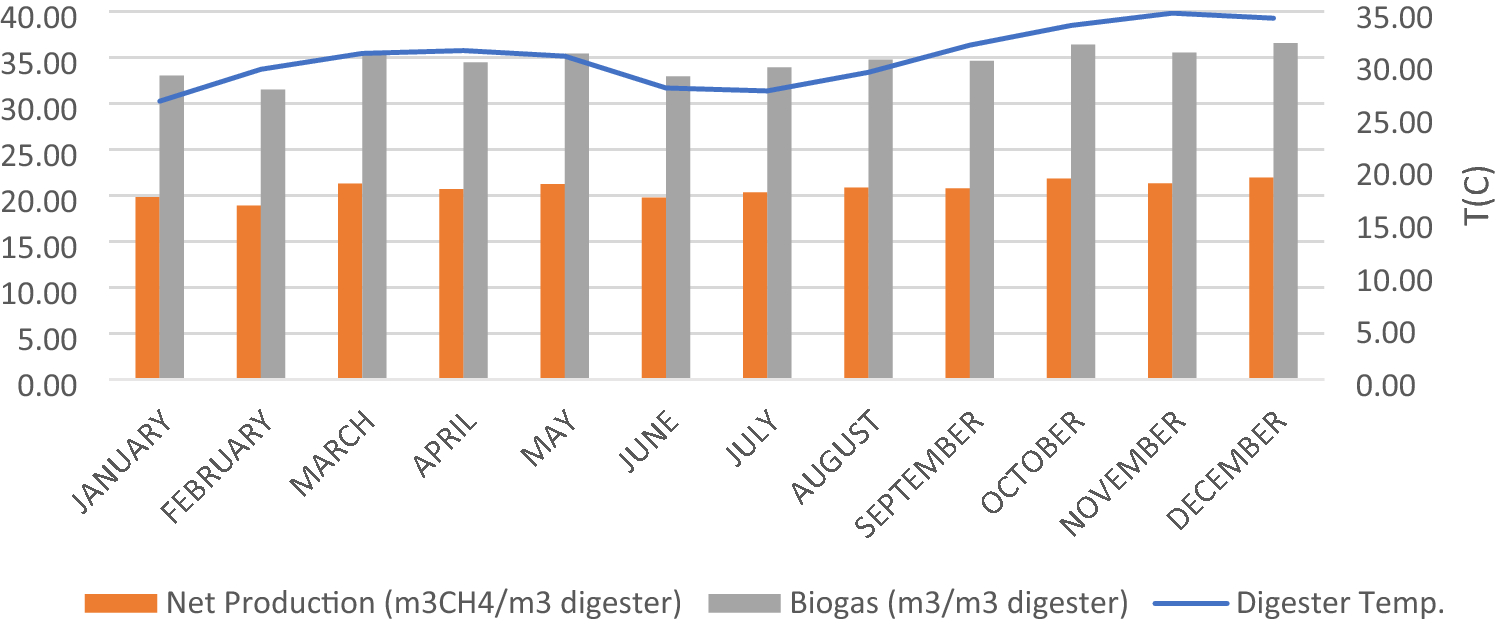
Fig. 6
Monthly biogas production of the enhanced digestor
Table 3
Comparison of other studies biogas production
Digester 1 [1]
Digester 2 [6]
Digester 3 [7]
Digester 4 [11]
This Study
Manure used
Guinea pig
Dairy cattle
Dairy cattle
Beef cattle
Dairy cattle
Temperature
23 °C
< 25 °C
11 °C
30 °C
30 °C
OLR
0.6
0.22
3.22
3.3
4
HRT
75 days
90 days
20 days
18 days
20 days
Biogas production
0.04 m3/m3.day
0.07 m3/m3.day
0.087 m3/m3.day
1.4 m3/m3.day
1.14 m3/m3.day
Methane yield
0.04 m3CH4/ kgVS
0.19 m3CH4/ kgVS
0.006 m3CH4/ kgVS
0.23 m3CH4/ kgVS
0.17 m3CH4/ kgVS
It can be noticed that the biogas production is related to the digester temperature, the production is higher during summer months and lower during winter and autumn. The methane yield does not change significantly during the seasons because this value is related to the digestion of the solids which depends more on the OLR and HRT.
In Table
3
the performance of the digester is compared to the performance of other tubular digesters in the Andean area [
1
,
6
] and reactors at lab-scale [
7
,
11
]. The guinea pig manure has a lower methane yield than other animal waste which, combined with the low OLR, result in the lowest production of this comparison. The second digester works at psychrophilic conditions and the methane yield is higher than the one for this project. This is because the longer HRT enables a better digestion of the solids, improving the specific methane yield [
5
]; but, the low OLR results in lower biogas production. Digester 3 has the same feedstock, HRT and a very similar OLR as this project, though the temperature is significantly lower. This shows the direct effect of the temperature on the biogas production which in for Digester 3 is 10 times smaller than found in this study. Digester 4 has very similar characteristics to this project yet, the production is higher. This is because beef cattle has a higher methane yield (due to feeding and the digestion of the animal) [
11
] which directly impact on the production and methane yield. Nevertheless, digester 4 is a good benchmark to compare this project and shows that the production of an enhanced digester can be as optimal as one at lab-scale. According to [
29
], production of up to 0.47 m
3
/m
3
.day have been reported in the Andean area using tubular digesters and the number could go up to 0.7 m
3
/m
3
day when using fixed dome digesters; even so, the production of the enhanced digester is still higher.
Using SPSS software, a correlation analysis was carried out between the radiation level, the temperature in the storage tank, the temperature in the digester and the net production. All the significance values in Table
4
are lower than 0.05 which means that all the variables have some degree of correlation. The Pearson coefficient indicates the degree of correlation between variables. It is noticeable that the temperature in the storage tank has a higher of correlation to the digester temperature and net production, than the level of radiation. This shows the importance of the storage tank in order to maintain a stable temperature in the system. It is also important to notice the high level of correlation between the net production and the digester temperature. The high correlation coefficient between these variables suggests a linear relationship which is why a linear regression analysis was applied.
Table 4
Correlation analysis results
Gh (KJ/hr*m2)
Tave_BD ( °C)
Net Prod. (m3CH4/m3 day)
Tave_ST ( °C)
Gh (KJ/hr*m2)
Pearson Correlation
1
0.219
0.199
0.521
Sig. (2-tailed)
–
0.000
0.000
0.000
Tave_BD ( °C)
Pearson Correlation
0.219
1
0.959
0.790
Sig. (2-tailed)
0.000
–
0.000
0.000
Net Prod. (m3CH4/m3.day)
Pearson Correlation
0.199
0.959
1
0.724
Sig. (2-tailed)
0.000
0.000
–
0.000
Tave_ST( °C)
Pearson Correlation
0.521
0.790
0.724
1
Sig. (2-tailed)
0.000
0.000
0.000
–
The linear regression analysis confirms that a linear model can be used to represent the relationship between the digester temperature and the methane yield. The value of R square is 0.824 which means the model is accurate and embodies 82.4% of the values. The linear model developed is:
y=0.1+0.002T
where
y
is the methane yield
(m3CH4/kgVS added)
and T is the temperature (°C), which in this case varies from 20 to 37 °C Another study [
8
] at lab-scale also developed a linear model to explain this relationship within a temperature range of 10–23 °C (using dairy manure as well), obtaining a similar model. The temperature coefficient calculated (0.005) was a bit higher than this study which could be due to the lower temperatures of the lab-scale experiment. For this study, the digester was kept at mesophilic temperatures throughout the year, so the variation of the methane yield was not as significant as the one in the lab-scale experiment by [
8
], resulting in a smaller temperature coefficient.
Economic and social analysis of the enhanced digester
The cost of a small-scale biogas system includes the digester materials and installations costs (investment) as well as the operational costs. Operational costs should include repairs and maintenance along with the labour to transport the manure and feed the digester [
32
]. Table
5
shows the costs of each item considered for the enhanced digester.
Table 5
Investment and operational costs of an enhanced digester
PROJECT STAGE
COST
Investment
8 m3 PVC geomembrane digester (0.6 mm thickness)
Includes piping, valves, connections, gas meter. [33]
$495.00
30 m2 PVC geomembrane (cover/jacket) [34]
$340.00
Installation [33]
$312.50
Gas Storage [35]
$70.31
Solar Collectors (2 Units 2 m2) [36] [37]
$528.00
Storage Tank (1m3) [38]
$112.47
Pump (× 2) [39]
$810.08
Structure to protect equipment [35]
$234.00
PID Controller (× 2) [40]
$56.25
Aluminium Heat Exchanger 35 m [41]
$1500.00
Electrical Generator [42]
$562.50
Other Costs
$502.11
TOTAL
$5523.22
Operation
Labour (yearly)
$796.88
Tear Repairs (Every 5 years) [33]
$50.00
The PVC geomembrane was chosen for the digester and cover material for its durability. According to other studies [
35
], 30% of digesters in the Andean area were abandoned by users because of ruptures. Using PVC allows the project to have a longer lifetime and also facilitates repairment in case of any damage (which is not possible when using other materials). A structure was added so the electrical generator could be protected from ambient conditions. The electrical generator considered for this cost analysis is for natural gas since it was not possible to find one specifically for biogas. Tests would need to be conducted to confirm if the generator can work properly only using biogas. The labour considered for the operational cost accounts to one quarter of the minimum wage in Peru to represent the daily hours that users will need to feed the digester. The “other costs” item is for contingencies and represents 10% of the total investment. The highest cost in the investment phase is the heat exchanger due to the material and customization needed.
Using the calorific value of biogas [
28
,
43
] and its referential price per kWh [
44
] (smaller than any other fuel price in the Peruvian market [
45
]), the yearly revenue for the biogas production was calculated to be $1,194.32. This revenue represents the avoided costs of buying other fuels. The cashflow of the project was calculated considering 15 years of lifetime in view of previous experiences using PVC geomembrane digesters [
16
]. The financial analysis was done under 3 scenarios: considering full investment and no labour, full investment and labour, and 60% investment and labour. The discount rate (DR) for biomass technologies in the UK is 8% [
46
], however, because this technology is not completely established in Peru it would be considered risky, so it was raised to 10%. The results of the Net Present Value (NPV) and Internal Return Rate (IRR) analyses are presented in Table
6
.
Table 6
Financial analysis of the project
Without labour
With labour
With labour and government help
NPV (DR 10%)
$3498.61
− $2562.48
− $353.19
NPV (DR 8%)
$4626.62
− $2194.21
$15.08
IRR
20%
1%
8%
The scenario without labour is the most profitable and would represent a viable investment. This scenario considers that time currently being used to collect animal dung or fuel wood is now spent servicing the digester. Nevertheless, it does not represent the opportunity cost those users will need to invest every day to keep the digester working, or if they decide to hire another person to do the work. The scenario with labour has a small IRR and a negative NPV for both DR, expressing the non-viability of the project for any investor. A third option in Table
6
contemplates only 60% of the investment by the users and 40% by government subsidy. It is best to not subsidize the investment completely because the users lose the sense of ownership for the project which could lead to a lack of interest and abandonment [
16
]. Taking into account the government subsidy, the IRR is 8% but the NPV is still negative because the DR is higher than the resulting IRR. However, when changing the DR to 8%, the NPV turns positive which indicates a viable project. This means that, in order to have a viable project, not only a government subsidy will be needed, but also new policies would need to be implemented. With the subsidy, the initial investment from users would be $3,313.93 which is still a significant amount for farmers. If the project was executed between two families it would help to split this amount. However, new policies would need to be implemented in order to reduce interest rates and make loans for this type of projects more accessible to people; this would encourage investment. In China, the government offered financial loans for anaerobic digestion technologies and subsidies for materials, from which 82% went to the construction of household digesters [
32
]. This government initiative helped spread this technology and made it accessible for rural residents where it was more suitable.
The enhanced production of the digester could have a significant impact on the lifestyle of users. Table
7
shows the monthly biogas production, suggested potential uses, and the amount left after this. In the rural area, a household is considered to have six members [
3
] so this number was used to calculate the amount needed for cooking and hot water for showers. The electric consumption of the pumps in the system was calculated according to the vendor specifications [
39
] and the hours of use by TRNSYS. The lighting from LED lightbulbs [
2
] considers five units and seven hours of use every day. The biogas left could be used for more electrical generation (phone charging or other electrical devices) or direct use (biogas lamps).
Table 7
Potential uses of the biogas production
Production (m3)
Cooking (m3)
Pumps (m3)
Lighting (m3)
Hot water (m3)
Biogas Remaining (m3)
January
198.17
112
159.2
7.60
4.84
− 1.64
February
189.05
101
141.5
6.86
4.68
9.41
March
213.01
112
156.3
7.60
4.84
14.63
April
206.82
108
151.5
7.35
4.68
14.71
May
212.47
112
154.7
7.60
4.84
14.91
June
197.74
108
148.8
7.35
4.68
6.99
July
203.48
112
156.5
7.60
4.84
5.02
August
208.65
112
157.8
7.60
4.84
9.52
September
207.83
108
153.2
7.35
4.68
14.90
October
218.31
112
161.6
7.60
4.84
17.30
November
213.23
108
154.4
7.35
4.68
19.70
December
219.42
112
160.1
7.60
4.84
19.16
TOTAL
2488.18
1314.00
1855.20
89.43
57.25
144.61
The enhanced production would satisfy completely the cooking demand, avoiding the use of other harmful and inefficient fuels. The digester requires a few hours intervention every day but on balance this would reduce the amount of work done by the family in collecting fuel and maintaining fires, thus allowing them to focus on the agricultural and livestock activities. Access to lighting would also make home activities easier and potentially allow for working in the evenings. Children would be able to do homework at home with better lighting, improving their school performance. Having a hot shower, which is seen as a luxury in the rural area, would be possible every day, improving their health and comfort. Another benefit from the digester that has not been quantified is the fertilizer, obtained as a by-product of the digestion. Studies [
1
] show that its usage improves crop yield by 100%. This project would generate approximately 100 L/day of digestate which could be used to enhance the agricultural production as well or could be sold to other farmers. An increased yield could allow the users to have more animals or to sell the extra production, bringing further economic benefits.
Sensitivity analysis
The effect of changing key parameters on the biogas production is displayed in Fig.
7
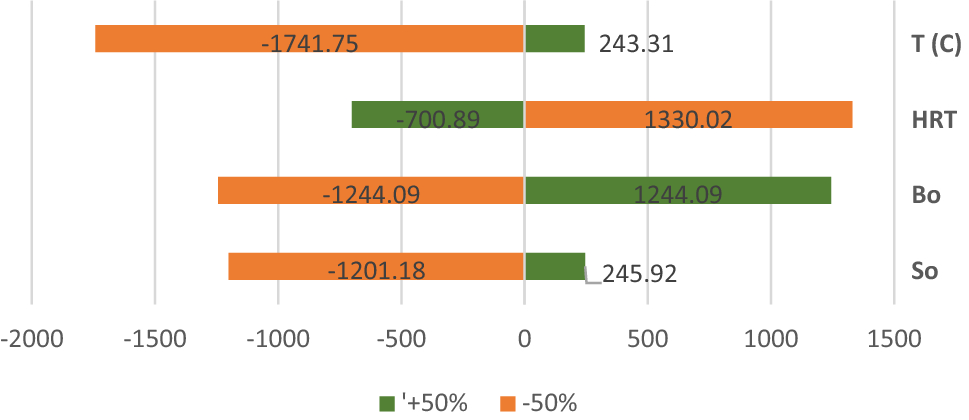
over a range of ± 50% from the optimal value. The effect of decreasing the temperature (T) is noticeable, and it can reduce the gas production by 70% when reaching a temperature of 15 °C. It is also interesting that, the methane yield calculated from the production at different temperatures is the same as when using the linear model from the linear regression analysis. This confirms the accuracy of the linear model developed (when used within the range of 20–37 °C). As Fig.
7
shows, the increased temperature does not have such a significant impact in the production. This could be because the highest temperature is 45 °C which is outside the range of optimal mesophilic temperatures but not high enough for thermophilic digestion [
20
]. This also shows that, investing in another collector to raise the digester temperature would not be a worthy investment. The digester temperature, according to the statistical analysis, is more related to the storage tank temperature than the radiation levels. This would suggest that, if enough radiation is ensured, insulation for the storage tank and the digester will be the next important factor to consider in order to maintain a stable temperature to prevent it from dropping.
Fig. 7
Changes on the biogas production in m
3
per month with each varying parameter
Figure
7
indicates reducing the HRT shows an increase in biogas production, but it would also decrease the stability of the digester because the bacteria would not have enough time to adapt and digest the solids before being pushed out of the digester. A larger digester would also be required in order to maintain the same OLR, which means a higher investment cost. On the other hand, increasing the HRT reduces the biogas production but could improve the methane yield, hence the importance of finding a balance between a good methane yield (which means solids are completely digested) and the biogas production. In this case, the enhanced predicted temperature makes it possible to reduce the usual 60 days HRT in the Andean area [
14
] to just 20 days.
The ultimate methane yield (
Bo
) depends on the animal diet, age and breed. Dairy manure can vary from 0.17 to 0.24
m3/kgVSadded
[
26
] so the highest value in this analysis (0.31) would not be representative. This value would be used with beef or pig cattle, which are also present in Ayacucho but were not selected for this study. However, if the dairy cattle were fed mainly with roughage, this would cause the
Bo
to be lower and impact the biogas production. It is important that farmers are aware of this, so they can incorporate more grains and silage to the feeding rations of the cattle and improve the
Bo
.
Finally, the content of volatile solids (
So
) being fed to the digester will also have a significant impact if reduced. Since the
So
has been selected according to the HRT and size of digester, reducing it will lower the OLR and consequently, the biogas production. The amount of volatile solids in the manure also depends on the animal’s feeding ration and age [
23
]; and the number of animals the family possesses. If the number is not enough to meet the proposed OLR, the family would have to decide whether to keep the reduced production or to join another family and split the total production. This would depend on how the family prioritizes the uses of the biogas and bio-slurry. Increasing the OLR above the recommended rate (2.5–4
kgVS/m3.day
[
17
]) can cause the methane production to be inhibited [
23
] due to stress in the digester. Once the digester reaches a stressful OLR, the biogas production rate starts to decline which is why Fig.
7
shows only a small positive difference in biogas production for increasing
So
by 50%.
It is important to execute this type of analysis to check if any variable or characteristic could be improved in the design of the project. In this case, the operational characteristics are optimal, and they would not need to be changed. The only parameter that would be worth improving is the
Bo
, which will depend on the users during the operation phase. It would also be important to share this with the users so they understand the importance of each of these parameters and how the production will be affected with any of these changes. Many digesters in the Andean area have been abandoned because users did not fully understand their operation and the production was compromised [
47
]. This could be avoided through training farmers and system developers to ensure the optimal characteristics are being met during the operation of the enhanced biogas digesters.
Conclusions
This study presented a design for an anaerobic digester solution for dealing with the low temperature constraints in the Andean area of Ayacucho, Peru. The results from the dynamic analysis of the enhanced digester indicated that it was possible to maintain a digester at mesophilic temperatures (30.7 °C average), all year round, using a water jacket fed by solar collectors that kept a steady state of ± 1.5 °C each day The region has high levels of solar resource throughout the year due to the low latitude. The model predicts biogas production of 1.14 m
3
/m
3
digester per day, which is more than twice the level of existing psychrophilic digesters in the Andean area, that meets daily energy demands. However, it was found that the initial economic investment is significant, especially for low-income people. However, it was found that the proposed system would be financially viable with an IRR of 20% if operating the digester is seen as a replacement for time spent collecting fuel wood and dung. But labour costs could be supported with adequate government subsidies (40%) and incentives for a biogas programme in rural mountainous areas, giving an IRR of 8%. The social impacts could also be important to end-users. While the direct impacts of the production of biogas are mentioned, such as access to lighting, cooking and hot showers, the effect of these benefits are not as such quantified. Lighting means that children could do homework at home in a smoke free environment which has the opportunity to improve their school performance. The enhanced biogas production should mean a better quality of life for the users. But training in the operation of the digester and cattle husbandry would be essential to optimise the benefit to rural households. The sensitivity analysis demonstrated the main variables affecting biogas production with temperature parameter having the greatest impact on performance. This justifies the need for solar enhanced biodigesters in cold climates which was the aim of this study. The viability of this study is based on simulation models; therefore, it would be necessary to confirm these results with real experiences which would be the next stage in the development of this work.
Acknowedgements
We would like to express our gratitude to the Peruvian Government and people of Ayacucho for the support during the development of this study.
Publisher's Note
Springer Nature remains neutral with regard to jurisdictional claims in published maps and institutional affiliations.
References
Garfí et al. (2011) Psychrophilic anaerobic digestion of guinea pig manure in low-cost tubular digesters at high altitude 102(10) (pp. 6356-6359) 10.1016/j.biortech.2011.03.004
Pode (2013) Financing LED solar home systems in developing countries (pp. 596-629) 10.1016/j.rser.2013.04.004
Unknown ()
Unknown ()
Alvarez et al. (2006) Biogas production from llama and cow manure at high altitude 30(1) (pp. 66-75) 10.1016/j.biombioe.2005.10.001
Ferrer et al. (2011) Biogas production in low-cost household digesters at the Peruvian Andes 35(5) (pp. 1668-1674) 10.1016/j.biombioe.2010.12.036
Safley and Westerman (1990) Psychrophilic anaerobic digestion of animal manure: Proposed design methodology 34(2) (pp. 133-148) 10.1016/0269-7483(90)90014-J
Safley and Westerman (1994) Low temperature digestion of dairy and swine manure (pp. 165-171) 10.1016/0960-8524(94)90116-3
Alvarez and Lidén (2008) The effect of temperature variation on biomethanation at high altitude 99(15) (pp. 7278-7284) 10.1016/j.biortech.2007.12.055
El-Mashad et al. (2004) Effect of temperature and temperature fluctuation on thermophilic anaerobic digestion of cattle manure 95(2) (pp. 191-201) 10.1016/j.biortech.2003.07.013
Chen et al. (1980) Effect of temperature on methane fermentation kinetics of beef-cattle manure (pp. 325-339)
Hassanein et al. (2015) Simulation and validation of a model for heating underground biogas digesters by solar energy (pp. 336-344) 10.1016/j.ecoleng.2015.05.010
Axaopoulos et al. (2001) Simulation and experimental performance of a solar-heated anaerobic digester 70(2) (pp. 155-164) 10.1016/S0038-092X(00)00130-4
Unknown ()
Unknown ()
Garfí et al. (2016) Household anaerobic digesters for biogas production in Latin America: a review (pp. 599-614) 10.1016/j.rser.2016.01.071
Unknown ()
Unknown ()
Rasheed et al. (2018) Development of a model to calculate the overall heat transfer coefficient of greenhouse covers10.5424/sjar/2017154-10777
Weatherford and Zhai (2015) Affordable solar-assisted biogas digesters for cold climates: experiment, model, verification and analysis (pp. 209-216) 10.1016/j.apenergy.2015.01.111
Liu et al. (2017) Investigation on the heat loss characteristic of underground household biogas digester using dynamic simulations and experiments (pp. 116-133) 10.1016/j.biosystemseng.2017.09.002
Unknown ()
Hashimoto (1982) Methane from cattle waste: Effects of temperature, hydraulic retention time, and influent substrate concentration on kinetic parameter (k) 24(9) (pp. 2039-2052) 10.1002/bit.260240911
Terradas-Ill et al. (2014) Thermic model to predict biogas production in unheated fixed-dome digesters buried in the ground10.1021/es403215w
Keshtkar et al. (2003) Mathematical modeling of non-ideal mixing continuous flow reactors for anaerobic digestion of cattle manure 87(1) (pp. 113-124) 10.1016/S0960-8524(02)00104-9
Unknown ()
Unknown ()
Unknown ()
Unknown ()
Lansing et al. (2008) Quantifying electricity generation and waste transformations in a low-cost, plug-flow anaerobic digestion system 34(4) (pp. 332-348) 10.1016/j.ecoleng.2008.09.002
Pérez et al. (2014) Technical, economic and environmental assessment of household biogas digesters for rural communities (pp. 313-318) 10.1016/j.renene.2013.07.017
Song et al. (2014) Comparison of biogas development from households and medium and large-scale biogas plants in rural China (pp. 204-213) 10.1016/j.rser.2014.01.084
Unknown ()
Unknown ()
Poggio et al. (2009) Adaptación de biodigestores tubulares de plástico a climas fríos 21(9) (pp. 1-14)
Unknown ()
Unknown ()
Unknown ()
Unknown ()
Unknown ()
Unknown ()
Unknown ()
Kashyap et al. (2003) Biomethanation under psychrophilic conditions: a review 87(2) (pp. 147-153) 10.1016/S0960-8524(02)00205-5
Unknown ()
Unknown ()
Unknown ()
Ferrer-Martí et al. (2018) A multi-criteria decision support tool for the assessment of household biogas digester programmes in rural areas. A case study in Peru (pp. 74-83) 10.1016/j.rser.2018.06.064
Unknown ()
Unknown ()
Unknown ()
Unknown ()
Unknown ()
El-Mashad et al. (2005) Rheological properties of dairy cattle manure 96(5) (pp. 531-535) 10.1016/j.biortech.2004.06.020
Nayyeri et al. (2009) Thermal properties of dairy cattle manure (pp. 359-366)
Achkari-Begdouri and Goodrich (1992) Bulk density and thermal properties of Moroccan dairy cattle manure 40(3) (pp. 225-233) 10.1016/0960-8524(92)90147-P
Chen (1986) Rheological properties of sieved beef-cattle manure slurry: Rheological model and effects of temperature and solids concentration 15(1) (pp. 17-33) 10.1016/0141-4607(86)90123-X