Institute of Environmental Engineering and Building Installations, Lodz University of Technology, Lodz, 90-924, PL
Abstract
Solving urban wastewater management problems requires knowledge of wastewater composition and variability. In the case of combined sewerage, this applies to both dry and wet weather. Wastewater composition is changing as a result of the appearance of new substances on the market, the changes in inhabitant lifestyle and the catchment characteristic; therefore, it must be constantly monitored. At the same time, due to the time-consuming and high costs of measurement campaigns, solutions that could limit their scope and facilitate the interpretation of the results are sought. This paper presents the results of the measurement campaign conducted in 2018–2021. The aim of the monitoring was, inter alia, assessment of wastewater composition in terms of threats to wastewater treatment plant and urban rivers, which are receivers of discharge from combined sewer overflows. The obtained results were analyzed using the multivariate statistical methods: Principal Component Analysis and Cluster Analysis. However, the applied methods did not allow for the full identification of the relationship between the wastewater quality parameters as well as the differences and similarities in the wastewater composition from individual parts of the city, which could simplify and reduce the measurement campaigns in the future. Therefore, in the case of large urban catchments, it is necessary to introduce other solutions to control the wastewater composition.
Introduction
Sustainable development of urban drainage systems requires measures based, inter alia, on data on the quality of wastewater transported through the sewage network. These data are necessary for the sewerage design and operation (due to the corrosive effects of wastewater components on pipeline material and the sewer deposit formation), network modernization (e.g., when using BMPs/LIDs for stormwater management, disconnecting part of the catchment), design and operation of wastewater treatment plants (WWTPs) and investments to protect receiving waters, including solutions reducing discharges from combined sewer overflows. The municipal wastewater composition depends on many factors: the number of inhabitants and the type of their activity, industrial development, location of point pollution sources, level of water consumption, day of the week and season [
1
,
2
,
3
,
4
,
5
,
6
–
7
]. The continuous development of urban areas, changes of inhabitants lifestyle, the emergence on the market of new and varied substances, some of which end up in the sewage system, as well as climate change and water shortages often mean that the composition of municipal wastewater changes. Nowadays, many emerging contaminants are identified in wastewater: pharmaceuticals, pesticides, industrial chemicals, plasticizers and polycyclic aromatic hydrocarbons, xenobiotics, estrogens, oil and other petrochemical products [
8
,
9
,
10
,
11
,
12
,
13
,
14
–
15
].
In the case of combined sewer system, the sewage also contains pollutants build-up on the catchment area during dry weather and then washed off during rainfall. Hence, the type and quantity of pollutants in combined wastewater depend, among others, on the land use, the degree of catchment area contamination, the frequency and efficiency of street cleaning, the intensity of car traffic and the precipitation characteristics. Stormwater runoff may contain over 650 organic substances and 30 metals and trace inorganic compounds [
16
,
17
–
18
]. Loads of BOD
5
, TSS and nutrients from urban runoff are now comparable with those conveyed by treated wastewater in Europe [
19
].
Urban wastewater may contain substances that are toxic for receiving water and the biological treatment process in WWTPs, which may significantly reduce the efficiency of the treatment process, and sometimes even lead to its complete collapse. Understanding the qualitative characteristics of wastewater requires measurement campaigns, which is a long-term and costly task, especially in the case of combined sewerage, where the dynamics of wastewater composition changes is high due to the unpredictability and large variability of precipitation phenomena [
20
,
21
–
22
]. For this reason, methods reducing the number of analyses are being sought, e.g., by establishing the correlation between parameters. Various types of matrix and composite indexes replacing several parameters are created to simplify the procedures of wastewater quality assessment [
23
,
24
,
25
,
26
–
27
]. Nowadays, in order to limit measurement campaigns and to facilitate the analysis and evaluation of measurement data, statistical optimization and forecasting methods, also with the use of artificial intelligence, are increasingly used [
28
,
29
,
30
,
31
–
32
].
This paper presents the results of a measurement campaign carried out in Lodz (Poland) in 2018–2021. The aim was to assess the quality and composition variability of wastewater in the sewage system, to establish the correlation between quality parameters and to learn about the qualitative specificity of wastewater discharged from different parts of the city, especially in terms of threats to WWTP and receiving water. The campaign was the first stage of the development of the monitoring, early warning, and sustainable management system for the wastewater treatment plant in Lodz that would minimize the pollutants emission into the aquatic environment.
Materials and methods
Study area
Lodz city is located in the central part of the country on the border of two major river watersheds (Vistula and Oder). Elevation above sea level is between 163.6 and 284.1 m. Total area of the city is 293 km
2
with the structure of the land as follows: built-up and urbanized area—46.8%, agricultural land—41.7%, forest land as well as woody and busty—10.0%. Population of the city is 677.3 thousand inhabitants. Lodz has a humid continental climate, with an average annual temperature of 8.7 °C. The average annual precipitation is 582 mm.
The city is equipped with the hybrid sewer system. In the central part of the city, there is a combined sewer system serving the catchment area of about 4240 ha. This system is equipped with 18 combined sewer overflows, which, during wet weather, discharge excess wastewater into four small rivers. The remaining districts covering an area of 8200 ha, are equipped with a separate system. Municipal wastewater is discharged into the Group Wastewater Treatment Plant (GWTTP) which is located in the southwest part of the city and serves also two neighboring smaller towns. The biological stage of the GWWTP works in the MUCT system. The designed capacity of the GWWTP is 1.026.260 PE, while the current load on the plant is 934.700 PE. Maximum sewage inflow to the treatment plant during dry weather with a probability of 85% is 166,000 m
3
per day. 99.9% of industrial and domestic wastewater from the city is treated. Sometimes the inflow of unidentified, toxic substances which inhibit the biological treatment process in the GWWTP, was observed, which resulted in decreasing the nitrogen removal and significant increase in nutrients emission to the environment [
33
]. At present, there are not many large industrial plants in the city. There are factories of electro-mechanical, chemical, textile, and leather footwear industries in the city, but because of the development of in-house effluent treatment and quality monitoring of discharged wastewater, the industry is not recognized as a significant source of toxic substances. It is suspected that the presence of such substances was caused by illegal sewage discharges into the sewage system.
Sampling and analytical methods
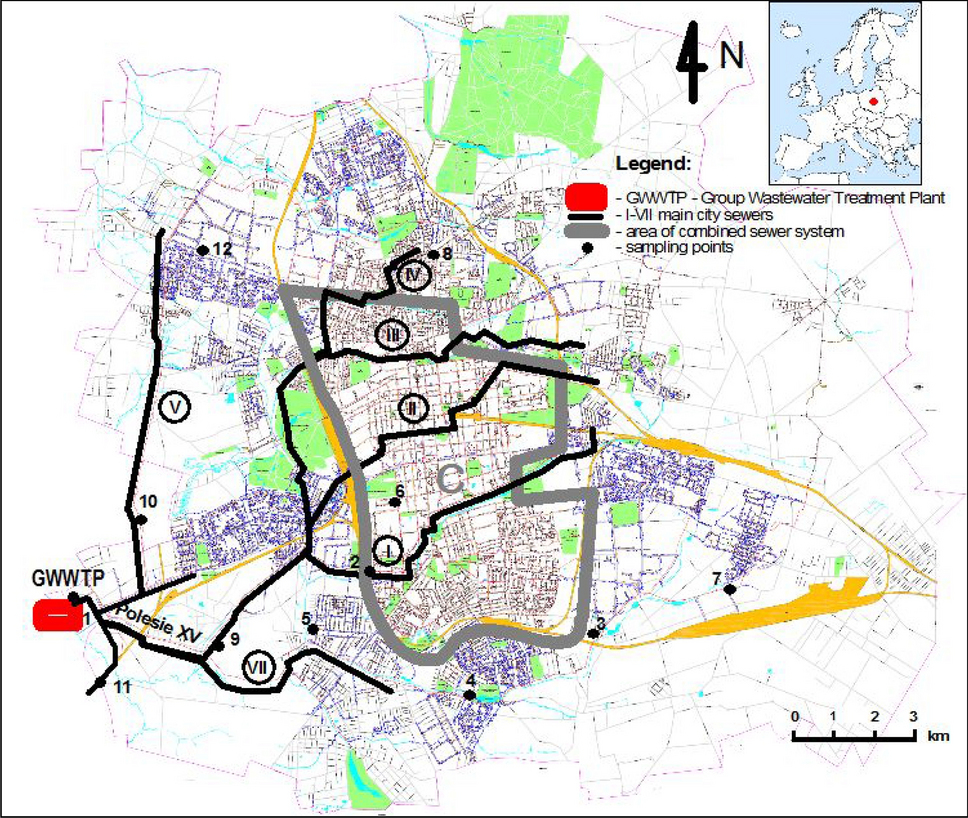
The survey of wastewater quality was conducted in 2018–2021. Wastewater samples were collected at 12 points of the sewer system using a portable sampler. The location of the sampling points is presented in Fig.
1
, and their characteristics are presented in Table
1
.
Fig. 1
Scheme of the sewer system in Lodz with location of sampling points
Table 1
Characteristic of sampling points
No of sampling point
Type of sewer system
Sewer size (m)
Catchment characteristic
1
Combined
3.50 × 2.50
Inflow to the GWWTP
2
Combined
1.50 × 2.30
Inflow from central and eastern parts of the city (domestic and industrial sewage, stormwater)
3
Sanitary
0.90 × 1.60
Domestic and industrial sewage from southeastern districts
4
Sanitary
Ø 0.80
Domestic sewage with a large share of hospital wastewater
5
Sanitary
1.50 × 1.875
Domestic and industrial sewage from southtern districts
6
Combined
1.20 × 2.00
Inflow from central parts of the city (domestic and industrial sewage, stormwater)
7
Sanitary
0.70 × 1.25
Domestic and industrial sewage from southeastern districts
8
Sanitary
0.70 × 1.25
Inflow mainly from residential areas
9
Combined
2.50 × 3.00
Inflow from combined catchment (central districts)
10
Sanitary
1.80 × 2.25
Inflow from residential and industrial area of northern city districts
11
Combined
Ø1,60
Inflow from Pabianice city (domestic and industrial sewage, stormwater)
12
Sanitary
0.60 × 1.10
Inflow from industrial area
Usually, the sampler was placed in a manhole for 24 h, and samples were taken every 1 h. One aggregate sample was prepared from four consecutive samples, thus obtaining 6 test samples. The exceptions were sampling points no. 6–8, where the wastewater was collected manually due to the impossibility of placing the sampler in the street manhole, predominantly 3 times a day or more. The wastewater after transport to the laboratory was tested in accordance with the range and procedures given in Table
2
. Analysis results of 20 physicochemical wastewater parameters are presented in the paper: pH, conductivity (CD), total suspended solids (TSS), biological oxygen demand (BOD
5
), chemical oxygen demand (COD), ammonia (NH
4
–N), total nitrogen Kjeldahl (TKN), total phosphorus (TP), sulfide (S
2
), zinc (Zn), copper (Cu), chromium (Cr), lead (Pb), cationic surfactants (CS), anionic surfactants (AS), non-ionic surfactants (NIS), hydrocarbon oil index (HOI), benzene, toluene, xylene (BTX), phenol compounds (PC), and naproxen (NAP). Most of the analyzed parameters are limited in wastewater discharged to the sewage system and to surface waters. Additionally, naproxen has been investigated as an example of pharmaceuticals that are increasingly found in wastewater in concentrations that may adversely affect the biological treatment process in WWTPs and receiving waters body. Naproxen is one of the most commonly found pharmaceuticals in sewage treatment plant effluents and in surface waters [
34
,
35
]. The sewage samples for testing were collected 72 times, 55 times during dry weather, and 17 during wet weather.
Table 2
Tested parameters of wastewater quality—methodology of analysis and emission standards
No
Parameter
Analytical method; detection limit
Emission standards in Lodz
Discharge of industrial wastewater into the sewer system according to local regulation in Lodz
Discharge into water and soil according to Regulation of the Minister of Maritime Economy and Inland Navigation
PN ISO 5664:2002; titration method; 0.5 mg NH4–N/L
100 mg NH4–N /L
10 mg NH4–N /L*
7
TKN
PN-EN 25,663:2001; titration method;
2 mg N/L
100 mgN/L
–
8
TP
PN-EN ISO 6878:2006; UV/VIS spectrometry; 0,04 mgP/L
15.0 mgP/L
1 mgP/L
9
S2−
Sulfide test; colorimetric method;
0.1 mgS2−/L
1 mgS/L
0.2 mgS/L*
10
Zn
PN-EN ISO 8288:2002, mineralization and FAAS; 25 µg/L
2 mg/L
2 mg/L*
11
Cu
PN-EN ISO 15586:2005; mineralization and GFAAS; 0.5 µg/L
0.3 mg/L
0.1; 0.5 mg/L**
12
Cr
PN-EN ISO 15586:2005; mineralization and GFAAS; 1 µg/L
0.3 mg/L
0.5; 1,0 mg/L**
13
Pb
PN-EN ISO 15586:2005; mineralization and GFAAS; 2 µg/L
0.2 mg/L
0.1; 0.5 mg/L**
14
CS
cuvette tests HACH; UV/VIS spectrometry; 0.2 mg/L
–
–
15
AS
cuvette tests HACH; UV/VIS spectrometry; 0.1 mg/L
15 mg/ L
5 mg/L*
16
NIS
cuvette tests HACH; UV/VIS spectrometry; 6 mg/L
20 mg/L
10 mg/L*
17
HOI
PN-EN ISO 9377–2; solvent extraction and gas chromatography; 0.1 mg/L
15 mg/L
5;15 mg/L**
18
BTX
ISO 11423–2; extraction and gas chromatography; 5 µg/L
1 mg/L
0.1 mg/L*
19
PC
SPE and UV/VIS spectrometry; 0.02 mg/L
15 mg/L
0.1 mg/L*
20
NAP
SPE and HPLC; 1 µg/L
–
–
Results and discussion
Wastewater composition and its variability
The results of wastewater composition survey in Lodz sewer system are presented in Table
3
with the exception on BTX which were not detected in any of the tested wastewater samples. This means that BTX concentrations were lower than 5 μg/L. Similar results were also observed in other municipal wastewater studies, for example in Paris BTX were occasionally detected [
36
].
Table 3
Results of wastewater composition survey in sewer system in Lodz
No*
pH (-)
CD (μS/cm)
BOD (mg/L)
COD (mg/L)
TSS (mg/L)
NH4–N (mg/L)
TKN (mg/L)
TP (mg/L)
Zn (mg/L)
Cu (mg/L)
Cr (mg/L)
Pb (mg/L)
S2−(mg/L)
HOI (mg/L)
CS (mg/L)
AS (mg/L)
NIS (mg/L)
PC (mg/L)
NAP (μg/L)
1
Min
6.94
550
118
241
78
9.7
12.3
1.3
0.015
0.002
0.002
0.002
< 0.1
0.10
0.4
7.5
10.5
0.00
1.9
Max
8.65
3530
1270
3173
2240
87.4
189.3
17.4
0.525
0.186
0.393
0.070
1.50
4.43
3.7
11.3
18.6
0.14
28.3
M
7.57
1830
401
910
390.0
45.6
68.7
5.5
0.118
0.021
0.039
0.013
0.10
0.43
0.8
9.6
11.9
0.05
7.4
SD
0.27
700.3
213.6
483.5
332.2
17.5
28.0
2.8
0.090
0.029
0.066
0.014
0.26
0.93
0.6
1.5
3.0
0.03
7.2
2
Min
7.26
602
168
369
152
13.4
35.9
1.2
0.070
0.010
0.006
0.003
< 0.1
0.27
–
–
0.60
0.07
1.3
Max
7.98
1839
996
3630
1984
63.6
179.2
10.1
0.317
0.053
0.091
0.029
0.90
4.66
–
–
0.69
0.15
27.0
M
7.68
1238.0
307.5
909.0
346.0
46.5
71.8
4.0
0.13
0.02
0.02
0.01
< 0.1
2.28
–
–
0.66
0.10
10.8
SD
0.22
378.47
303.3
797.6
436.1
15.5
33.7
2.2
0.07
0.01
0.02
0.01
0.27
2.42
–
–
0.03
0.03
9.3
3
Min
7.17
660.0
180
353.0
124.0
28.2
46.4
1.0
0.080
0.008
0.018
0.002
< 0.1
0.11
0.4
–
–
0.01
–
Max
8.19
3255
591
1430
4424
94.2
116.9
4.5
0.460
0.110
0.042
0.041
0.25
1.09
2.0
–
–
0.09
–
M
7.72
2261
364
831
357
49.1
78.2
2.9
0.182
0.032
0.028
0.023
< 0.1
0.20
0.9
–
–
0.06
–
SD
0.26
752.6
128
302.5
1091.6
13.7
17.3
0.9
0.091
0.023
0.008
0.012
0.08
0.29
0.4
–
–
0.03
–
4
Min
7.15
863
140
361
72
18.5
28.9
4.0
0.038
0.002
0.012
0.001
–
0.1
–
–
–
–
–
Max
7.80
1007
460
1950
466
41.8
60.5
7.3
0.24
0.008
0.049
0.022
–
0.34
–
–
–
–
–
M
7.5
889.5
260.0
884.0
235.0
29.8
52.5
5.6
0.140
0.004
0.018
0.003
–
0.27
–
–
–
–
–
SD
0.2
55.7
110.3
583.9
137.3
7.6
11.8
1.2
0.069
0.002
0.017
0.009
–
0.11
–
–
–
–
–
5
Min
7.15
1110
120
360
152
19.9
35.7
1.7
0.048
0.012
0.001
0.034
< 0.1
0.10
0.4
–
–
0.03
–
Max
8.05
3490
488
1179
720
72.8
112.8
13.1
0.430
0.160
0.035
0.101
0.10
0.66
0.8
–
–
0.80
–
M
7.50
2237.5
410.3
825.5
368.0
42.3
73.9
5.2
0.155
0.057
0.012
0.075
< 0.1
0.32
0.6
–
–
0.08
–
SD
0.22
730.9
112.7
236.0
151.1
13.8
19.8
3.8
0.124
0.041
0.010
0.026
0.05
0.15
0.1
–
–
0.30
–
6
Min
7.17
1136
70
183
114
8.4
20.9
0.7
0.034
0.001
0.017
0.003
< 0.1
0.10
0.2
–
–
0.02
–
Max
9.30
6032
601
3390
556
33.3
64.0
13.0
0.380
0.437
0.099
0.041
0.25
0.59
0.9
–
–
0.07
–
M
7.73
2114
235
501
214
15.9
38.8
4.10
0.093
0.055
0.032
0.006
< 0.1
0.20
0.4
–
–
0.05
–
SD
0.55
1226
123
646
108
5.8
11.8
4.0
0.102
0.148
0.029
0.012
0.09
0.17
0.2
–
–
0.01
–
7
Min
6.80
257
200
564
226
26.9
46.0
1.1
0.111
0.001
0.024
0.003
< 0.1
0.12
0.5
–
–
0.01
19.2
Max
8.65
4648
540
1292
1608
76.0
128.8
33.0
0.790
0.190
0.093
0.040
1.00
0.77
5.3
–
–
0.14
28.2
M
8.20
1833
444.5
972
388
58.9
97.9
4.7
0.170
0.020
0.040
0.030
< 0.1
0.31
0.7
–
–
0.08
21.0
SD
0.52
978.1
82.9
199.0
282.2
13.6
20.3
7.9
0.152
0.040
0.025
0.012
0.27
0.19
1.3
–
–
0.03
3.7
8
Min
8.25
478
410
618
168
32
58.5
0.5
0.230
0.014
0.006
0.012
< 0.1
0.3
0.6
–
–
0.03
–
Max
9.25
2008
1150
3210
1090
58.4
117.3
17.4
0.470
0.044
0.091
0.039
0.3
0.64
0.7
–
–
0.10
–
M
8.3
1602.5
592.0
1283.5
361.0
50.9
95.8
3.3
0.470
0.019
0.082
0.027
< 0.1
0.36
0.7
–
–
0.07
–
SD
0.3
555.9
203.3
846.3
230.1
10.4
18.4
4.6
0.088
0.011
0.031
0.008
0.09
0.13
0.0
–
–
0.03
–
9
Min
7.10
803
20
77
80
9.5
36.4
1.7
0.042
0.003
0.007
0.003
< 0.1
0.16
0.3
–
–
0.03
1.3
Max
8.50
2915
1450
4041
5004
99.1
150.4
13.2
0.438
0.092
0.417
0.140
1.00
1.16
3.3
–
–
0.13
13.7
M
7.72
1875.0
445.0
937.0
420.0
54.6
79.8
5.9
0.125
0.045
0.029
0.019
0.10
0.62
0.8
–
–
0.09
3.6
SD
0.31
353.2
275.6
702.5
974.8
14.2
22.9
2.6
0.067
0.028
0.065
0.027
0.30
0.26
0.4
–
–
0.02
3.5
10
Min
7.10
1582
260
459
194
28.0
45.7
1.6
0.145
0.018
0.031
0.022
< 0.1
0.19
0.6
5.1
4.7
0.00
–
max
7.88
2750
875
1854
858
71.5
117.4
10.9
0.202
0.026
0.059
0.052
0.40
0.43
2.1
12.8
18.4
0.09
–
M
7.32
1957
642
1139
530
46.3
81.6
5.4
0.187
0.021
0.047
0.023
0.20
0.34
1.0
9.9
8.0
0.07
–
SD
0.23
378.7
184.3
306.0
143.9
8.9
16.0
2.5
0.027
0.008
0.013
0.012
0.11
0.08
0.5
2.9
5.1
0.03
–
11
min
6.95
1143
128
75
138
21.8
49.2
0.7
0.016
0.001
0.018
0.001
< 0.1
0.23
0.6
6.1
1.2
0.00
1.1
max
8.26
4510
1998
3721
1882
94.2
142.8
17.4
0.291
0.108
0.104
0.044
0.80
0.63
1.5
19.8
14.5
0.23
28.2
M
7.67
2083.0
525.0
927.0
342.0
59.0
83.4
6.2
0.121
0.010
0.036
0.023
0.30
0.34
0.9
10.4
6.9
0.11
9.9
SD
0.19
605.1
280.0
538.6
285.2
13.3
18.3
3.0
0.063
0.021
0.016
0.011
0.24
0.15
0.2
3.5
2.5
0.05
7.3
12
min
6.74
1375
290
596
234
25.2
45.4
1.5
0.020
0.026
0.006
0.032
< 0.1
0.26
0.7
1.0
3.9
0.02
5.4
max
7.75
4950
3150
4000
2994
78.6
134.4
9.1
0.271
0.093
0.131
0.197
1.50
13.2
2.2
12.3
18.0
0.09
34.7
M
7.39
2038.5
705.0
1121.5
487.0
52.8
78.2
3.6
0.142
0.048
0.017
0.113
0.10
0.43
0.9
6.8
8.2
0.06
10.3
SD
0.24
832.4
550.8
751.6
618.5
12.2
20.8
1.6
0.056
0.017
0.023
0.043
0.30
2.47
0.3
2.6
2.5
0.02
10.2
During the research, in the case of most standard parameters for wastewater discharged to the sewer system in Lodz, exceedances were observed. The results in Table
3
show that only pH, concentration of Zn and Pb, as well as the HOI and PC always met the requirements given in Table
2
. The median values were exceeded only in the case of 2 parameters at 3 sampling points. At sampling point no. 8, the median COD was equal to 1283.5 mg/L, while the median BOD
5
was equal to 642 mg/L at sampling point no. 10 and 705 mg/L at no. 12. Summarizing the results of the analysis, it can be concluded that at sampling point no. 8, 10, and 12, the wastewater has the highest levels of organic compounds. The concentration of TSS was also high, and the limit values for wastewater discharged into the sewage system were sometimes exceeded. All points: 8, 10, and 12 are located on sanitary sewers. In point no. 10 and 12, the flowing wastewater contains a large share of industrial sewage (e.g., from the food industry), while point 8 is located in the old part of the city with a dense housing development.
However, Table
3
does not take into account a few cases when very significant, occurring within a short period of time, differences of quality parameters in relation to the values usually observed at a given sampling point, were found. These could be the indicative of illegal discharge of pollutants into the sewer system. Such situations were observed at sampling point no. 7 on 16/01/2019 at 9 a.m., when BOD
5
, COD, and TSS significantly exceeded the required values and were equal to: 9600, 17,955, and 11,500 mg/L, respectively. In sampling point no. 1 on 09/11/2019 at 9 a.m., a very high HOI of 68 mg/L was found, and in sampling point no. 12 on 14/01/2020 at 16 p.m. high Cr concentration of 3.091 mg/L. These situations, despite the occurrence of significant deviations from the typical wastewater composition, did not pose a threat to the GWWTP operation. During the measurement campaign, there was never a case in which the composition of wastewater in the sewer system could reduce the efficiency of the sewage treatment process.
In the case of the sampling points on the combined sewer system (sampling points no. 2, 6, and 9), the quality wastewater parameters during wet weather significantly exceeded the permissible values for the wastewater discharged into the waters. In Poland, in the case of combined sewer overflows (CSOs), only the number of discharges is standardized (maximum 10 per year—according to the Regulation of the Minister of Maritime Economy and Inland Navigation); however, the surface water protection also requires the reduction of pollutant emissions by CSOs. This is particularly important when the recipients of wastewater are small urban rivers, and this is the case in Lodz.
Figure
2
summarizes the results of the analysis of the wastewater composition in the sewer system (data from all sampling points) and the results of the analysis of sewage flowing into the GWWTP, for dry and wet weather. Greater differentiation of composition was observed in wastewater from the sewer system than at the point of inflow to GWWTP, which is surely a desirable phenomenon in terms of ensuring the stability of the treatment process, especially the biological stage. Higher values of wastewater quality parameters were generally observed during dry weather, especially in the case of CD, COD, TSS, TKN, and NH
4
–N.
Fig. 2
Composition of wastewater flowing into GWWTP and in the sewer system (median, 25–75%, min–max):
a
,
b
,
c
inflow to GWWTP during dry weather;
d
,
e
,
f
inflow to GWWTP during wet weather;
g
,
h
,
i
wastewater in sewer system during dry weather;
j
,
k
,
l
wastewater in sewer system during wet weather
The composition of wastewater in the sewage system in Lodz does not differ significantly from the composition observed in sewage systems in other cities in Poland and in the world [
36
,
37
,
38
,
39
,
40
,
41
,
42
–
43
]. However, it should be noted that the content of organic substances (BOD
5
and COD) was high at all sampling points. Comparing the obtained research results to the analyzes of the wastewater composition on the catchment area from a few years ago, a slight increase in the level of basic pollution indicators can be noticed; however, it should be emphasized that the previously conducted studies had a smaller range [
30
,
44
,
45
]. In recent years, an increase in the average values of the basic quality parameters in wastewater, such as BOD
5
, COD and TSS, has also been observed at the inflow to the GWWTP [
46
].
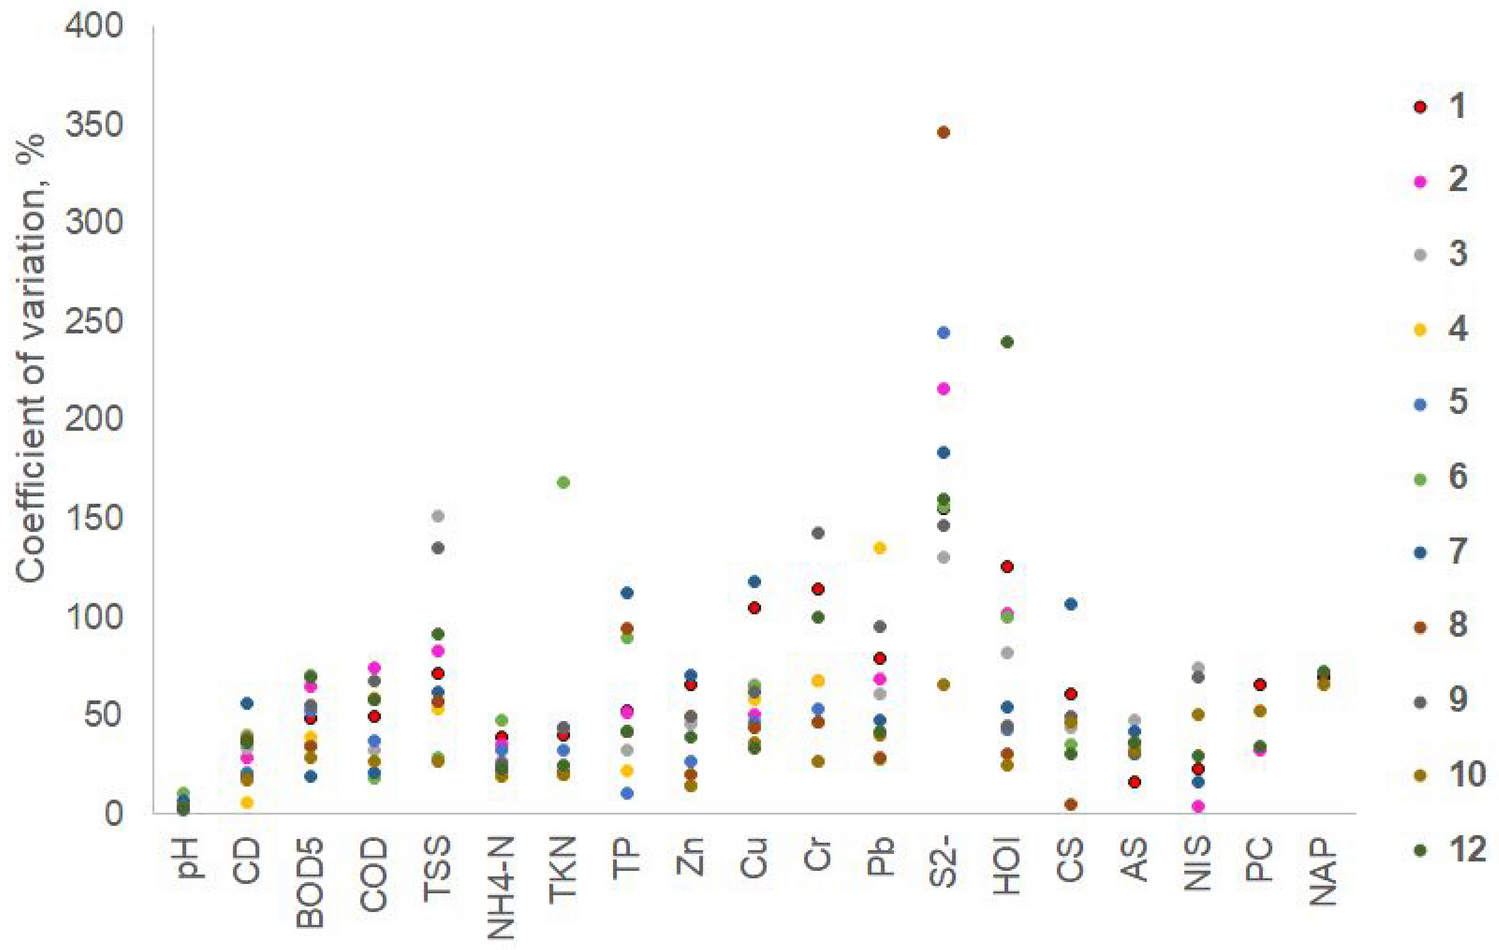
The assessment of the composition variability of wastewater in Lodz sewage system is shown in Fig.
3
, where the values of the coefficient of variation for the tested parameters at all sampling points are given. Only pH was characterized by low variability (CV < 25%); CD, TKN, NH
4
–N, Zn, and surfactants had an average variability (25% < CV < 45%); all other parameters had a high variability (45% < CV < 100%) except for sulfide, in which concentration was characterized by a very high variability (CV > 100%). Wastewater from sanitary sewers showed less variation in composition than wastewater from combined sewers. The lowest average values for all parameters were found at the sampling point no. 10 (CV = 30%), at point no. 4 (CV = 49%) and at point no. 5 (CV = 45%). At the other points, the mean values of the coefficient of variation for the parameters studied ranged from 50 to 65%.
Fig. 3
Coefficient of variation of wastewater composition in Lodz sewer system
For the quality parameters of wastewater tested in Lodz, Pearson correlation coefficients were determined, which are given in Table
4
. The results indicate that there are strong correlations between the basic parameters of wastewater quality: between BOD
5
and COD, TSS, NH
4
–N, TKN, and CS; between COD and NH
4
–N and TKN; between TSS and TKN, TP, Zn, Cu, HOI and CS. A strong negative correlation occurs between pH and CD, BOD
5
, COD, TSS, TKN, Cu and CS. However, pH was characterized by an extremely low coefficient of variation (between 2.28 and 10.72% for individual sampling points, average 4.04%). Very strong positive Pearson correlations were observed between CD and CS and between TSS and CS.
Table 4
Pearson correlations for wastewater quality parameters for all sampling points
Parameter
pH
CD
BOD5
COD
TSS
NH4–N
TKN
TP
Zn
Cu
Cr
Pb
S2−
HOI
CS
AS
NIS
PC
NAP
pH
1.000
−0.610
−0.818
−0.754
−0.539
−0.375
−0.559
−0.117
−0.477
−0.556
−0.006
−0.361
−0.098
−0.479
−0.571
0.156
0.166
0.281
−0.055
CD
1.000
0.526
0.342
0.893
0.081
0.419
0.609
0.742
0.761
−0.039
0.259
−0.006
0.835
0.903
−0.230
−0.381
−0.206
−0.095
BOD5
1.000
0.884
0.577
0.806
0.891
−0.076
0.369
0.355
0.270
0.093
0.241
0.483
0.553
−0.086
0.172
−0.407
0.073
COD
1.000
0.452
0.767
0.764
−0.208
0.103
0.364
0.055
0.247
0.230
0.211
0.459
−0.165
0.167
−0.232
−0.185
TSS
1.000
0.221
0.546
0.652
0.562
0.587
−0.008
0.165
0.145
0.792
0.947
−0.229
−0.298
−0.023
−0.239
NH4–N
1.000
0.837
−0.443
0.038
−0.043
0.343
−0.122
0.269
0.128
0.146
0.016
0.432
−0.443
0.085
TKN
1.000
−0.091
0.263
0.317
0.431
−0.074
0.395
0.455
0.513
−0.110
0.298
−0.456
−0.033
TP
1.000
0.275
0.415
−0.389
0.416
−0.008
0.536
0.583
−0.245
−0.669
0.356
−0.385
Zn
1.000
0.451
0.338
−0.113
0.233
0.623
0.625
0.202
−0.234
−0.438
0.443
Cu
1.000
−0.291
0.514
−0.008
0.576
0.663
−0.555
−0.506
−0.334
−0.344
Cr
1.000
−0.768
0.478
0.027
0.102
0.631
0.757
−0.242
0.548
Pb
1.000
−0.081
−0.011
0.161
−0.375
−0.653
0.176
−0.623
S2−
1.000
−0.167
0.265
0.478
0.158
−0.013
0.017
HOI
1.000
0.676
−0.409
−0.327
−0.424
0.156
CS
1.000
−0.090
−0.206
0.023
−0.245
AS
1.000
0.528
0.277
0.402
NIS
1.000
0.019
0.275
PC
1.000
−0.504
NAP
1.000
Multivariate statistical analysis
In order to identify similarities and differences between the composition of wastewater discharged from different parts of the city, the obtained research results were subjected to multivariate statistical analysis with the use of Statistica 13 software. Two methods were used: Principal Component Analysis (PCA) and Cluster Analysis (CA). Both methods are often applied to assess the composition of water and wastewater, to establish relationships between quality parameters and to identify sources of pollution [
31
,
47
,
48
,
49
,
50
,
51
–
52
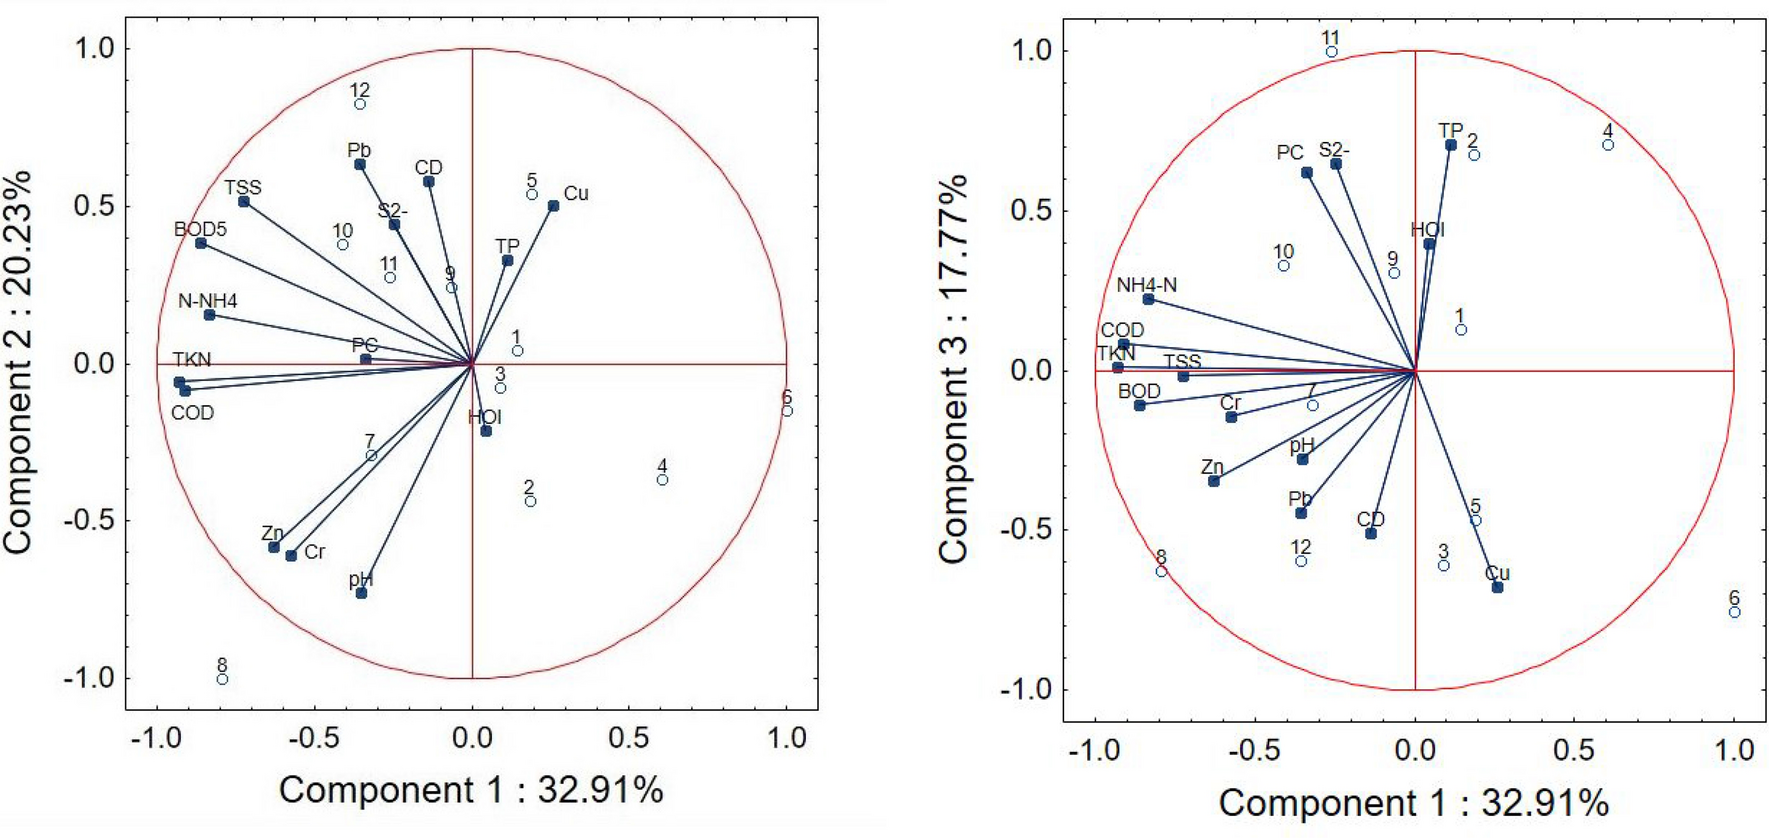
]. The analysis was based on the median of quality parameters for all wastewater sampling points in dry and wet weather, and separately for dry weather only. Results of surfactants (CS, AS, and NIS) and naproxen were not included due to the small number of performed tests. For all survey results (wet and dry weather), PCA was based on 3 components for which the cumulative percentage of explained variances was over 70% (PC1—32.91%, PC2—20.23% and PC3—17.77%). Basic sewage quality parameters: BOD
5
, COD, TSS, and TKN are well represented by the used coordinate system. TKN, COD, BOD
5
, NH
4
−N, TSS, Zn, and Cr are well correlated with the first principal component, while pH, conductivity (CD), Zn, Cr, and Pb are well correlated with the second principal component. TP, H
2
S, PC, and Cu are loaded to component 3. The absolute values loadings for all these parameters are greater than 0.3. As can be seen in Fig.
4
, there are 3 well-defined groups on the biplots. The first one is composed of BOD
5
, COD, TSS, NH
4
–N, TKN, and PC, and the second is composed of Zn, Cu, and pH. CD, Pb, Cu, TP, and sulfide form the third group.
Fig. 4
Biplots of pollutant concentrations and sampling points for all results—dry and wet weather
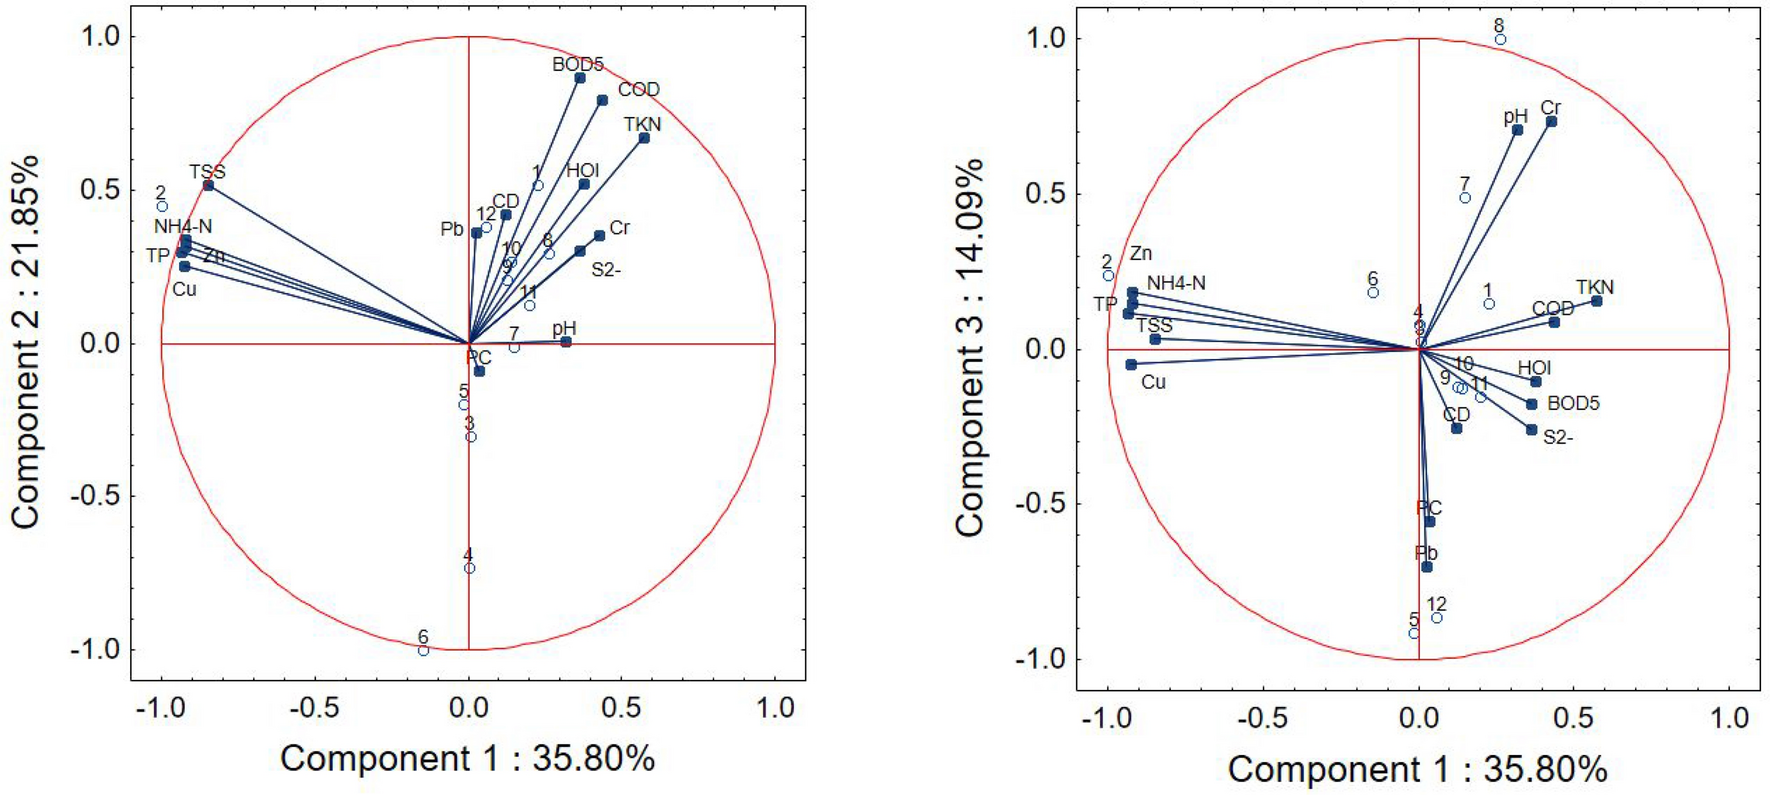
PCA for dry weather results was also based on 3 components for which the cumulative percentage of explained variances was over 70% (PC1—35.80%, PC2—21.85% and PC3—14.09%). TSS, NH
4
–N, TP, Zn, and Cu are well correlated with the first principal component; BOD, COD, and TKN are well correlated with the second principal component. pH, Cr, Pb, and PC are loaded to component 3. The absolute values loadings for all these parameters are greater than 0.3. As can be seen in Fig.
5
, there are 2 well-defined groups on the biplots. The first one is composed of BOD
5
, COD, TKN, HOI, Cr, Pb, CD, and S
2−
, and the second is composed of TSS, NH
4
–N, TP, Zn, and Cu. Conductivity (CD) and pH are not related to any group.
Fig. 5
Biplots of pollutant concentrations and sampling points for dry weather
The grouping of quality parameters on biplots is not unambiguous and is different for all results and for the results obtained for dry weather. Therefore, their use, e.g., for the selection of key parameters monitored in a combined sewer system, may be difficult. For example, the suspended solids for dry weather correlate well with TP, NH
4
–N, Cu, and Zn, whereas for all results the correlation TSS with the metals is not observed, while there is a correlation with BOD
5
.
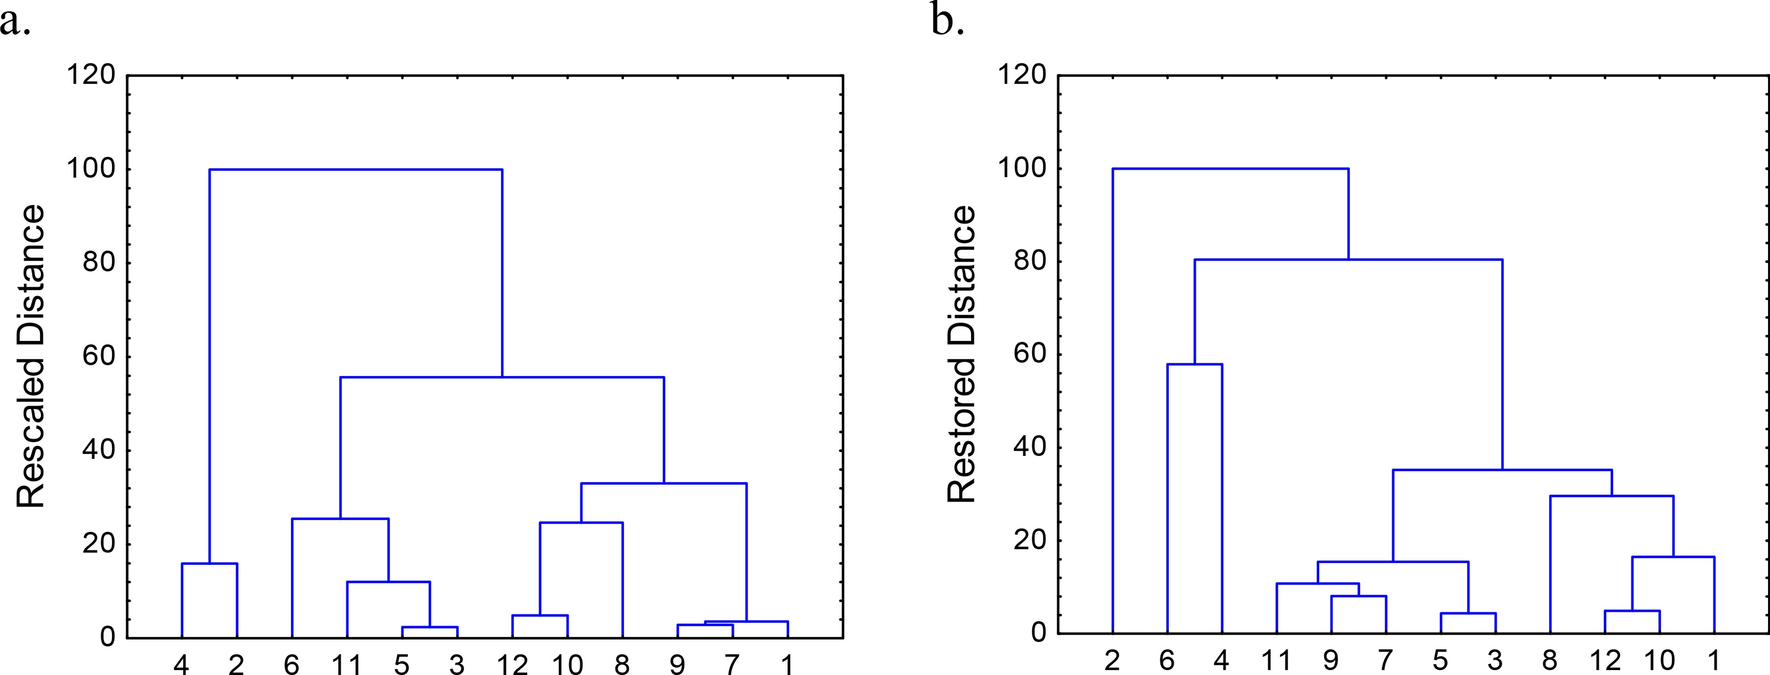
For better discrimination of sampling points and city districts discharging wastewater of similar composition, Cluster Analysis was used. In this study, Ward’s method and Euclidean distance was used. According to the dendrogram in Fig.
6
a for all survey results, 3 clusters can be distinguished. The first group includes sampling point no. 2 and 4, and the second group includes sampling point no. 3, 5, 11 and 6. The remaining points are in the third group. Dendrogram for dry weather (Fig.
6
b) results also combines the sampling points into 3 groups but in a slightly different way. On both dendrograms, sampling points no. 8, 10, 12, and 1 (i.e., the inflow to GWWTP), are located in one cluster. The composition of wastewater at these points is distinguished by a high content of organic compounds, TSS, and TKN. Both dendrograms indicate a similar composition of wastewater at sampling points no. 3 and 5, which are located on sanitary sewers in residential areas with a small share of industry. It is interesting to link points no. 7 and 9 on both dendrograms, because point no. 9 is located on the combined sewer discharging sewage from the central part of the city, and point no. 7 is on the sanitary sewer serving a relatively small catchment area with a predominance of residential buildings. This may be due to the fact that the stormwater runoff from the city center is characterized by a high content of pollutants, also organic. The sampling points located on the combined sewer system, i.e., no. 2, 6, 9, and 11 on both dendrograms are in different clusters, which proves the large influence of stormwater on the variability of municipal sewage composition. It should be noted that the composition of wet weather wastewater is significantly influenced not only by pollutants washed off from the catchment area, but also by sewer sediments. The share of sewer solids in the total suspended solids load in combined sewage can reach even 20–80% [
53
]. This also causes an increase in the concentration of other contaminants associated with TSS.
Fig. 6
Cluster analysis for all results—dendrogram for sampling points;
a
all results;
b
dry weather results
The obtained results are only partially consistent with the results of Principal Component Analysis, which not identify exactly the same grouping. The statistical methods used in this research generally were, according to other authors, more useful in the analysis of the composition of wastewater in industry, WWTPs, and in the selection of optimal solutions in the wastewater management [
49
,
54
,
55
]. The use of this type of analysis as tools useful in wastewater management for a large city would require a much wider measurement campaign, both in terms of the number of sampling points and the frequency of tests. This method of sewage system monitoring, based on laboratory tests of sewage samples taken from sewers, also does not allow for the detection of threats to WWTP and receiving waters, resulting, e.g., from the discharge of toxic substances into the sewer system or extremely large loads of pollutants.
The conducted research allowed for a more precise understanding of the composition and variability of wastewater in Lodz sewer system. However, a full assessment of wastewater composition to enable optimal, sustainable operation and development of the sewage disposal and treatment system requires much more extensive research and the use of other approaches. Modern techniques of online wastewater composition monitoring, the use of statistical and forecasting methods currently allow for the creation of reliable, precise solutions that facilitate the operation and modernization of sewage systems in cities [
43
,
56
,
57
–
58
]. Nowadays, more and more wastewater quality parameters can be measured using online sensors, also with the use of UV–Vis spectroscopy. This type of measurement techniques is quite expensive solutions, sometimes additionally troublesome in operation. Therefore, it is important to determine the optimal scope of monitoring. Establishing correlations between the various wastewater components can help to reduce the number of parameters monitored or replace one parameter with another easily measurable one [
59
,
60
]. The last decade has seen an explosion of new technologies and online measurement techniques. These include, for example, cheap online self-calibrating gas sensors for measuring volatile pollutants in water and sewage [
61
], microbial fuel cell biosensors for the determination of BOD or toxicity [
62
,
63
]. Despite great progress, these methods still need to be developed in order to improve sensor performance, reliability and cost-effectiveness. The solutions mentioned will not exclude the need for laboratory tests. However, they will make it possible to limit them and, above all, to warn WWTP of inflow of large pollutant amount, which is particularly important in the case of combined sewer systems. A monitoring system with 4 online station each of which measures 8 wastewater quality parameters is currently under construction in Lodz. This system will enable early warning and sustainable management of wastewater treatment plant and minimization of pollutant emission to aquatic environment from the city. Research on sewage quality with online sensors conducted on one of CSO and on the inflow to GWWTP in Lodz showed that these types of stations can be successfully used for assessment of sewage composition and amount of pollutant emissions from the sewage system [
33
,
45
]. Proper selection and placement of online wastewater quality monitoring stations in the sewage system, as well as measurements of flows in the sewers and rainfall monitoring will allow not only to create a modern system forecasting the inflow to WWTP, but also to obtain valuable, comprehensive data on the wastewater composition and variability in the city necessary for the development and modernization of wastewater management.
Conclusions
The conducted research has shown that the quality parameters of wastewater discharged into the sewer system in Lodz sometimes exceed the legislative requirements. At most sampling points, such cases occurred only sporadically, but at 3 points, the median content of organic substance in the sewage was higher than the permissible values (BOD
5
and COD). During the measurement campaign, several high exceedances of the concentration of one or more pollutants were identified, which may indicate illegal discharge of industrial wastewater. No situations were observed, in which the composition of wastewater flowing into the treatment plant would endanger the treatment process and its efficiency. However, such situations occurred outside the period of the measurement campaign.
In the samples of sewage collected from combined sewers during wet weather, significant exceedances of the pollutant concentrations established for sewage discharged into the waters were found, which indicates that during combined sewer overflow, small rivers in Lodz are exposed to the discharge of large loads of pollutants.
Wastewater composition was rather typical for municipal sewage, but the BOD
5
and COD values were quite high. Most of the investigated wastewater quality parameters were characterized by medium to high coefficient of variation. The study carried out showed high Pearson correlations between selected indicators of wastewater quality, which can be used in the development of a future wastewater composition testing plan and allow a reduction in the number of parameters to be controlled.
The multivariate statistical analysis carried out identified some similarities in the composition of wastewater collected at different points in the sewerage system, but the results are not conclusive. Obtaining full knowledge of the wastewater characteristics in the sewage system would require a significant extension of the scope of monitoring.
Traditional monitoring of wastewater quality, based on laboratory tests, does not allow for WWTP warning about the inflow of wastewater that may threaten the treatment process. It seems that continuous monitoring with the use of online sensors is becoming a necessity, especially in the case of large hybrid sewage systems. The use of data from online quality monitoring stations and other measurement systems—of wastewater flow in sewers and rainfall—allows the development of modern tools helpful in the operation and modernization of sewage disposal system in cities.
Publisher's Note
Springer Nature remains neutral with regard to jurisdictional claims in published maps and institutional affiliations.
References
Madoux-Humery et al. (2013) Temporal variability of combined sewer overflow contaminants: Evaluation of wastewater micropollutants as tracers of fecal contamination10.1016/j.watres.2013.04.030
Liu et al. (2015) Role of rainfall and catchment characteristics on urban stormwater quality10.1007/978-981-287-459-7
Becouze-Lareure et al. (2016) Source characterization and loads of metals and pesticides in urban wet weather discharges10.1080/1573062X.2015.1011670
Masi et al. (2017) Constructed wetlands for combined sewer overflow treatment: Ecosystem services at Gorla Maggiore10.1016/j.ecoleng.2016.03.043
Le et al. (2017) Daily wastewater pollutant dynamics with respect to catchment population structure10.1080/1573062X.2017.1325498
Miller and Hutchins (2017) The impacts of urbanisation and climate change on urban flooding and urban water quality: A review of the evidence concerning the United Kingdom10.1016/j.ejrh.2017.06.006
Unknown ()
Unknown ()
Launay et al. (2016) Organic micropollutants discharged by combined sewer overflows - Characterisation of pollutant sources and stormwater-related processes10.1016/j.watres.2016.07.068
Hannouche et al. (2017) Stochastic evaluation of annual micropollutant loads and their uncertainties in separate storm sewers10.1007/s11356-017-0384-5
Palli et al. (2019) Occurrence of selected pharmaceuticals in wastewater treatment plants of Tuscany: An effect-based approach to evaluate the potential environmental impact10.1016/j.ijheh.2019.05.006
Ahmed et al. (2020) Can wastewater analysis be used as a tool to assess the burden of pain treatment within a population?10.1016/j.envres.2020.109769
Liu et al. (2020) Ecological impact assessment of 110 micropollutants in the Yarlung Tsangpo River on the Tibetan Plateau10.1016/j.jenvman.2020.110291
Comber et al. (2020) Seasonal variation of contaminant concentrations in wastewater treatment works effluents and river waters10.1080/09593330.2019.1579872
Eriksson et al. (2005) Chemical hazard identification and assessment tool for evaluation of stormwater priority pollutants10.2166/wst.2005.0031
Pistocchi (2020) A preliminary pan-European assessment of pollution loads from urban runoff10.1016/j.envres.2020.109129
Park et al. (2010) Probability mass first flush evaluation for combined Sewer discharges10.1016/S1001-0742(09)60198-4
Qin et al. (2016) Modeling middle and final flush effects of urban runoff pollution in an urbanizing catchment10.1016/j.jhydrol.2016.01.038
Ma et al. (2018) Pollutant transport analysis and source apportionment of the entire non-point source pollution process in separate sewer systems10.1016/j.chemosphere.2018.07.184
Praus (2019) Principal component weighted index for wastewater quality monitoring10.3390/w11112376
Jamshidzadeh and Tavangari Barzi (2020) Wastewater quality index (WWQI) as an assessment tool of treated wastewater quality for agriculture: a case of North Wastewater Treatment Plant effluent of Isfahan10.1007/s11356-019-07090-x
Unknown ()
Bach et al. (2014) A critical review of of integrated urban water modeling—Urban drainage and beyond10.1016/j.envsoft.2013.12.018
Bonhomme and Petrucci (2017) Should we trust build-up/wash-off water quality models at the scale of urban catchments?10.1016/j.watres.2016.11.027
Brzezińska et al. (2018) Predictive model of pollutant loads discharged by combined sewer overflows10.2166/wst.2018.050
Unknown ()
Fu et al. (2020) Wastewater discharge quality prediction using stratified sampling and wavelet de-noising ANFIS model10.1016/j.compeleceng.2020.106701
Unknown ()
Unknown ()
Wojcieszyńska and Guzik (2020) Naproxen in the environment: its occurrence, toxicity to nontarget organisms and biodegradation10.1007/s00253-019-10343-x
Gasperi et al. (2012) Priority pollutants in urban stormwater: Part 2—Case of combined sewers10.1016/j.watres.2011.09.041
Brombach and Fuchs (2001) (pp. 1-01) Abschlussbericht Langfassung. ATV-DVWK-Forschungsfonds
Kafi et al. (2008) Spatial variability of the characteristics of combined wet weather pollutant loads in Paris10.1016/j.watres.2007.08.008
Stankowska et al. (2016) Analysis of the sewage treatment system of the Silesian agglomeration10.2429/proc.2016.10(1)055
Unknown ()
Sun et al. (2016) Characteristics of water quality of municipal wastewater treatment plants in China: Implications for resources utilization and management10.1016/j.jclepro.2016.05.068
Unknown ()
Carreres-Prieto et al. (2020) Wastewater Quality Estimation through Spectrophotometry-Based Statistical Models10.3390/s20195631
Zawilski et al. (2014) Opportunities for sustainable management of rainwater: Case study of Łódź10.1016/j.ecohyd.2014.07.003
Brzezińska et al. (2016) Assessment of pollutant load emission from combined sewer overflows based on the online monitoring10.1007/s10661-016-5461-6
Unknown ()
Drozdova et al. (2015) A survey of heavy metals in municipal wastewater in combined sewer systems during wet and dry weather periods10.1080/1573062X.2013.831913
Bayo and Lopez-Castellanos (2016) Principal factor and hierarchical cluster analyses for the performance assessment of an urban wastewater treatment plant in the Southeast of Spain10.1016/j.chemosphere.2016.04.038
Cristóvão et al. (2016) Fish canning industry wastewater variability assessment using multivariate statistical methods10.1016/j.psep.2016.03.016
Barcellos et al. (2021) Downsizing water quality monitoring programs in river basins in Brazil10.1080/1573062X.2021.1877740
Moufid et al. (2021) Wastewater monitoring by means of e-nose, VE-tonque, TD-GC-MS, and SPME-GC-MS10.1016/j.talanta.2020.121450
Unknown ()
Lourenço et al. (2006) UV spectra analysis for water quality monitoring in a fuel park wastewater treatment plant10.1016/j.chemosphere.2006.03.041
Kiurski et al. (2015) Statistical methods as indicator of offset printing wastewater quality10.1007/s00477-014-1013-1
Qin et al. (2012) Wastewater quality monitoring system using sensor fusion and machine learning techniques10.1016/j.watres.2011.12.005
Sandoval et al. (2013) The evaluation of rainfall influence on combined sewer overflows characteristics: the Berlin case study10.2166/wst.2013.524
Lepot et al. (2016) Calibration of UV/Vis spectrophotometers: A review and comparison of different methods to estimate TSS and total and dissolved COD concentrations in sewers10.1016/j.watres.2016.05.070
Hannouche et al. (2017) Assessment of total suspended solids (TSS) event load and its uncertainties in combined sewer system from continuous turbidity measurements10.1080/1573062X.2016.1254256
Azis et al. (2020) NH4+-N versus pH and ORP versus NO3−-N sensors during online monitoring of an intermittently aerated and fed membrane bioreactor10.1007/s11356-020-10534-4
Unknown ()
Do et al. (2019) Microbial fuel cell-based biosensor for online monitoring wastewater quality: A critical review10.1016/j.scitotenv.2019.135612
Tardy et al. (2021) Microbial fuel cell biosensor for the determination of biochemical oxygen demand of wastewater samples containing readily and slowly biodegradable organics10.1007/s10529-020-03050-5