C3i-Coordenação Interdisciplinar para a Investigação e Inovação, Instituto Politécnico de Portalegre, Portalegre, 7301-901, PT
Abstract
The use of industrial cooling for food preservation has been revealed to be an efficient and widely employed technique, from harvest time to final consumption by the customer. However, the most used method to generate that cold (based on the compression refrigeration cycle) requires a considerable amount of electric energy, especially if no appropriate energy efficiency measures are implemented in cold storage chambers. This fact contributes to the increased costs in electricity bills, reduction of competitiveness among companies and also to a negative impact in terms of global warming. To help companies define and implement the right efficiency measures for cold production, this work aims to develop a methodology for simulation and optimization of energy consumption in cold chambers by improving both constructive and operating parameters (external temperature, enclosure insulation, door opening time, etc.), which contribute to the infiltration of heat energy. It is also intended that this methodology determines which of those parameters have greater influence in energy consumptions, as well as to estimate possible savings resulting from the optimization process. Results obtained in a garlic cold chamber showed that it is possible to achieve energy savings of up to 40 % for an initial investment around 1,500 € in efficiency measures and a payback time among 2 and 5 years. On the other hand, parameters that had the greatest influence in energy consumptions were those directly related with thermal insulation of enclosures and entry of warm air within. Total contribution of these two parameters in the global consumption was about 95 %.
Introduction
From a long time ago, human beings have been well aware of the benefits of cold usage as a way to preserve food. This technique has shown itself to be very interesting in the horticultural industry, because further to decreasing the metabolic activity of microorganisms and oxidation of available nutrients, it also has the advantage of maintaining food properties for a longer period of time when compared with other well-known conservation strategies.
Cold generated in the horticultural industry is frequently obtained by a system which works by applying a compression cycle of a refrigerant fluid; this methodology has provided until the present time a good price/efficiency ratio. In this cycle the refrigerant, usually a hydrocarbon compound, is subject to a transformation of physical states which leads it to transport heat from the evaporator (located in the chamber) to the condenser (located outside), in accordance with the scheme presented in Fig.
1
[
1
].
Fig. 1
Operation of the vapor-compression refrigeration cycle
It is commonly observed that refrigeration systems are responsible for a large amount of electric energy consumption in many industrial plants, which are mainly due to compressor operation.
Energy demands in European food industry have been growing at a rate of 1.8 % per year [
2
]. One of the reasons contributing to that increase is energy losses found in several equipments existing in the industrial process. These losses are associated with lower energy efficiencies of equipment and with the lack of an appropriate maintenance plan, producing several drawbacks: large unnecessary energy consumptions, expensive electric bills and problems for the preservation of the environment [
3
]. In refrigeration systems, one may easily detect specific issues like damaged gaskets installed on doors, lack of thermal insulation in refrigerant pipework, frequent and unnecessary human access in chambers, large internal temperature variations or compressor operation at full charge when, sometimes, it is not required.
Although the importance of energy efficiency measures aiming to reduce energy waste and improve the competitiveness of companies are recognized, there are some obstacles which hamper implementation of such measures:
the majority of companies found in the food industry are small and do not consume energy in an intensive way, therefore concerns with energy efficiency are a matter of lower importance [
2
];
the complexity of the industrial processes involved and the diversity of manufactured products, which create difficulties to conduct rigorous studies for energy consumption optimization;
a lack of knowledge or awareness of companies about these issues.
Although in the last years no significant improvements in energy savings were observed (just 0.2 % per year), the truth is that the vastness of the food industry makes it one of the areas with a huge potential for energy optimization [
2
], therefore justifying a greater attention.
Numerous studies have been conducted to create new measures of optimization which may be technically and economically viable, as well as to evaluate potential energy savings and also other benefits. Table
1
shows some of those measures and their advantages [
3
,
4
].
Table 1
Some energy efficiency measures and their advantages
Measures
Advantages
Use of variable-speed drive in compressor and air circulation fans
Energy savings of up to 20 %
Soft start of motors
Increases life of motors and bearings
Reduction of internal temperature variation
Energy savings of up to 4 %
Lengthens preservation time of food
Use of electronic expansion valve
Energy savings of up to 20 %
Avoids the liquefaction of refrigerant fluid in compressor
Creation of a gap between packaged products of up to half of their size
Improves cold air circulation and heat removal
Optimization of fan speed as a function of product quantity
Reduction of heat released by fans
Replacement of refrigerant (every 10 years)
Energy savings of up to 10 %
Installation of air diffusers and other devices to guide air circulation inside chambers
Avoids air swirling
Reduces energy consumption in fans
Computer simulations used to predict energy performance of cold chambers when new efficiency measures are applied have gained a growing popularity in experimental tests, because they are faster and may even provide results with an acceptable accuracy. In many situations, these simulations replace the use of prototype modeling with a large number of benefits. Currently the stakes are centered in the optimization of internal air distribution systems by employing a technology called computational fluid dynamics (CFD). This visual and mathematic modeling technique divides space in small finite elements (discretization) and, for each one, applies fundamental equations of thermodynamics, mass and energy conservation to calculate several variables like temperature, air speed and air flow orientation. It is a method to obtain estimates in the local and global domains of the chamber, and there are some studies that predict temperatures with errors of around 3 % [
5
,
6
]. However, it is worthwhile to say that CFD is suitable to estimate physical phenomena occurring inside the chamber and never within refrigerant fluid or in any of the four components of the refrigeration cycle; its use is therefore not convenient to predict accurately global electric energy consumption.
Other studies have been developed to simulate consumption using mathematic models for each one of the four main components and also for the refrigerant fluid. These models require the measurement and insertion of a set of defined input parameters (external temperature, product properties, chamber’s geometry, etc.); when this step is completed, thermodynamic equations use this data and are employed to estimate not only energy consumption but also other relevant output quantities (e.g. COP, chamber and refrigerant temperatures, etc.) [
7
,
8
]. There are some input parameters which do not have to be measured with instruments; instead, they can be automatically determined by tabular interpolations or polynomial regression analysis [
9
].
Complete modeling of cold chamber ought to predict two types of typical behaviors [
9
]:
transient behavior: it happens during the start/stop of the compressor and simulates the complex sequence of states observed in refrigerant fluid and in the remaining system until an equilibrium point is achieved;
a steady-state behavior: it happens when the compressor is operating normally and continuously; at this stage the refrigerant has a fluent and non-interruptible flow.
The models integrating the transient behavior may generate results for energy consumption with minimum relative deviations of 2 % [
10
,
11
]. Other models just apply the steady-state behavior to simplify and to increase speed calculation, although they give less precise results with deviations of about 5 % [
12
]. A compromise between precision and speed calculation must be done to choose the right model that best suits all needs.
Considering that each one of the basic components of the refrigeration cycle may be represented by an independent mathematical sub-model, simulation of the entire system is made through calculation and sharing of physical data about the refrigerant among all those sub-models. In this way, outputs generated by one of them will fit as inputs for the other one (Fig.
2
).
Fig. 2
Data sharing among all mathematic sub-models for each component [
9
]
Considering also that there are several variables at play and some of them are dependent on others, the calculation of each one employs techniques to solve systems of differential equations (Euler’s method, Runge–Kutta, etc.). Other iterative algorithms may equally be applied to get final results. By a successive substitution of a set of initial conditions, results are determined until some convergence criteria is fulfilled [
9
].
Many models were conceived to optimize a specific element of the system: replacement of refrigerant fluid by a new one [
13
], installation of a variable-speed compressor [
8
] or development of a new thermal insulation for the enclosure [
14
]. However, research conducted by Eames et al. [
7
] has a more generic domain of application in food refrigeration systems, because apart of being able to simulate energy consumption and other relevant variables, it may also evaluate the behavior of that consumption when varying some input parameters. This research may obtain results with relative deviations of about 8 %, but during its development efforts were employed to reduce the number of input parameters (36, in this case), making the model practical and less difficult to use. This may contribute negatively to the accuracy of results, which means that it shall be used in situations where such deviations are acceptable.
Other research [
15
] not only allows estimating the same energy consumptions and variables with similar errors, but also offers the possibility to determine minimum costs associated with the construction of the chamber through the optimization of several components during the design process (e.g. heat transfer area of evaporator).
Some recent in refrigeration technologies (like Peltier’s and thermoacoustic’s effect), although they are not widely known because of high initial costs, lower the values of COP and premature state of development; some mathematic models are available for them to evaluate energy performance. There is research that simulates COP values with deviations of around 7 % [
16
,
17
].
The recently discovered technology of nanofluids (refrigerant fluids which integrate special particles, giving them high thermal conductivities) has a large potential to improve energy efficiency in vapor-compression refrigeration systems, but currently existing models for them require a lot of refinements to be of practical usage. It is expected that in the future many advances will occur to improve such models [
9
].
Other expectations include development of new models that use final simulation results and apply decision techniques based on knowledge and methodology of the engineering to solve key problems introduced by users and even to suggest alternative solutions [
9
]. These techniques may be very promising in automatic selection of the best energy efficiency measures to apply, taking into account a set of initial criteria.
In spite of the wide range of existing computer models to simulate cold chambers based on vapor-compression refrigeration cycle, up until now a few of them may be used as a simplified tool to help in the selection of most appropriate energy efficiency measures and their corresponding advantages. There are also a few studies that investigated quantitatively which elements of cold chambers and related practical behaviors have a major impact in final consumptions; this information is useful to define which aspects must be observed and improved in first place, for example, when carrying out an energy audit.
In this way, present work is aimed to give a contribution to the development of an effective methodology that allows:
to estimate current energy consumption of cold chambers;
to help the user in the selection of the most suitable energy efficiency measures;
to predict potential energy savings resulting from the application of such measures and their economic feasibility;
to evaluate which characteristics of the chamber have the greatest influence in energy consumption.
Methods
Methodology to estimate and optimize energy consumptions
The methodology developed during the present work is based on an analytical strategy that determines all energetic components involved, each one referring to a specific thermal load that enters the chamber through several ways (heat transferred by enclosure or released inside the product, infiltration of external warm air, etc.).
After inserting a list of input parameters associated with the characteristics of the chamber in a spreadsheet (see Table
2
), the methodology uses suitable mathematic formulae to predict each one of the energetic components and, finally, the global energy consumption. By varying one or more of those input parameters as a result of the application of one or more efficiency measures, it is possible to estimate energy savings in a quantitative way as well as preliminary costs and payback time associated with them.
In order to reduce inner temperature of the chamber and to keep it at a desired level, the refrigerant fluid must retain a specific amount of heat, transport it and release it to the external environment.
According to the principle of energy conservation, total heat to be removed is equal to the sum of all infiltrating thermal loads (see Eq.
1
).
All existing thermal loads can be classified into two main categories, according to their origin: internal and external. Figure
3
discriminates and classifies all of them, as documented in [
18
].
Fig. 3
Classification of thermal loads existing in cold chambers [
18
]
Next subchapters describe all formulae to calculate each thermal load specified in Table
2
. Unless otherwise stated, these formulae were transcribed and sometimes adapted from [
18
].
Thermal load transmitted through enclosures (Qtrans)
This kind of load includes infiltrated heat through chamber’s enclosures (walls, floor and ceiling), due to thermal conductivity associated with them.
Equation
2
defines heat energy (
Qtrans
i
) passing through the enclosure identified by number
i
.
Calculation of total thermal load transmitted by all enclosures (
Qtrans
) results from the sum of individual thermal loads determined above (Eq.
3
).
Thermal load released by temperature reduction of products (Qtemp red)
Lowering the temperature of all content inside the chamber implies the release of sensitive and latent heat, the latter one related to the physical transformation of water from liquid to solid. Therefore, it is imperative to know if the products will be preserved above or below the initial freezing point (that is, to use a refrigeration or a freezing process).
If products are kept to be refrigerated (temperature reduction only above initial freezing point), only removal of sensitive heat takes place and thermal load is given by Eq.
4
.
On the other hand, if products have to be frozen (temperature reduction below initial freezing point) then it is necessary to add both sensitive and latent heat (Eq.
5
).
Thermal load from metabolic respiration (Qresp)
This load is derived from heat released by metabolic reactions which occur inside living cells from fruits and vegetables, and it exists if these products are preserved above their initial freezing temperatures. Load may be determined from Eq.
6
.
Thermal load from infiltrated air (Qair)
This load comes from all warm air that infiltrates the chamber each time the door is opened, because of the difference in mass densities.
The study of thermal load from infiltrated air (
Qair
) is difficult to define. Since a stationary air flux is established, heat released by such a load may be estimated by applying Eq.
7
.
Factor
E
is strictly related to the presence of barriers against air passage located at the chamber’s entrance, every time the door is opened (e.g. air curtain device, PVC curtain).
Values for air-specific enthalpies (
hext
and
hint
) and air mass densities (
ρext
and
ρint
) were calculated using temperatures and relative humidities measured in practice, through Eqs.
8
and
9
(adapted from [
1
]):
psat vap
was estimated using an empirical formula developed by Herman Wobus, which depends on temperature of the air (see Eq.
10
) [
19
].
Values for each constant used in Eq.
10
are referred in Table
3
[
19
].
Table 3
Constants used in the Herman Wobus’s formula (Eq.
10
)
Constant
Value
c0
6.10780000
c1
0.99999683
c2
−0.90826951 × 10⁻²
c3
0.78736169 × 10⁻⁴
c4
−0.61117958 × 10⁻⁶
c5
0.43884187 × 10⁻⁸
c6
−0.29883885 × 10⁻¹⁰
c7
0.21874425 × 10⁻¹²
c8
−0.17892321 × 10⁻¹⁴
c9
0.11112018 × 10⁻¹⁶
c10
−0.30994571 × 10⁻¹⁹
Thermal load from electric equipment (Qele)
This load corresponds to all heat generated by electric equipment located inside the chamber, as is the case of light bulbs and circulating air fans. It results from the individual thermal contributions of each apparatus, and is given by Eq.
11
.
To make this calculation, it was assumed that lighting is turned on every time door is opened, which is in accordance to the practice behavior adopted in the company where experiments were performed. So, the working time of lighting (
te light
) is the same as total door opening time (
P
×
tdoor
).
It was also assumed that air fans operate simultaneously with the compressor, which means that the corresponding working times of both devices are equal. Compressors operate according to a start/stop process as a function of internal temperature; its operating time may be determined with a power quality analyzer connected to it.
Thermal load from people (Qpeople)
This load is provided by heat released by people because of their physical activities inside the chamber during every access that was done. In [
18
], it was exposed an equation to estimate thermal power released by people, but since we are interested in the calculation of heat generated over time and because of required units for temperature, some modifications were introduced in the original equation to give Eq.
12
.
Global electric energy consumed by chamber
Total electric energy consumed by chamber corresponds closely to the energy used by compressor for its operation. Therefore, it is necessary to ascertain system efficiency (defined by COP) whose value may be estimated by Eq.
13
[
20
].
As a first approach, temperature of evaporator was assumed as being equal to the internal temperature of chamber, because both values may be considered similar in practice [
21
].
Electric energy consumed by compressor (in kW h) is directly related to the sum of all thermal loads explained above and with COP:
Echamber
is the indicator that will be evaluated to determine if energy consumption has already reached an optimum value, depending on the selected efficiency measures chosen to be simulated.
Methodology to define the most appropriate energy efficiency measures to apply
In this work, the simulation of energy consumption is structured in three stages: collection of data from the test chamber, insertion of data into a spreadsheet, and generation of output parameters—namely values for each thermal load and energy consumption of compressor. This process is illustrated in Fig.
4
.
Fig. 4
Flow of data in the proposed methodology
The flowchart shown in Fig.
5
explains in detail how the simulation of energy consumed must be inserted in the methodology to evaluate the best efficiency measures to be implemented.
Fig. 5
Process to define the most appropriate energy efficiency measures
At the moment of data collection a thorough analysis of the chamber is necessary to get accurate measurements for all input parameters, as described in Table
2
. These values must be converted to SI units before their introduction in the spreadsheet.
The process of optimization starts by simulating the actual energy consumption of the chamber using all data that were collected at first. After it, a specific measure of efficiency has to be defined to simulate the new optimized consumption provided by it, through the modification of appropriate input parameters (e.g. reduction of door opening time (
tdoor
or
P
) to decrease warm air infiltration, or rise of internal temperature (
Tint
) up to a value near to the one that is recommended for product’s preservation). If this new consumption is lower than the previous one (obtained from the original non-optimized input data or from the simulation of preceding measures), an evaluation is performed to determine if current measure is economically viable and if it can really be integrated in the industrial process. If so, the measure is validated and thereafter an analysis is made to check out the possibility to define other new measures to be examined. A new adjustment of the appropriate input parameters is done for the next measure (if possible), in the same way as it was described before. Otherwise, the optimization procedure ends with the following expected outputs of interest:
the viable efficiency measures to implement;
the potential energy savings resulting from the application of such measures.
Evaluation of economic feasibility for each selected measure was made through the calculation and analysis of the necessary initial investment and associated payback time. To determine initial investment, approximate prices of equipment needed were used to implement the measure and which were supplied by several commercial brands in Portugal. Installation costs were also considered. After obtaining the annual energy saving conferred by the measure (calculated via the difference between original and optimized consumptions and extrapolated for 1 year of homogeneous activity), payback time for the investment was estimated using Eq.
15
.
Experiment
Main goals of conducted experimental tests were
to evaluate deviations between real and simulated energy consumptions of the test chamber;
to determine which were the most influent thermal loads in final energy consumptions;
to carry out a sensitivity analysis in order to get an idea about which input parameters had a great relevance in final consumptions;
to estimate energy savings that may be achieved after simulating some efficiency measures by adjusting appropriate input parameters;
to evaluate economic feasibility of those simulated measures.
To evaluate performance and accuracy of the methodology in a real situation, experiments were made in a small horticultural company whose main activities are the purchase, conservation and sale of several kinds of fruits and vegetables provided by agricultural suppliers. Conservation is done by simply accommodating received food at room temperature or using refrigeration processes. For this last method, the company has eight available cold chambers, each one defined to preserve a specific group of products at a proper temperature.
To facilitate and ensure the best accuracy during data collection, it was selected chamber no. 2 for the experiments, which is dedicated exclusively to the storage of one single product—garlic.
Environmental conditions of this chamber are monitored and controlled by an automated switchboard. This device measures internal temperature and relative humidity using specific sensors and, in accordance with this data, it will act on the compressor ensuring that it is appropriately preserved (Fig.
6
).
Fig. 6
Schematic composition and operation of test chamber
Garlic is unpackaged or stacked in boxes of different sizes; its distribution as well as physical layout and external surroundings around test chamber are depicted in Fig.
7
.
Fig. 7
Physical layout of test chamber and arrangement of garlic inside it
Freezing method used by the chamber is based on maintaining a forced cold air circulation over all the area (air blast freezing), which is achieved by two working air fans mounted on the evaporator. Application of this technology guarantees a faster and homogeneous reduction of temperature.
The entrance is closed by a sliding and tight door, with rubber gaskets in good condition, but no additional thermal protection devices were present every time door was opened (e.g. PVC curtains or air curtain devices). Lighting is manually activated by employees through a switch.
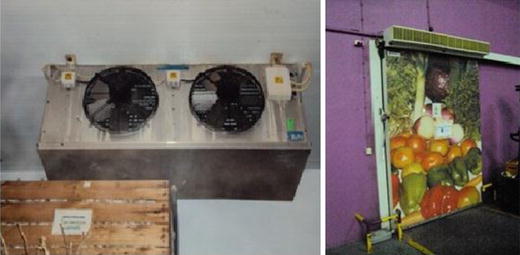
Figure
8
shows the aspect of both evaporator and door of the test chamber.
Fig. 8
Evaporator with forced air circulation fans and aspect of the door installed in test chamber
To evaluate deviations between real and simulated energy consumptions, two experiments A and B were carried out in different moments and with different durations; the following sequence of tasks was applied to each one:
data collection from test chamber using appropriate measuring instruments (temperatures, relative humidities, space dimensions, etc.), including energy consumption of compressor and its working time (a power quality analyzer was used to do so);
insertion of collected data (input parameters) in the model, thus obtaining the simulated consumption;
calculation of relative deviations between real and simulated consumptions, and deduction of conclusions.
A sensitivity analysis of simulated energy consumption was performed through a programmed variation of some input parameters which are easy to optimize in practice. For each variation the final consumption was determined, having as a reference all data measured within experiment B. Selected parameters for this analysis and all relevant initial considerations are listed in Table
4
.
Table 4
Input parameters to be changed in sensitivity analysis
Input parameters
Considerations
Tint
–
Tini prod
Mass of product that was introduced in chamber: 1,000 kg
P
Door opening time for each employee access: 60 s
E
By using or not an air curtain device (E = 0 or E = 0.7 [18])
Pele ilum
Illumination is active every time door is opened
At the end, simulations of energy efficiency measures were made with the purpose of retrieving the following relevant information:
the optimized energy consumptions;
the energy savings achieved;
an estimation of initial investment costs associated with each measure;
the payback time for the estimated investment.
Tested measures and corresponding input parameters to be adjusted are explained in Table
5
.
Table 5
List of energy efficiency measures tested and input parameters which were adjusted
Energy efficiency measure
Input parameter to adjust
Approximation of internal temperature to initial freezing point of products
Increase of Tint
Installation of an air curtain device at the entrance
Increase of E
Installation of LED lamps (for a recommended luminance of 300 lux [22]) and a presence detector to automatically activate lighting
Reduction of Pte
Calculation of payback time was made considering an average cost of 0.11 € per kW h of electric energy, in accordance with transient tariffs practiced in Portugal along the year 2013 [
23
].
Results
Table
6
shows all data collected from test chamber in each experiment, which were used as input parameters.
Table 6
Values for input parameters collected during the experiments
Input parameter
Experiments
A
B
Total experiment time (s)
49,500
10,800
Average internal temperature (°C)
−3
−4
Average external temperature (°C)
21.75
24.33
Evaporator temperature (°C)
−3
−4
Working time of air circulation fans (s)
22,925
4,220
Relative humidity of air inside chamber (%)
78
78
Relative humidity of air outside chamber (%)
40
31
Total time of people’s presence inside chamber/door opening/illumination on (s)
1,474
180
Average number of people inside chamber per access
1
Condenser temperature (°C)
55
Electric power of halogen light bulb (W)
400
Total thermal power of air circulating fans (W)
316
Accommodated product
Garlic
Chamber dimensions, L × W × H (m)
8.98 × 5.09 × 4.33
Door dimensions, W × H (m)
1.63 × 2.63
Wall structure
0.01 m plaster + 0.15 m masonry + 0.10 m EPS + 0.01 m plaster
Floor composition
0.08 m screed + 0.10 m EPS + 0.10 m reinforced concrete + 0.10 m air gap
Ceiling composition
0.010 m plaster + 0.150 m reinforced concrete + 0.100 m EPS + 0.002 m steel panel
Taking into account all data provided by measurements made in the test chamber, values for each constant used in Eq.
2
(calculation of
Qtrans
) and which are related to material composition and disposition of enclosures are specified in Table
7
[
24
].
Table 7
Values for constants used in Eq.
2
and conditions to apply them
Constant
Value
Conditions of usage
Rse i (m2 °C W−1)
0.04
Walls located inside the plant
0.13
Walls contacting the street
0.1
Ascendant heat flux through the floor
0.17
Descendent heat flux through the ceiling
λi;j (W m−2 °C−1)
1.55
For plaster
0.357
For masonry
0.037
For EPS
1.3
For screed
2.3
For reinforced concrete
0.025
For air
17
For steel panel
Rsi i (m2 °C W−1)
0.13
For walls
0.1
Ascendant heat flux through the floor
0.17
Descendent heat flux through the ceiling
Table
8
indicates some relevant constants defining physical properties of garlic, which are needed in Eqs.
4
and
5
to determine
Qtemp red
and also in Eq.
6
to calculate
Qresp
[
18
].
Table 8
Some physical properties of garlic
Property
Value
cp 1
3,170 J kg−1 K−1
cp 2
2,190 J kg−1 K−1
Lfreeze
196,000 J kg−1
Tini cong
272.35 K
q˙resp
0.0206 W kg−1
Table
9
shows all values used for constants associated with the calculation of heat contained in infiltrated air and which were used in formulas
7
,
8
and
9
[
1
,
18
].
Table 9
Constants used to calculate thermal load of infiltrated air
Constant
Value
Conditions of usage
g
9.81 m s−2
–
Df
0.8
If |Text−Tint| ≥ 11 K
1.1
If |Text−Tint| < 11 K
E
0
If there is no thermal protection at entrance, when door is opened
0.7
If there is an air curtain device at entrance
cp dry air
1,006 J kg−1 K−1
For air ambient temperature
patm
101,325 Pa
–
cp vap
1,840 J kg−1 K−1
For air ambient temperature
hlat vap
2,501,000 J kg−1
–
Mdry air
0.02897 kg mol−1
–
Mvap
0.018 kg mol−1
–
Rid gas
8,314 Pa m3 mol−1 K−1
–
Table
10
shows real and simulated results obtained for each experiment conducted in the test chamber.
Table 10
Real and simulated active energy consumptions for compressor’s operation, with indication of relative deviations obtained
Experiments
Real active energy consumption (kW h)
Simulated active energy consumption (kW h)
Relative deviation (%)
A
34.920
21.745
−37.7
B
6.550
4.027
−38.5
Figure
9
exposes the weight of each thermal load in the final simulated consumption, observed in both experiments A and B.
Fig. 9
Relative contribution of each thermal load existing in test chamber, for experiments A and B
Graphics regarding the sensitivity analysis that was done for the simulated consumption in experiment B are shown in Fig.
10
.
Fig. 10
Sensitivity analysis for simulated energy consumption in experiment B through variation input parameters (Table
4
)
Finally, Tables
11
and
12
show results for the estimated energy savings generated by each of the simulated efficiency measures presented in Table
5
, as well as the analysis of economic feasibility.
Table 11
Energy savings predicted after simulating all pre-defined efficiency measures
Measure
Experiment A
Experiment B
Simulated consumption (kW h)
Estimated savings (%)
Simulated consumption (kW h)
Estimated savings (%)
None
21.745
0.00
4.027
0.00
Change of inner temperature to −2 °C
20.804
4.33
3.726
7.50
Installation of an air curtain device
13.715
36.93
2.966
26.35
Use of LED lamps (7× tubular lamp 22 W) and a presence detector
21.694
0.23
4.022
0.15
All measures together
13.143
39.56
2.762
31.41
Table 12
Initial investment and payback time predicted for each simulated efficiency measure
Measure
Experiment A
Experiment B
Initial investment (€)
Payback (year)
Initial investment (€)
Payback (year)
Change of inner temperature to −2 °C
0
0
0
0
Installation of an air curtain device
1,534.00
2.7
1,534.00
4.5
Use of LED lamps (7× tubular lamp 22 W)
552.34
179.3
552.34
334.8
Discussion
From the analysis made on charts representing the relative contribution of each thermal load (Fig.
8
), it was possible to infer that, in both experiments, about 95 % of all removed heat had its origin in infiltrated warm air and in thermal transmission through enclosures. This suggested that when making a study about energy efficiency improvement in cold chambers, primary concerns must be focused on defining appropriate measures which aim to reduce those two significant thermal loads and only then follow the remaining ones. Charts also showed that contribution of infiltrated air became successively greater with the increase of the duration of the experiment, because of the growth in the number of times the door was opened.
Thermal loads from temperature reduction of product and from metabolic respiration were both nil because
garlic preserved inside were almost always at the same temperature (fluctuations of this quantity were negligible, and so no heat removal took place);
no garlic supply was made during experiments;
internal temperature was below freezing point, and this fact precluded the occurrence of relevant metabolic activity inside living cells.
Sensitivity analysis that was performed (Fig.
9
) revealed that, from the list of input parameters selected for testing, those which provided the greatest influence in final energy consumption are internal temperature (−0.15 kW h/ °C), number of accesses to the chamber (+0.51 kW h/access) and installation of an air curtain device above the entrance (reduction of 1.06 kW h in comparison to the initial consumption). These observations made sense because all of those parameters were directly related to the most significant thermal loads previously exposed.
Initial temperature of product had an intermediate relevance if just a refrigeration process is used to remove sensible heat (+0.27 kW h/ °C); however, the situation radically changed when garlic was introduced into the chamber at a temperature above its initial freezing point (
Tini freeze
= −0.8 °C), since existing latent heat was huge (
Lfreeze
= 196,000 J kg
−1
). If it is performed a provision of 1,000 kg of garlic at an initial temperature of 0 °C, energy consumed by compressor is seven times greater than that of a situation when garlic enters at the same temperature as the chamber (−4 °C). This showed that it is not advisable to admit the product at room temperature, therefore meaning that the company must acquire it at a temperature near to the chamber’s one, whenever possible.
Lighting power had an obvious negligible degree of influence in final consumption, because of the small periods of time during which the lamp was on (it just occurred when there were people inside). Impact of heat released by illumination only became relevant when its electric power was increased by some dozens of watt or when the door was opened more frequently; this indicated that replacement of the halogen lamp by another with LED technology may have some importance for energy efficiency improvement, although to a lower degree.
The study made to predict energy savings achieved by the application of all efficiency measures referred in Table
11
showed that it is possible to obtain gains of around 30–40 %. It also may be noted that installation of an air curtain device reduced dramatically final consumptions (at most 37 %), showing that this measure was extremely interesting to reduce energy bills, especially when many accesses are made to the chamber (as was the case of experiment A).
The economic analysis performed for this measure (Table
12
) allowed concluding that its implementation is viable, with an acceptable payback time of initial investment located between 2 and 5 years. This payback was less in experiment A because of the greater door opening frequency to execute service tasks inside the chamber (air curtain device had utility just in such moments), enabling a faster compensation of the applied investment. A careful study must be conducted by the company’s administration to make the final decision, taking into account the available monetary funds and the plans reserved to them.
Setting internal temperature to −2 °C revealed to be a measure from which it was possible to achieve good energy savings without any additional costs, but on the other hand it put at risk the preservation of the garlic. This risk derived from the fact that the compressor operated with a start–stop pattern, enabling a temporary rise of internal temperature above initial freezing point and thus reducing total time to preserve the whole product. When applying this measure special care must be taken into account, and possibly a fine regulation of thermostat parameters is required.
Replacement of the existing illumination by LED lamps conjugated with the installation of a presence detector revealed to be a measure with a very weak impact in consumed energy (with savings less than 1 %). Extremely high payback periods obtained for this measure enabled to conclude that it is not considered economically viable. This happened because during the experiments lighting was activated for a short period of time and because it was admitted that this behavior is homogeneous over all the year, a fact that in practice may not occur due to some exceptional moments (e.g. accommodation of large quantities of product and periodic cleaning of the chamber). Considering this observation, measure may be viable if illumination is maintained activated for longer periods.
Conclusions
In this study, the proposed methodology showed its relevance and practical applicability when used to estimate contributions on final consumption from thermal loads and from several input parameters (using a sensitivity analysis). It was also useful in the determination of possible energy gains resulting from the simulation of some efficiency measures, as well as when providing an analysis about the economic feasibility of such measures.
To cushion all deviations found between real and simulated consumptions the model may be improved by applying the following suggestions:
introduction of a corrective factor that represents the average efficiency on heat transmission between the environment and refrigerant fluid, occurring both in the evaporator and the condenser;
use of a more rigorous method to calculate heat transmission through all enclosures, since some additional aspects were ignored and may have some impact in final results (e.g. energy losses through chamber’s edges and corners, or through gaskets mounted around the door);
Implementation of a special functionality that is able to determine heat losses through pipework and respective insulation, where the refrigerant fluid circulates.
As main key findings about the developed work, it can be seen that there is a huge potential in energy savings which may be achieved in cold chambers through the introduction of adequate efficiency measures. Just in the current experimental study it was possible to obtain savings of up to 40 % with an initial investment around 1,500 € and a payback period located between 2 and 5 years, depending on the door opening time during service tasks. Similar results for energy savings may be replicated in other small horticultural companies scattered over Portuguese territory, like the one that was described here.
From the same methodology it was equally possible to infer which input parameters had the greatest influence in final consumption, therefore suggesting start points for the definition of priority efficiency measures. In the experimental study, inputs directly related with the composition of enclosures and with the entry of warm air contributed for 95 % of total energy consumption. In this way, definition of a specific measure to reduce those thermal loads was carried out (i.e. installation of an air curtain device) and, at the same time, it was possible to prove the great effectiveness of that measure in final consumption.
As a last key finding, the methodology presented in this work has a relevant usefulness as a tool to help draftsman and consultants in energy efficiency to define the most suitable measures for each cold chamber, as well as to evaluate their potential energy savings and economic feasibility. The aim of these goals is to promote awareness of companies to questions related to energy efficiency, in order to reduce energy costs and to help preserve the environment in a more effective way. All these concerns, when taken into consideration, may help companies improve their image and increase their competitiveness.
Acknowledgments
This study was financed by InovEnergy-Compete Portuguese program.
Conflict of interest
The authors declare that they have no competing interests.
Authors' contributions
PB supervised the work, giving useful ideas to carry it out. He also revised the text and made suggestions in order to improve it. PL suggested concrete efficiency measures and mentioned techniques to evaluate their economic feasibility. PR made a data collection, which was useful to define the structure, to test and to adjust the methodology. OA also made a data collection, performed the simulations and wrote the manuscript. All authors read and approved the final manuscript.
References
Moran, M.J., Shapiro, H.N.: Fundamentals of engineering thermodynamics. John Wiley & Sons (1993)
Joppen, L.: Energy efficiency: the challenges ahead—no significant improvements in three decades. Food. Eng. Ingred.
30
(6), 24–27 (2005)
Abdelaziz et al. (2011) A review on energy saving strategies in industrial sector (pp. 150-168) 10.1016/j.rser.2010.09.003
Gaspar, P.D., Miranda, A., Pitarma, R.A.: Estudo comparativo do desempenho de códigos de DFC na modelação de equipamentos de refrigeração abertos. In: Paper presented at the VII Congress on Computational and Applied Mechanics, University of Évora, Évora, 14–16 April (2003)
Eames et al. (2012) Description and validation of a computer based refrigeration system simulator (pp. 53-63) 10.1016/j.compag.2012.03.010
Koury et al. (2001) Numerical simulation of a variable speed refrigeration system (pp. 192-200) 10.1016/S0140-7007(00)00014-1
Ding (2007) Recent developments in simulation techniques for vapour-compression refrigeration systems (pp. 1119-1133) 10.1016/j.ijrefrig.2007.02.001
Borges et al. (2011) Transient simulation of household refrigerators: a semi-empirical quasi-steady approach (pp. 748-754) 10.1016/j.apenergy.2010.09.019
Hermes and Melo (2008) A first-principles simulation model for the start-up and cycling transients of household refrigerators (pp. 1341-1357) 10.1016/j.ijrefrig.2008.04.003
Hermes et al. (2009) Prediction of the energy consumption of household refrigerators and freezers via steady-state simulation (pp. 1311-1319) 10.1016/j.apenergy.2008.10.008
Ge and Cropper (2008) Performance simulation of refrigerated display cabinets operating with refrigerants R22 and R404A (pp. 694-707) 10.1016/j.apenergy.2008.01.004
Tao et al. (2010) Performance study of an energy-efficient display case refrigerator 191(4) (pp. 550-565) 10.1080/00986440490277983
Negrão and Hermes (2011) Energy and cost savings in household refrigerating appliances: a simulation-based design approach (pp. 3051-3060) 10.1016/j.apenergy.2011.03.013
Astrain et al. (2005) Computational model for refrigerators based on Peltier effect application (pp. 3149-3162) 10.1016/j.applthermaleng.2005.04.003
Ke et al. (2010) Numerical simulation and parameter optimization of thermo-acoustic refrigerator driven at large amplitude (pp. 28-35) 10.1016/j.cryogenics.2009.10.005
American society of heating, Refrigerating and air-conditioning engineers: handbook—refrigeration (2010)