Results and discussion
Experiment 1: effects of water application on GHG emission fluxes
Figure
1
plots the emission fluxes for N
2
O, CH
4
, and CO
2
as affected by water application. Emission fluxes from the dry/loose manure (control) were negligible. Application of water on the manure resulted in significantly larger emission fluxes for all three GHGs, suggesting that water application triggers GHG emission. Table
2
summarizes the mean and peak emission fluxes for Experiments 1a and 1b.
Effects of water application on GHG emission fluxes:
a
,
b
and
c
correspond to CO
2
, CH
4
, and N
2
O fluxes, respectively, during the first 3 h after water application (Experiment 1b);
d
,
e
, and
f
represent CO
2
, CH
4
, and N
2
O fluxes, respectively, from 3.5 to 720 h after water application (Experiment 1a) Effects of water application on mean and peak emission values Treatment N2O CH4 CO2 Mean Peak Time† Mean Peak Time† Mean Peak Time† (mg m−2h−1) (h) (mg m−2h−1) (h) (mg m−2h−1) (h) 0 to 3 h after water application Dry/loose (control) 0.0 No peak 0.0 No peak 0.7 No peak Moist/loose 29.3 99.2 0.25 7.4 28.6 0.25 11,678 15,443 1.0 Moist/compacted 19.3 75.4 0.25 5.1 21.7 0.25 4,411 6,237 1.5 3.5 to 720 h after water application Dry/loose (control) 0.02 No peak 0.00 No peak 45 247 120 Moist/loose 2.60 6.38 120 0.29 1.33 146 3,935 6,153 120 Moist/compacted 4.33 17.2 410 0.89 4.51 410 3,894 5,980 220Fig. 1
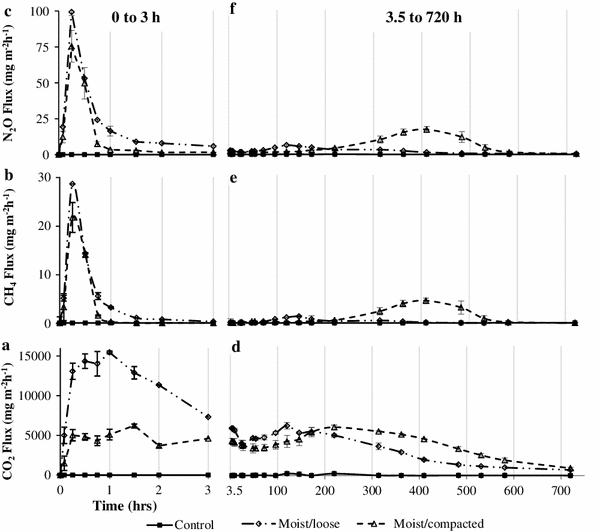
Table 2
Nitrous oxide
Nitrous oxide emission flux for the control (dry/loose condition and no water application) was generally small (Fig. 1 c, f). This result is consistent with the field measurements reported by Aguilar et al. [ 20 ] for cattle feedlots and by De Klein et al. [ 16 ] for soils. The N 2 O emission fluxes from the moist/loose and moist/compacted manure samples were significantly larger than those for the control. Moreover, N 2 O emissions from the moist/loose and moist/compacted manure samples did not differ significantly ( p > 0.05); however, they differed significantly ( p < 0.05) in the peak emission values. Figure 1 c shows that for the dry soil/manure (control), the N 2 O flux remained almost zero during the experimental period, but the N 2 O fluxes from the moist/loose and moist/compacted manure increased to 99 and 74 mg m −2 h −1 , respectively, approximately 15 min after water application. The first N 2 O peak from the moist/loose manure was significantly larger than that for the moist/compacted manure. The difference in the peak values between moist/compacted and moist/loose manure might be due to the larger wet bulk density of the moist/compacted manure (Table 1 ), which could have delayed gas diffusion from the substrates to their surface/air interface. Therefore, just the top layer of the moist/compacted manure was able to quickly diffuse N 2 O to the headspace, which can also explain its quick and large N 2 O flux decline during the first hour of the experiment. Previous researchers [ 11 – 13 , 26 – 28 ] reported increased N 2 O emission rates after rainfall events or artificial watering processes in agricultural soils. Nitrous oxide emission peaks as much as 22 times larger than normal fluxes were obtained at different times after a watering event [ 11 ]. Although several studies have reported large emissions of N 2 O several hours or even several days after rainfall events, other studies, including Davidson [ 12 ] for dry grassland soil and Scholes et al. [ 13 ] for dry savanna soil, reported that emissions of N 2 O began and markedly increased within minutes after adding water to soil at the end of the dry season. These results are comparable to those in the present study.
A second N 2 O emission peak was observed for both the moist/loose and moist/compacted manure at 120 and 410 h after water application, respectively. The second N 2 O peak for the moist/loose manure was observed when the N 2 O flux of the moist/compacted manure and the control were not significantly different. The increased N 2 O emission rate of the moist/compacted manure may be a consequence of the accumulated water underneath the surface due to soil compaction, which might have resulted in anaerobic conditions within the packed manure, triggering the denitrification process and enhancing N 2 O emissions [ 11 ].
After air-drying of manure, considerable NO 3 − as a result of nitrification is expected to remain within the manure; when water is applied under these conditions, denitrification might lead to a large N 2 O production [ 11 ]. Therefore, the high N 2 O emission rate within just 15 min after water application (Fig. 1 c) likely was a consequence of a high concentration of NO 3 − in the dry manure, which suddenly triggered the activation of denitrification after the addition of water. Davidson [ 12 ] suggested that nitrifying and denitrifying microorganisms can survive for long periods of time in dry conditions and extreme high and low temperatures and can become active within minutes after watering. In this experiment, as the moist/loose manure dried, conditions likely became more aerobic and reduced the denitrification activity, which could help explain the sustained reduction of N 2 O emission flux 1 h after watering (Fig. 1 c), reaching background levels 24 days later (Fig. 1 f). In a soil normally dominated by air-filled pore space and oxidizing conditions, the soil may become saturated with water during recharge events, and reduced conditions and denitrification may dominate temporarily [ 29 ].
Methane
Figure 1 b, e shows that CH 4 emission fluxes followed the same trend as N 2 O fluxes. Emission flux from the control (dry/loose manure and no water application) was also negligible. Emission fluxes from the moist/loose and moist/compacted manure were significantly larger than that for the control. The first CH 4 emission peak from the moist/loose manure (28.6 mg m −2 h −1 ) was significantly larger than that for the moist/compacted manure (21.7 mg m −2 h −1 ), possibly as a consequence of the higher wet bulk density of the moist/compacted manure (Table 1 ). A second CH 4 emission peak was observed for both moist manure treatments at 120 and 410 h after watering, respectively (Fig. 1 e). The second CH 4 emission peaks were smaller than the first. The CH 4 emission peak of the moist/compacted manure (4.5 mg m −2 h −1 ) was also significantly larger than that of the moist/loose manure (1.3 mg m −2 h −1 ). Results suggest that at 220 h after watering, the moist/compacted manure, which trapped water underneath the surface, could have become completely anoxic; the moist/loose manure had recovered its oxidizing conditions at that time. This is confirmed by the almost negligible CH 4 emission flux from the moist/loose manure, whereas the moist/compacted manure showed larger CH 4 emission flux at the same time, as shown in Fig. 1 e.
As described by Li [ 6 ] and Saggar et al. [ 30 ], during a rainfall or watering event, the top surface layer might become saturated, and therefore the water would block the diffusion of O 2 into the soil profile, thus depleting the O 2 left in the soil pore space due to microbial consumption. Therefore, because microbial activity in the dry/loose manure is enhanced as soil water content increases, this might result in the formation of anaerobic microsites quickly following watering, which results in anoxic conditions in the soil [ 30 ]. Reduced conditions may dominate temporarily in a dry soil after watering [ 29 ]; furthermore, in the same manner as temporary anoxic conditions triggered denitrification, they also enhanced the activity of methanogenic bacteria, which resulted in large peaks of CH 4 fluxes in both moist treatments after watering.
Carbon dioxide
Carbon dioxide emission fluxes from all treatments and the control were significantly different (Fig. 1 a, d). The larger CO 2 emission fluxes were observed from the moist/loose manure. Similar to N 2 O and CH 4 , CO 2 emission from the dry manure was negligible throughout the experimental period. Approximately 581 h after water application, emission fluxes from both moist treatments did not differ significantly from the control.
In the case of moist/loose manure, as soon as the pore space was filled with water, conditions could have become temporarily anoxic. Moreover, the water was exposed to vaporization because of the loose conditions and quickly moved deeper into the manure, which allowed O 2 diffusion from the air to the pore spaces and restored aerobic conditions in the substrate, as suggested by the wider CO 2 peak compared with the narrower N 2 O and CH 4 peaks. Therefore, GHG emission fluxes from the moist/loose manure were likely the result of a combination of aerobic and anaerobic conditions present at the same time. Under aerobic conditions, most soil microbial cells use O 2 as an electron acceptor, thus releasing CO 2 into the atmosphere as its main respiratory product [ 6 ], so as expected, the largest CO 2 emission flux was observed for the moist/loose manure.
Carbon dioxide emissions from the moist/compacted manure were significantly smaller than those for the moist/loose manure during the first 3 h after water application (Fig. 1 a). This might be due to the limited gas diffusion and anaerobic conditions. The manure’s compacted condition, in addition to decreased gas diffusion (which limited O 2 diffusion), also retained anoxic conditions longer because of the trapped water. That sustained anoxic condition enhanced denitrification and methanogenesis, resulting in large emissions of N 2 O and CH 4 but smaller emissions of CO 2 . Figure 1 d shows the decreasing trend of CO 2 emission flux for the moist/compacted manure 200 h after watering, whereas the emission fluxes of CH 4 (Fig. 1 e) and N 2 O (Fig. 1 f) increased during the same time period. These results support the thesis of mostly anoxic conditions in the moist/compacted manure.
Experiment 2: mechanisms of GHG emissions after water application
Nitrous oxide
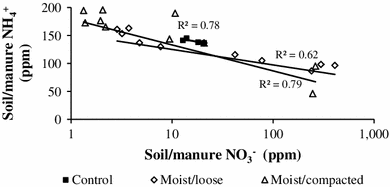
The control and moist treatments showed significant inverse correlation between manure NO
3
−
and NH
4
+
content (Fig.
2
). Field measurements presented by Aguilar et al. [
20
] also indicated inverse, but non-significant, correlation between soil/manure NO
3
−
and NH
4
+
. The non-significant inverse correlation between NO
3
−
and NH
4
+
from beef cattle pen surfaces was expected because of the likely constant soil/manure NH
4
+
content with time as a result of the random and continuous inputs of fresh cattle urine and manure to the pen surfaces. No additional input of nitrogen came with time in this study; as such, a sustained decrease in soil/manure NH
4
+
content was expected as nitrification increased with time.
Relationship between soil/manure ammonium and nitrate contentsFig. 2
The N
2
O emission fluxes in Experiment 2 (Fig.
3
f) followed the same trend as in Experiment 1. In Experiment 2, the control (dry/loose manure) showed a significant, sustained small increase in NH
4
+
(Fig.
3
d) and a significant, sustained, but small decrease in NO
3
−
(Fig.
3
e) during the 30-d experimental period. This result could explain the almost negligible emission of N
2
O from the control in Experiments 1 and 2 (Figs.
1
c,
3
f) and suggests that even though conditions were aerobic in the control, nitrification was limited because nitrifying microorganisms were likely inactive as a consequence of the low water content. However, in both moist manure treatments, a sudden, although non-significant, decrease in NO
3
−
occurred after watering (from 0 to 1 h); thereafter, a significant, large production of NO
3
−
and a significant, large decrease in NH
4
+
were observed at the same time (
p
< 0.05) (Fig.
4
e, d). These results suggest that although the manure was dry, both NO
3
−
and NH
4
+
were being accumulated because only a small amount of denitrification occurred, but as soon as water was added, both nitrifying and denitrifying microorganisms were activated, as also suggested by the sudden increase of more than 2 °C within just 10 min of watering in both moist treatments (Fig.
3
b). This may have triggered the transformation of NO
3
−
into N
2
O as byproduct of the denitrification process. Mikha et al. [
15
] reported increased microbial activity after watering dry soil, but 8 h after the watering event.
Relationship among factors affecting N
2
O emission flux versus time during 30 days after water application.
a
soil/manure,
b
soil/manure temperature,
c
soil/manure pH,
d
soil/manure NH
4
+
,
e
NO
3
−
,
f
N
2
O flux,
g
CH
4
flux, and
h
CO
2
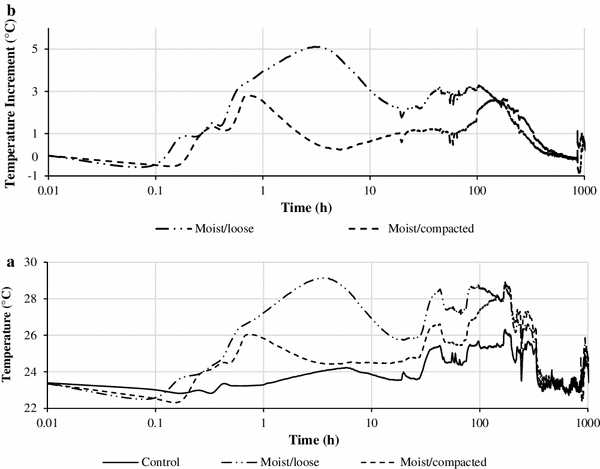
flux Soil/manure temperatures measured every 5 min during a 45-day period after two water applications:
a
total soil/manure temperature by treatment,
b
net temperature increment in the moist treatments with respect to the controlFig. 3
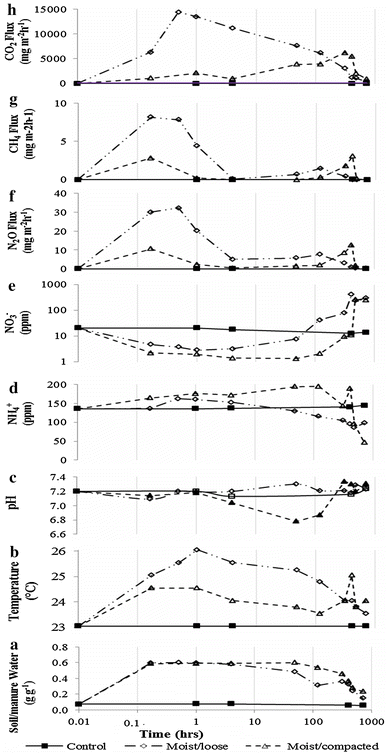
Fig. 4
In the moist/loose manure, as suggested by the quick decrease in NO 3 − content after water application (Fig. 3 e), sudden denitrification might be responsible for the large but narrow N 2 O emission flux peak within the first 10 min after watering (Figs. 1 c, 3 f). That N 2 O emission peak lasted for 30 min but quickly decreased to a minimum level, which was sustained during 120 h after watering. Up to 1 h after watering, the dominant process within the moist/loose manure was denitrification. One hour after watering, nitrification surpassed the rate of denitrification, as suggested by the significant decreasing rate of NH 4 + content (Fig. 3 d), whereas NO 3 − content increased significantly at the same time (Fig. 3 e). At 120 h, when the manure water content began to decline steadily (Fig. 3 a), aerobic conditions dominated in the manure, then a sudden increase of NO 3 − content (from 42 to 409 ppm) was observed. In that same time period, N 2 O emission flux decreased to a background level. A corresponding decrease in the manure temperature was also observed (Fig. 3 b). These results suggest that 120 h after water application, aerobic conditions and, consequently, nitrification were predominant within the moist/loose manure and responsible for the decreased emission of N 2 O.
As shown in Fig. 3 c, the pH in the control was slightly alkaline during the experiment. Moreover, in both moist manure treatments, the pH decreased slightly with respect to the control as soon as water was mixed with the manure. In the moist/loose manure 1 h after watering, the pH increased above that of the control, reaching a maximum of 7.3 at 48 h after watering, then decreased to the background level. In the moist/compacted manure, the pH quickly decreased 1 h after watering, reaching a minimum of 6.8 at 48 h, then increased to 7.3 at 312 h after watering and remaining around that value until the end of the experiment. The lowest pH was observed for the moist/compacted manure. At the time of this minimum pH, the largest NH 4 + content and the lowest NO 3 − content during the complete experimental period were also observed (Fig. 4 c–e). In general, pH remained around 7, which is favorable for N 2 O and CH 4 production [ 4 ].
The moist/compacted manure and the moist/loose manure behaved similarly, as shown in Fig. 3 . Because rates of denitrification are higher with high water content [ 31 ] and anoxic conditions, during the first hour after watering, the denitrification process was stronger in this treatment than in the moist/loose manure, as suggested by Fig. 3 e. Moreover, the narrow peak of N 2 O emission flux was smaller (Fig. 3 f), likely the result of reduced gas diffusion through the highly compacted surface. In this treatment, anaerobic conditions remained dominant until 408 h after watering. At 120 h, when the compacted manure started to dry, nitrification also took place, as suggested by the moist/compacted manure in Fig. 3 e, with a sudden large increase of NO 3 − content. After 120 h, a large N 2 O emission flux began, with a large and broader peak at 408 h. That large N 2 O emission peak might be the result of N 2 O accumulation under the surface during the time that manure conditions were anoxic, which was released when the surface drying process began. The sustained (broader) peak also can be explained by the increase in manure temperature (Fig. 3 b), suggesting that completely anoxic conditions were reached and maintained deeper in the manure after 120 h. Although the N 2 O peak showed up at 408 h, nitrification was the dominant process in the manure surface with a large conversion of NH 4 + into NO 3 − 120 h after watering, as suggested by Fig. 3 d, f, whereas anoxic conditions persisted in the bottom section of the manure.
Several sources [ 11 , 27 , 28 , 30 , 32 – 36 ] have reported that N 2 O is produced by the activation of both nitrification and denitrification processes. Groffman et al. [ 31 ], Kanako et al. [ 11 ], and Taghizadeh-Toosi et al. [ 37 ] reported that nitrification activity is activated under low water conditions and that it is enhanced by the presence of NH 4 + , which results in the production of NO 3 − in the soil. They also suggested that denitrification is enhanced by the presence of a high amount of NO 3 − and that it is activated under high water content. Davidson [ 12 ] and Saggar et al. [ 30 ] reported that nitrification is dominant below field water capacity, whereas denitrification is dominant above field capacity. The formation of anaerobic sites following watering was responsible for N 2 O emission rates up to 5 times larger when soil water content was above field capacity compared with rates observed below field capacity [ 30 ]. This result suggests that well-drained pens in cattle feedlots will emit lower rates of N 2 O than drained pens because the main driving agent in the dry pen is nitrification.
In general, as shown in Table
3
, the N
2
O emission flux from the moist/loose manure was directly correlated with manure factors such as water content, temperature, and NH
4
+
content and inversely correlated with pH and NO
3
−
content. Ammonium was directly correlated with manure water content and temperature but inversely correlated with NO
3
−
content. Nitrate content was inversely correlated with manure temperature. In the case of the moist/compacted manure, N
2
O emission flux was significantly correlated only with manure temperature. Ammonium was significantly directly correlated with manure water content but inversely correlated with pH and NO
3
−
content. Nitrate content showed a significant monotonic relationship with soil/manure water content (inverse) and pH content (direct), as indicated in Table
3
; moreover, N
2
O, CH
4
, and CO
2
emission fluxes were significantly directly correlated with each other.
Correlation matrix Moist/compacted treatment† Moist/loose‡ CH4 N2O CO2 Soil water Soil temp. pH NH4+ NO3− CH4 0.990 (<0.0001) 0.656* (0.039) + 0.696 (0.025) + + + N2O 0.990 (<0.0001) 0.552 (0.098) + 0.734 (0.016) + + + CO2 0.620 (0.042) 0.723 (0.012) + + + 0.576* (0.082) + Soil water 0.635 (0.036) 0.711 (0.014) 0.847 (0.001) + −0.578* (0.0804) 0.621 (0.055) −0.806* (0.0049) Soil temp. 0.596 (0.053) 0.692 (0.018) 0.931 (<0.0001) 0.955 (<0.0001) + + + pH −0.601 (0.050) −0.557 (0.075) + + + −0.566 (0.088) 0.748* (0.013) NH4+ 0.606 (0.048) 0.681 (0.021) 0.844 (0.001) 0.553 (0.078) 0.694 (0.018) + −0.887 (0.0006) NO3− −0.688* (0.019) −0.523 (0.099) −0.645 (0.032) −0.745* (0.0085) −0.561 (0.072) + −0.788 (0.004)Table 3
Methane and carbon dioxide
The CH 4 and CO 2 emission fluxes in Experiment 2 (Fig. 3 g, h) followed the same trends as those in Experiment 1, also displaying two different sets of gas emission peaks. Those sudden peaks of CH 4 and CO 2 emission fluxes after watering the dry manure also coincided with a sudden increase in manure temperature just 10 min after watering (Fig. 3 b). As in Experiment 1, the CH 4 emission peak of both moist manure treatments reached the background level (control) 1 h later. Temperature in the moist/compacted manure also declined to the background level, suggesting little microorganism activity at that time.
In the moist/loose manure, after the first CH 4 and CO 2 emission peaks, the temperature steadily decreased and the CH 4 emission flux declined to the background level. The CO 2 emission flux, on the other hand, although decreasing, was still important 408 h later, when it also reached its background level. These results suggest that conditions in the manure became progressively more aerobic as the water content decreased. This trend also matched the large nitrification activity previously suggested in the same period of time.
In the moist/compacted manure, the temperature began to steadily increase 120 h after watering, reaching a maximum of 25 °C at 408 h, 2 °C above room temperature (Fig. 3 b). This second increase in temperature might have resulted from increasing microorganism activity deeper in the manure after several days of high water content and limited gas diffusion through the manure. At that time, a second and broader CH 4 emission peak was reached. A CO 2 emission peak coinciding with the CH 4 emission peak was also observed. This suggests that two different conditions were reached simultaneously in the vertical manure profile of the moist/compacted manure. At the surface, aerobic conditions increased as water evaporated; this substrate section might be responsible for the increasing CO 2 emission peak as well as for the nitrification activity previously reported for this treatment during the time interval. Furthermore, conditions became strongly anoxic deeper in the manure, a condition responsible for the increase in substrate temperature as well as for the CH 4 emission peak at that time interval.
As described by Paul [ 38 ] and Segers [ 39 ], microbial production of CH 4 in soils results from the action of methanogen microorganisms that decompose organic material in the absence of O 2 , using CO 2 as an electron acceptor and a reduced organic compound as the donor. The reduction of CO 2 occurs under extended reduced conditions such as in flooded soils or in any soil with severely limited O 2 diffusion [ 6 , 38 ]. Major factors that influence CH 4 emission flux in soils are soil O 2 , soil CH 4 concentrations, and gas transport. Gas transport is driven mainly by soil water content and temperature [ 39 ]. The initiation of CH 4 production is not affected when the dry substrates are stored under dry air, O 2 , or N 2 atmospheres, but it is affected by storage under moist conditions [ 40 ]. Therefore, the watering process, in addition to triggering N 2 O emission flux, might also have triggered CH 4 and CO 2 production, as shown in Fig. 3 g, h. Mikha et al. [ 15 ] indicated that after dry soil is watered, dead cells quickly release readily degradable organic compounds, such as amino acids, NH 4 + compounds, and glycerol, which may be utilized by live microorganisms, resulting in a pulse of CO 2 emission after watering.
Previous studies have reported an inverse correlation between N 2 O and CH 4 emissions [ 4 , 41 ]. Delaune and Reddy [ 42 ] report that in soil sediments, anaerobic conditions are reached at redox potential below +400 mv; they also indicated that the approximate range of denitrification activity is between +400 to +300 mv and that the reduction of CO 2 , which yields CH 4 [ 38 , 39 ], is below −200 mv. Hou et al. [ 4 ], in rice paddy soil, and Johnson-Beebout et al. [ 41 ], in a rice paddy greenhouse experiment, reported that significant N 2 O emissions occurred only at approximated redox potentials above +200 mv, and significant CH 4 occurred below −200 mv. Based on those results, high emissions of both N 2 O and CH 4 do not occur simultaneously.
Unlike those studies, this study evaluated the effect of water application to dry beef cattle manure on GHGs. Mayer and Conrad [ 40 ] demonstrated that unlike forest and arable soils, rice paddy soils contain a large methanogenic biomass even under dry and aerobic soil conditions, and that the production and emission of CH 4 is limited only by the establishment of low redox potential and the supply of dissolved organic compounds and oxidants. Moreover, Gattinger et al. [ 43 ] reported increased methanogenic biomass in soils with a high rate of manure application. In addition, a soil dominated by air-filled pore space and oxidizing conditions may quickly become saturated with water during recharge events, and reduced conditions and denitrification may dominate temporarily [ 29 ]. Therefore, after water application in Experiments 1 and 2, the potentially large amount of aerobic microorganisms present in the dry manure might quickly consume the O 2 left in the substrate and cause a rapid O 2 partial pressure drop [ 6 ], thus rapidly activating the likely large population of denitrifiers and methanogens in the dry manure. This result is also supported by the sudden increase in manure temperature after water application (Fig. 3 b). Therefore, sudden denitrification and methanogenesis could occur simultaneously as a result of water saturation of the dry manure, which limits O 2 diffusion and enhances microorganism activity.
Table 3 shows that CH 4 emission flux from the moist/loose manure was significantly directly correlated with water content, temperature, and NH 4 + content and inversely correlated with pH. It showed a significant monotonic relationship with NO 3 − content (Table 3 ). For the moist/compacted manure, on the other hand, CH 4 emission flux was significantly correlated only with manure temperature. For CO 2 emission flux, the moist/loose manure showed significant direct correlation between CO 2 emission flux and manure water content, temperature, and NH 4 + content and inverse correlation with NO 3 − content. Furthermore, the moist/compacted manure showed significant monotonic correlation between CO 2 emission flux and NH 4 + content.
Figure 4 shows the temperature trends for the control (dry/loose) and for the moist manure treatments after water application (Experiment 2b). The processes that generated those temperatures differed significantly at a 5 % level of significance. For both moist manure treatments, a quick decrease of 0.5 °C occurred as soon as water was mixed with the manure, which might be a result of direct contact of water with the buried sensors in the manure. After the initial temperature drop, temperature increased (Fig. 4 a).
Within the first hour, the moist/loose manure increased 3.9 °C, which is larger than the 3.0 °C observed in the previous experiment (Fig. 3 b). This treatment had a net temperature increase of 5 °C 3 h after watering, then dropped to 3 °C at 20 h after watering (Fig. 4 b). After this, it observed a second temperature peak, with an increment of 1 °C. These temperature peaks coincided with the peaks of N 2 O and CH 4 emission peaks previously described for the moist/loose manure.
Temperature for the moist/compacted manure exhibited a trend similar to that for the moist/loose manure; however, its maximum registered increment was 2.75 °C, and the respective peak times were different, as shown in Fig. 4 a, b. Nevertheless, those peaks also coincided with GHG emission peaks. Field experiments [ 20 ] indicated changes in soil/manure temperature of over 9 °C between different surface conditions within a pen in a beef cattle feedlot. In general, results shown in Fig. 4 confirm results from previous experiments, and the temperature trends support the GHG emission peaks reported in this study.
Thirty-five days after first watering, a second watering event took place. As shown in Fig. 4 a, a new set of temperature peaks was observed, but those peaks did not reach previous levels. This result might be a consequence of NH 4 + depletion because no new urine or manure was added in this experiment. That NH 4 + depletion might result in low nitrification activity in the manure, which would decrease denitrification; therefore, those small temperature peaks might be result of inhibited microorganism activity. Because the N inputs as urine and manure on a pen surface can be considered inexhaustible in an open-lot beef cattle feedlot, it might be suggested that large emission peaks of GHGs are emitted after each rainfall event on dry soil/manure surfaces.