Department of Mechanical Engineering, Michael Okpara University of Agriculture, Umuhia, Abia State, P.M.B 7267, NG
Department of Mechanical Engineering, Covenant University, Ota, Ogun State, P.M.B 1023, NG
Department of Electrical/Electronics Engineering, Cross River University of Technology, Calabar, P.M.B 1123, NG
Abstract
Nigeria is rich in both conventional and renewable energy resources that empower the country with a large capacity to develop an effective national energy policy. The study aims at reviewing the current energy resource structure of Nigeria in terms of production and utilization, comparing sectoral performance and reviewing issues confronting energy growth, sustainability, policies and frameworks towards the actualization of energy efficiency. The total energy consumption in 2011 was 28.8 million tons of oil equivalent about 5.4 % of the world value in 2010. Nigeria share of world CO
2
emissions in 2011 was 0.32 % and a drop of 0.02 % in 2010. In addressing the country’s challenges of energy demand, production, consumption and related environmental problems, the government has initiated sustainable and effective energy conservation strategies to improve efficiency. These include: reduction of energy consumption at the household sector, reduction of gas flaring, adoption and maximum renewable energy technologies, reduction of energy intensity in industries by appropriate energy conservation and management system. In addition, the policies also include the development and integration of alternative energy resources such as nuclear, biomass, wind and solar into the total energy mix structure. For all these to be accomplished, the energy development strategy must follow a sustainable framework to balance economic growth, social expansion and eco-friendly protection.
Introduction
Energy remains the principal driving force for both economic and industrial developments of all nations of the world. It is the midpoint of economic, environmental and developmental issues confronting the world at the moment. Clean, efficient, stable and sustainable energy services are, therefore, ideal for global prosperity. Developing economies like Nigeria require a robust access to reliable and advanced energy services due to the escalating population and socioeconomic activities; this will bring about the reduction in poverty level, improve health conditions, enhance productivity, maintain competitiveness and promote economic growth in all ramifications [
1
,
2
].
The economy of Nigeria became dependent on oil from the 1970s till date; it has contributed over 98 % of export earnings and 85 % of government revenue. However, this over dependence of the economy on oil has caused it to be highly responsive to external influences [
3
]. Consequently, the high proceeds obtained from crude oil export in all these years brought about an unsustainable spending profile, which led to economic catastrophe when global petroleum prices crashed in 1986 [
4
,
5
]. This induced huge dislocation in the economy, joined with gross mismanagement of resources and resulted into borrowing leading to increase in external debt. Since a large amount of proceeds earned from oil were not properly utilized for meaningful and sustainable development, poverty continued to be in the rise and people remain deprived of efficient energy services and sustainable livelihoods. The levels of energy consumption in Nigeria are currently identified to be low with about 701 kg of oil equivalent per capita and electricity consumption of 134 kWh per capita [
6
]. The average gross domestic product (GDP) growth rate from 2005 to 2012 was 6.9 % reaching a height of 8.6 % in December 2010 and a low value of 4.5 % in March 2009. The GDP in 2011 corresponds to 0.38 % of the world economy and comparable to $235.95 billion [
7
]. The economy is projected to grow at 7.43 % in 2014 and 7.25 % in 2015 [
8
,
9
]. Crude oil (the mainstay of the economy) and electricity power generation and consumption are thus faced with numerous difficulties including: (1) youth restiveness/militancy in the oil exploration regions, (2) high level of gas flaring, (3) low electricity generation, (4) low and decaying transmission infrastructures, (5) poor energy efficiency practices, (6) poor energy management systems and (7) high environmental degradation and emissions [
10
].
The IMF ranking in 2010, places Nigeria on 31st position by GDP on purchasing power parity basis in the world’s economies of countries. This ranking led to the government’s frantic effort to place the country among the first 20 economies of the world by 2020 through the development of a blueprint tagged ‘Vision 20:2020’ (Federal Government’s postulation for industrialization). This calls for the country to grow her economy from the present growth rate of about 6–13.8 % per annum leading to a per capita income of about 4,000 USD. In achieving the Vision 20:2020, one input that is very vital towards the realization is energy. Hence, there will be the need to ensure energy optimization in all sectors of the economy, improve environmental and social security and tackle issues of poor energy efficiency attitudes through proper energy management system to meet with the needs for sustainable growth.
In view of this, there is need to provide adequate information that is vital for the realization of Vision 20:2020 in a bid to have an industrialized nation. The objective of this paper is thus to review (1) the current energy resource structure of Nigeria in terms of production and utilization, (2) the performance of energy sectors based on some economic indicators and (3) issues confronting energy growth, expansion strategy and sustainability alongside with policies and frameworks needed for the actualization of energy efficiency and conservation.
The current energy resource structure of Nigeria
Nigeria is endowed with enormous energy resources which put her in a position to bring about change to her economy and better the lives of her citizens. Energy demand in Nigeria has been in the increase in the last three decades; energy consumption in 2011 increased by 3.6 % over that in 2010 giving a total energy utilization value of 4.4 Quadrillion Btu [115,000 million tons of oil equivalent (m toe)], of which conventional biomass and waste contributed about 82 % of the overall energy consumption [
11
–
13
]. The high share of biomass energy in the overall energy consumption reflected the adoption of biomass in meeting off-grid heating and cooking requirements, primarily in the rural areas. The electrification rates for the entire country in 2011 was 45 % leaving almost 79 million people without electricity [
11
]. In addition, the entire energy supply in the country is over 80 % domestic with oil dominating the primary energy mix. This, however, led the government to the process of restructuring the energy sector and will cover the whole chain, starting from oil exploration and exploitation (up- and downstream sectors), power generation, transmission and distribution. Various energy resources in vast deposit in the country are thus discussed:
Natural energy resources
Nigeria has varied energy resources and primarily rich in crude oil and natural gas which placed her on the tenth and ninths positions, respectively, of the global world reserves in 2011 [
9
]. In spite of holding the largest natural gas reserves in Africa, the country lacks adequate infrastructure needed for the optimal development of the sector. Hence, natural gas related with oil production is usually flared thereby resulting to increase in environmental degradation. However, with the on-going development of regional gas pipelines, extension of the liquefied natural gas (LNG) infrastructure, and policies to stop gas flaring, development for export and domestic utilization in the sector are anticipated to accelerate [
3
,
9
]. The geographical spreads of fossil deposits concentrate more in the south–south and southeast geo-political regions of the country. Energy transportation (particularly for refined petroleum products) throughout the remaining geo-political zones of the country poses a heavy burden on the Nigerian National Petroleum Corporation (NNPC) and the Independent Petroleum Marketers Association of Nigeria (IPMAN), leading to uneven product costs across the country due to varying transportation logistics and costs.
Fossil fuel-based energy resources
Coal
The estimated coal reserve in the country is about 2.7 billion tons in 2011, out of which 650 million tons are roughly proven (about 0.02 % of the world total proven). The production capacity declined from 0.91 million tons in 1959, to an insignificant level in 2011. The drop in production capacity was due to reduction in coal demand and its replacement with gas and diesel as fuel sources to thermal power generation [
11
,
14
,
15
]. Nigeria ranked low in world coal production by contributing 0.0001 % of the world share [
11
]. Coal distribution in the country is uneven across the regions, extending from the cretaceous Anambra basin (southeast) to Dekina (north-central) the Benue basin. Mine production capacity after full rehabilitation and privatization at principal mining sites in Nigeria may possibly obtain the following levels: Onyeama and Okpara (150,000–400,000 tons/year), Owukpa (2,500 tons/year) and Okaba (15,000–300,000 tons/year) [
15
,
16
]. Some of these mine sites are presented in Table
1
[
16
,
17
].
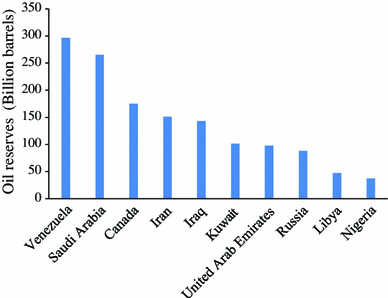
The estimated oil reserves stood at 37.2 billion barrels in 2011 accounting for approximately 2.3 % of the total global reserves (Fig.
1
) [
11
]. The average crude oil production in 2011 was about 2.13 million barrels per day (mbpd) compared to the 2.05 mbpd in 2010 [
12
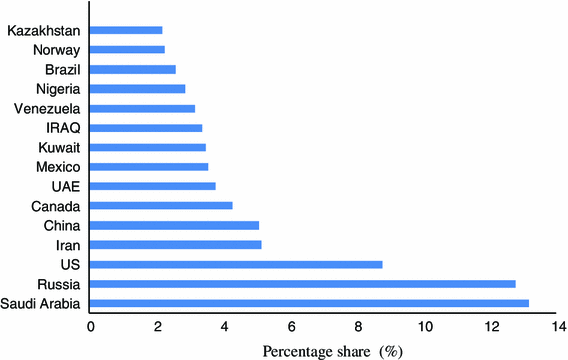
]. In 2011, Nigeria was the twelfth highest producer of crude oil in the world with 2.9 % of the world total share (Fig.
2
). Furthermore, the federal government anticipates increasing proven oil reserves to 40 billion barrels in the years ahead. Though, the rate of exploration is at their lowest as only three exploratory wells were drilled in 2011, compared to over 20 wells drilled in 2005. In addition, the average crude oil production in 2012 was over 2.15 mbpd. The increase in production was due to the extension of the existing fields and recent production from deep water fields. The latest deep water field to come on board as at 2012 was Total’s Usan field, which began production of over 100,000 barrels per day (bpd) in July 2012 and was expected to reach 180,000 bpd by the end of 2012 [
7
,
13
].
Fig. 1
Proven world oil reserves for 2011 (Billion barrels). Data source [
11
]
Fig. 2
World percentage share of crude oil production in 2011. Data source [
11
]
Natural gas
Nigeria has estimated proven reserves of about 5.1 trillion cubic meters (tcm) of natural gas (NG) which approximates 2.5 % of the world total in 2011 and placing the country as the ninth leading NG reserve holders in the world and the biggest in Africa. The production capacity in 2011 was about 39.9 billion cubic meters (about 1.2 % of the world share), which gave Nigeria the 16th position in world’s NG production [
13
]. The distribution of NG in Nigeria is uneven across the regions. Most of the NG reserves are located in the Niger Delta region of the country. A significant portion of the country’s marketed natural gas is processed as LNG. In 2010, about 17.97 million metric tons (875 bcf) of LNG was exported, making Nigeria the fifth largest LNG producer in the world [
13
]. The level of natural gas utilization in the country remains low since a large quantity of the produced associated gas is flared due to inadequate infrastructure and market outlets. There is the need to develop a large gas market and adequate infrastructures to improve the sector so as to reduce revenue loss due to gas flaring.
Nuclear power
Nigeria’s nuclear strategy started shortly after her independence in 1960. The government is on the path of positioning Nigeria on nuclear development [
18
]. In Africa, South Africa is the only country that has utilized the energy gotten from nuclear deposits with capacity of about 12.7 terawatt-hours for the year 2011 accounting for 0.5 % of the world’s total consumption share. Considering the nation’s electricity supply, nuclear power will undoubtedly help improve the energy problems. More importantly, nuclear development has benefits that go beyond electricity supply. Its application in agriculture, health, science and technology cannot be overemphasized. Nuclear development is further captured in Nigerian energy master plan.
Renewable energy resource base
Nigeria is endowed with abundant deposit of renewable energy (RE) potentials ranging from solar, wind, hydro (small and large), biomass and fuel wood; RE has placed Nigeria in a better position to advance her internal energy strategies. However, the country is yet to integrate the vast RE potential into the energy mix. In addition, the mainstream energy supply chain is at present dependent on fossil fuels and firewood. These sources are grossly depleted due to the inability to harness other energy resources. The RE capacity is thus discussed in the following subsections.
Hydropower energy resources
The current hydropower potential of Nigeria accounts for about 30 % of the total electricity power supply [
3
]; this value is relatively insignificant when compared to the world hydropower energy production. The three main hydropower plants in Nigeria are located in Kainji, Jebba and Shiroro with installed capacities of 800, 578 and 600 MW, respectively, to bring the total installed large hydro capacity to 1,978 MW. The overall exploitable hydropower potential at 2011 was about 14,750 MW of which 3,500 MW is from the small hydropower plants, and 11,259 MW from the large ones [
3
]. The exploitable rate at the end of 2011 was about 13.41 %. This rate is low when compared to countries like Norway, Japan, Sweden, France and China with developed proportion of their hydropower potentials standing at about 45, 61, 69, 68 and 30 % in 2009, respectively, and installed capacities of 27.53, 27.23, 16.21, 25.34 and 196.79 GW in that order [
19
–
21
].
The percentage electricity generation in the country was 25 % hydro, 12 % thermal (oil) and 63 % thermal (gas) in 2011 [
19
]. The statistics shows that the larger portion of electricity generated was from thermal power plants with about two-thirds of thermal power derived from natural gas. Hydropower used to contribute the larger portion of the total energy mix, but in recent years, all the hydro lakes have been the victim of climate change leading to the subsequent reduction of water intake into the power dams. Because of the fall in the contribution of hydro to the energy mix, the federal government in 2009 proposed the construction of additional hydropower stations as listed in Table
2
.
Table 2
List of proposed hydropower stations and year of completion [
9
,
19
]
Hydropower station
Type
Capacity (MW)
Name of reservoir
River
Zungeru power station
Reservoir
700
Hadeja River
Kano power station
Reservoir
100
N/A
Hadeja River
Zamfara power station
Reservoir
100
Gotowa lake
Bunsuru River
Kiri power station
Reservoir
35
N/A
Benue River
Mambilla power station
Reservoir
3,050
N/A
Donga River
Wind energy resources
It is a form of clean energy that has been experiencing rapid growth in recent decades due to the promotion of models of renewable energy sources, energy supply security, fuel diversity concerns, ecological awareness, and economic reasons [
22
]. Due to its many advantages, wind energy has also become the fastest growing renewable source of energy in both developed and developing countries [
23
]. Nigeria was found to be a poor/moderate wind regime with wind speeds ranging from 2.12 to 4.13 m/s in the southern part of the country with the exception of the coastal regions/offshore, and the north having speeds ranging from 4.0 to 8.60 m/s [
24
–
28
]. The total actual exploitable wind energy reserves range from 8 to 97 MWh/year in the north and the northeast region of the country [
29
]. The level of wind power development is still low in the country with the few available wind field limited to the 5 and the 0.7 kWp located in the Sayya Gidam and Danjawa, respectively, in the north. A pilot project on the generation of large-scale grid-connected power using wind energy commenced at Katsina State in 2007 with a capacity generation of 10 MW.
Biomass energy resources
Biomass resources of abundance in Nigeria include dead trees, wood chips, tree trumps, animal and human waste, household and organic waste from industries. It is the primary source of energy in Nigeria constituting about 37 % of overall energy consumption among the rural settlers and semi-urban dwellers [
20
,
29
]. The total crop residues and animal waste produced is 83 and 61 million tons/year, respectively, while about 80 million cubic meters (43.4 × 10
9
kg) of fuel wood is consumed yearly, with average daily consumption varying from 0.5 to 1.0 kg of dry wood per capita [
3
,
29
]. Wood fuel is used mainly for cooking, heating and other domestic purposes. Biomass resources estimate in Nigeria as at 2011 was above 816 MJ (0.02 tons of oil equivalent) [
28
,
30
]. Biomass is still used mostly in its crude form in the country, though future utilization as a sustainable energy solution through biodiesel production is in view by the government [
30
].
Solar energy resources
Nigeria has an average annual solar incident of about 1,831.06 kWh with a total land area of 923,768 km
2
. Evaluation of the technical potential of solar energy in Nigeria shows that a useful annual energy of 15 × 10
14
kJ can be obtained with 5 % device efficiency. This translates to about 258.62 million barrels of oil corresponding to 4.2 × 10
5
GWh of electricity production annually [
31
]. The country has an annual average sunshine of about 6.25 h, ranging from 3.5 h at the coastal regions to 9.0 h at the north [
3
,
29
]. Similarly, the mean daily solar radiation is about 5.25 kWh/m
2
/day, ranging from 3.5 kW/m
2
/day at coastal zones to 7.0 kWh/m
2
/day at the north [
32
–
34
]. The solar radiation distribution is shown in Fig.
3
[
35
]. Based on the map, three different solar radiation zones can be defined viz: zones I, II and III with each zone having different radiation levels (whose respective values are indicated on the figure legend) that may be needed for a particular project selection and sizing [
35
]. Table
3
gives the irradiation levels for each zone as distributed among the 36 States of the federation. Zone I comprises all the states in the northeast geo-political zones; with high solar radiation incident on the horizontal surface; it has excellent and viable potential for large-scale solar photovoltaic especially in the semi-arid region. Zone II consisting of the northwest and north-central belt of the country also has viable solar radiation that may be required for most solar projects. Low potential of annual global solar radiation exists in zone III (comprising all locations in the south zone including the coastal region), and can only be suitable for stand-alone PV systems. However, some states/locations in the southwest and southeast regions can readily support decentralized energy projects.
Fig. 3
Solar radiation map of Nigeria. Data source [
44
]
Table 3
Solar radiation zones (global horizontal irradiation) [
47
]
Zones
Annual average of global solar radiation (kWh/m2/day)
Sunshine duration (h/day)
Annual average of solar energy intensity (kWh/m2/year)
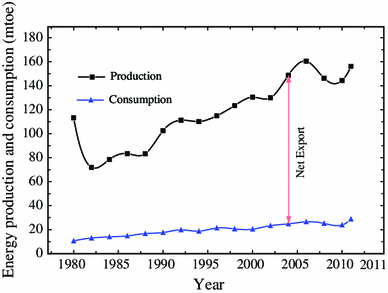
The overall energy production and consumption in Nigeria from 1980 to 2011 are presented in Fig.
4
. Fluctuations are observed in some years in the production and consumption capacity. These fluctuations can be attributed to several factors including population increase, unstable government policies, youth restiveness in regions of oil exploration and international market dynamics. However, the overall primary energy production decreased from 113.2 m toe in 1980 to 83.2 m toe in 1988, followed by an increase from 102.5 m toe in 1990 to 156.1 m toe in 2011 [
8
,
9
,
11
]; between 1980 and 2008, the energy consumption increased almost steadily at an annual rate of 9.2 % and was thereafter followed by a decrease of 5.4 % in 2010 due to recorded vandalizations of oil and gas infrastructures by oil bunkers/militants. In 2011, there was an increase of 20.5 % annual rate giving a value of 28.8 m toe.
Fig. 4
Energy production and consumption in Nigeria (1980–2011). Data source [
8
,
11
]
Table
4
depicts the energy consumption by type from 1980 to 2011. Crude oil remains the major primary energy source in terms of production and consumption in the overall energy mix. However, the ratios of crude oil consumption in the energy mix (Table
4
), dropped from 82.2 % in 1982 to 69.8 % in 1988 and later increased to 71.3 % in 1990. The ratio of consumption dipped from 66.6 % in 1992 to 51.6 % in 2011 [
8
,
9
,
11
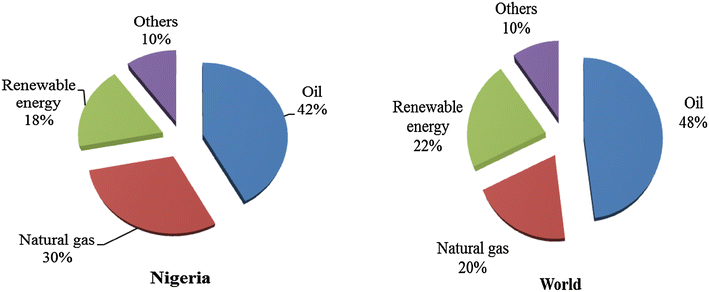
]. The consumption of coal in the energy mix is comparatively small, declining from 1.6 % in 1980 to a paltry quantity in 2011. This is due to over dependence on crude oil leading to neglect of coal exploitation in the country. The consumption of natural gas and renewable energy showed a steady increase. Natural gas increased from 8.9 % in 1980 to 30.2 % in 2011 while renewable energy consumption increased from 11.6 to 18.2 % within the same period. The comparison of primary energy consumption in Nigeria and the world in 2011 is presented in Fig.
5
[
11
]. The share of primary energy production is also presented in Table
4
. Crude oil is still found to dominate the primary energy production mix. The production capacity reduced from 90.06 % in 1980 to 78.4 % in 2011 while coal decreased from 0.2 to 0.1 %. The share of crude oil production has in last decade declined at about 9.2 % between 1994 and 2011 (Table
5
), while renewable energy was found to decrease by 5.3 %.
Table 4
Energy consumption (between 1980 and 2011) in Nigeria (million toe) [
8
,
9
,
11
]
Year
Aggregate consumption
As percentage of total energy consumption
Crude oil (%)
Natural gas (%)
Coal (%)
Hydro, wind, solar (%)
1980
10.6
79.7
8.9
1.6
9.7
1982
13.0
82.2
9.6
0.5
7.7
1984
14.0
74.7
17.3
0.5
7.5
1986
14.8
70.2
19.6
0.8
9.5
1988
16.7
69.8
19.9
0.5
9.9
1990
17.6
71.3
18.6
0.4
9.8
1992
19.8
66.6
21.8
0.5
11.1
1994
18.7
67.0
21.5
0.2
11.3
1996
21.4
66.6
22.6
0.1
10.8
1998
20.6
63.0
25.3
0.1
11.6
2000
20.4
60.0
29.2
0.4
10.4
2002
23.3
64.3
23.8
0.2
11.8
2004
24.8
55.6
33.2
0.0
11.2
2006
26.5
53.4
36.4
0.3
9.9
2008
25.2
56.5
39.1
0.4
4.1
2010
23.9
57.6
30.7
0.1
11.8
2011
28.8
51.6
30.2
0.1
18.2
Fig. 5
Distribution of primary energy consumption in Nigeria and the world in 2011. Data source [
11
]
Table 5
Energy production (between 1980 and 2011) in Nigeria (million toe) [
8
,
9
,
11
]
Year
Aggregate production (million toe)
As percentage of total energy production
Crude oil (%)
Natural gas (%)
Coal (%)
Hydro, wind, solar (%)
1980
113.2
90.6
0.8
0.2
8.4
1982
71.9
89.9
1.7
0.1
8.3
1984
78.5
88.3
3.1
0.1
8.5
1986
83.4
87.8
3.5
1.7
7.0
1988
83.2
87.0
3.9
0.1
8.9
1990
102.5
88.3
3.2
0.1
8.4
1992
111.2
87.3
3.9
0.1
8.8
1994
110.1
87.6
3.7
0.0
8.7
1996
114.9
86.9
4.2
0.1
8.8
1998
123.4
87.2
4.2
0.0
8.6
2000
130.4
82.8
8.4
0.0
8.7
2002
129.9
81.4
9.6
0.0
8.9
2004
148.6
78.1
13.0
0.0
8.9
2006
160.4
75.8
15.7
0.1
8.4
2008
146.2
73.8
19.8
0.1
6.3
2010
144.3
77.8
20.5
0.1
1.7
2011
156.1
78.4
18.2
0.1
3.4
Sectoral energy consumption pattern
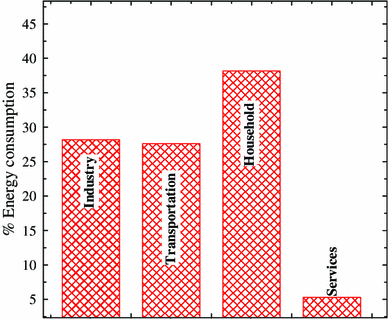
The sectoral energy consumption in Nigeria for the year 2011 is presented in Fig.
6
. The household (domestic) sector of the economy consumed the highest energy than other sectors. The energy consumption in the household increased from 25 % in 1980 to 30 % in the early 1990s. Domestic energy consumption has increased rapidly since 1990s to 38.16 % in 2011 [
36
]. The second largest consumer of energy in 2011 is the industrial sector which consumed about 28.91 % of the overall energy. Its share was 6.3 % in 1959 and rose to 15.7 % after the oil boom in 1979. The transportation sector also witnessed a rapid growth in energy consumption as more roads were constructed in the early 1980s. In 2000, energy consumption in transportation was about 13.6 % and further attained 27.62 % in 2011 as shown in Fig.
2
. The service sector has been stable since 2005 [
36
].
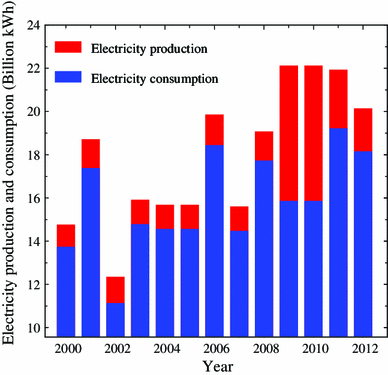
The electric power generating sector in Nigeria is relatively small when compared with the teeming population and consequent energy consumption. The overall electricity production and consumption from 2000 to 2012 are presented in Fig.
7
. The electricity production increased from 14.75 billion kWh in 2000 to 20.13 billion kWh in 2012 while consumption increased from 13.72 billion kWh in 2000 to 18.14 billion kWh in 2012. The net consumption in 2011 was 18.14 billion kWh and slightly less than the generation in 2012; due to an agreement with Niger Republic under the West African Power Pool [
37
], appreciable portion of the electricity generated was exported to Niger Republic leaving back a short fall for the entire citizenry.
Fig. 7
Electricity production and consumption (2000–2012). Data source [
33
]
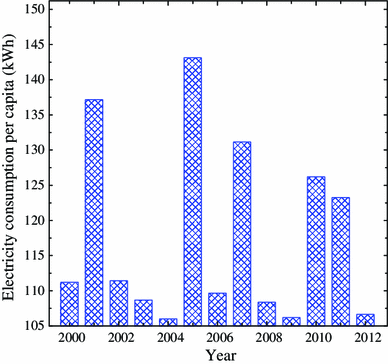
The electricity consumption per capita in Nigeria is also relatively low (Fig.
8
), decreasing from 143 kWh in 2005 to 106. 63 kWh in 2012. The power-generating sector at the moment is faced with numerous problems in the generation, transmission and distribution units coupled with low plants performance due to aging infrastructure. The current installed generating capacity of Nigeria is small with average production of about 3,200 MW (Table
6
) for a population of approximately 170 million people [
37
,
38
]. To meet the country’s power requirements, the current generation must be raised to more than twenty times the current value. Though the country has vast natural gas reserves that could be used to generate affordable and cheap power, its actual average production capacity has remained within 2,500–4,800 MW for the last decade. In a bid to meet the optimization plans through attaining the power generation gap of 26,561 MW by 2020 (Vision 20:2020), the Federal Government in October 2013 privatized the state-owned power firm to attract participations of foreign/private investments into the power sector [
39
].
Fig. 8
Electricity consumption per capita (2000–2012). Data source [
33
]
Table 6
Grid electrical power energy sources in Nigeria [
8
,
19
]
Plant
Plant type
Year of installation
Number of units installed
Installed capacity (MW)
Current number available
Capacity available (MW)
Operational capacity (MW)
Kainji
Hydro
1968
8
760
6
440
400
Jebba
Hydro
1984
6
578.4
4
385.6
300
Shiroro
Hydro
1990
4
600
4
600
300
Total
–
–
18
1,938.4
14
1,431.6
1,000
Egbin
Thermal
1968
6
1,320
4
880
600
Egbin AES
Thermal
1984
9
270
9
270
220
Sapele (GT)
Thermal
1981
10
1,020
1
90
65
Okpai
Thermal
2007
3
480
3
480
400
Afam (I, II, II, IV)
Thermal
(1965, 1976, 1978, 1982)
20
702
3
350
300
Delta (I, II, III, IV)
Thermal
(1966, 1975, 1978, 1990)
18
840
12
540
330
Omoku
Thermal
2007
6
150
4
100
80
Ajaokuta
Thermal
N/A
2
110
2
100
80
Geregu
Thermal
2007
3
414
3
414
414
Omotosho
Thermal
2007
1
8
335
80
75
Olorunsogo
Thermal
2007
8
335
2
80
35
Total
–
–
93
5,976
44
3,384
2,589
Challenges in energy expansion and sustainability
Government emphasis on energy due to the numerous challenges has been on the supply of energy to the urban centers and industrial areas, thus causing an energy inequality within the country’s energy demand profile. The current urban-centered energy strategy is inadequate, as instances of rural and sub-rural energy demand and distribution do not get to the center phase of the country’s energy expansion plans [
40
]. The rural dwellers depend solely on wood and traditional biomass for their energy need which is worsening deforestation, general environmental pollution and a great risk to increasing climate change. Consequently, for sustainable economic growth sufficient production of energy and a dependable supply system for all types of energy carriers will be necessary. This will ensure adequate availability of energy at both urban and rural areas. The challenges in energy development in Nigeria are thus summarized as follows.
Imbalance in energy demand and supply
Nigeria is a developing economy and gradually becoming more industrialized; however, much has to be done to catch up with the industrialized economies like China, Japan, etc. The energy consumption and GDP growth rates from 1980 to 2011 are presented in Fig.
9
[
11
,
12
]. The energy consumption growth rate increased from 0.4 % in 1980 to 1.10 % in 2011 with an annual percentage change of about 1.6 %. The energy consumption growth rate was far less than those for the GDP with the exception in 1992 where the GDP growth rate declined to the minimum value of 0.43 %. This essentially shows an increase in energy demand owing to rapid population growth whose teeming energy demands are being met with meager supply. The electricity consumption per capita (kWh per person) was about 107 kWh as at 2012 (Fig.
8
); this is lower than the world average value of 2,659 kWh and about 50,000 % far from the leading country (Iceland) with 52,621 kWh [
11
]. This low electric energy consumption is a strong pointer that the total energy demand will surely increase with a corresponding improvement of the economy that will be needed to attain an increase in the living standards. Nigeria has enough energy resources to meet with the challenges of energy demand. However, the major reason for the shortage of domestic energy supply may not be unconnected to the overdependence on oil and non-diversification of energy resources in the country. Hence, for sustainable development, the energy demand and supply chain must be repositioned to attain a reasonable equilibrium.
Fig. 9
Energy consumption and GDP growth rate in Nigeria (1980–2011). Data source [
11
,
12
]
Dependence on external energy resources for domestic consumption
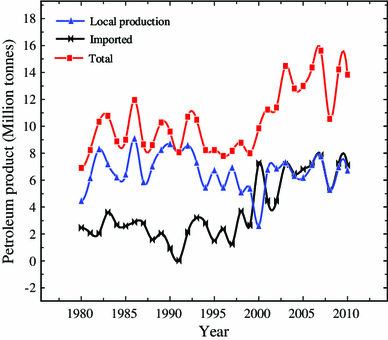
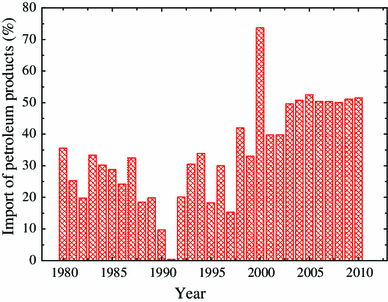
The domestic production of oil and gas has continued to grow in the last two decades while production of coal has declined to almost zero by 2011. Large percentage of the oil produced in Nigeria is exported. Though Nigeria still remains the largest producer of crude oil in the continent, her refining capacity is very low. Figures
10
and
11
show the distribution of petroleum products to the Nigerian market and the percentage import of petroleum products (PPs) from 1980 to 2010 [
11
,
40
,
41
]. The PPs supply has been through domestic crude refining capacities and from external supply. The difference between these two dimensions of supply depends on the refining strength of the local refineries. The country has five state-owned domestic refineries with cumulative production capacity of 450,000 barrels of oil per day. The country still imports over 50 % of PPs for her domestic consumption because of the inadequate refining capacity of these refineries. From 1980 to 2010 (Fig.
10
) about 323.07 million tons of PPs was supplied to the domestic market out of which 206.19 million tons were supplied by local refineries and the rest (116.97 million tons) from external supply. The distribution system (Fig.
11
) shows that 35.6 % of PPs was imported in 1980, reflecting a decreasing trend of about 0.4 % in 1991. The maximum imports of PPs were obtained in 2000 accounting for 73.7 % and followed by a decline of about 39.8 % in 2001 and 2002; about 34.76 million tons of PPs were imported from 2006 to 2010 and have remained relatively stable. A total of over 5,400 million USD was spent on subsidy for PPs between these years by the Nigerian National Petroleum Cooperation (NNPC). This situation is unhealthy for an economy that is characterized with a high level of unemployment and low technological capacity. The petroleum sector is also marked with structural problems ranging from inadequate human capacity and domestic technology needed to manage the oil dynamics especially in the downstream sector.
Furthermore, the following facts are required to move the sector forward: (1) a total restructuring of the hydrocarbon sector, (2) increase in PPs production, (3) rationalization of the decision-making mechanism by separating the different roles of NNPC, (4) privatization of the downstream activities of NNPC and (5) promotion of local contents. This becomes imperative because a robust sustainable domestic energy production will improve the standard of living, reduce poverty and boost industrialization.
Fig. 10
Petroleum product supplies in Nigeria from (1980–2011). Data source [
11
,
37
]
Fig. 11
Percentage of import of petroleum products (1980–2011). Data source [
11
,
37
]
Low energy efficiency
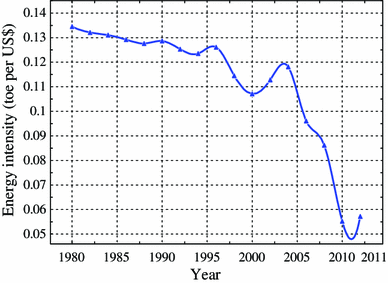
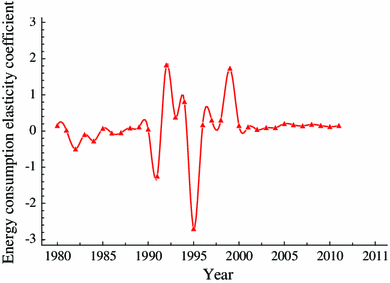
Indicators that affect energy efficiency (EE) include energy intensity (EI) and consumption elasticity coefficient (ECEC). These indicators have a strong relationship with energy efficiency as they are related to economic growth and energy consumption. EI is the ratio of energy consumption to GDP output. It is the energy required to generate one dollar unit of gross output whereas ECEC is the rate at which energy is consumed to the GDP growth rate. Low value of EI in an economy shows a high level of efficiency. Equations (
1
) and (
2
) have been applied to data in [
11
] to obtain EI and ECEC from 1980 to 2011 as depicted in Figs.
12
and
13
.
Fig. 12
Total energy intensity of Nigeria (1998–2011). Data source [
11
,
12
]
Fig. 13
Energy consumption elasticity coefficient (1980–2011). Data source [
7
]
Figures
12
and
13
show the change in overall EI and ECEC from year 1980 to 2011. The EI values decreased by 57.47 % from 0.135 to 0.057 toe per US$1,000 GDP (2005 price). In the same vein, EI from 1998 to 2011 dropped by 64.54, 37.76, 29.78, 88.15 and 85.76 % for industry, transportation, agriculture, commercial and residential sectors, respectively [
11
]. The decline in EI is a sign of efficient improvements. However, the improvements in the overall EE have been remarkably small. The sectoral EI are thus discussed:
Agricultural sector
The sectoral energy intensities in Nigeria from 1990 to 2011 are presented in Fig.
14
. The EI for some sectors has proven to improve over the years. The EI of the agricultural sector decreased by 79.6 % from 0.003 toe per US$1,000 in 1990 to 0.001 toe per US$1,000 in 1998 and its contribution to the total EI in these years was 2.7 %. From 2000 to 2004, the EI increased by 6.8 % whereas between 2008 and 2011 the EI decreased from 0.004 to 0.002 toe per US$1,000 GDP (2005 price). The intensity of energy use in the agricultural sector was remarkably small between 1998 and 2002. The contribution of agriculture to the total EI within these years was 1.2 %, indicating low energy use. However, the energy use in this sector is historically low as most production stems from subsistence agriculture characterized by high human labor intensity, little or no irrigation (rain fed agriculture) and little or no mechanized farming.
Fig. 14
Energy intensity by sectors (1990–2011). Data source [
7
,
11
]
Industrial sector
The industrial sector (Fig.
14
) experienced an increase in EI from 1990 to 1994. The EI varies from 0.032 to 0.035 toe per US$1,000 in 1990 and 1994, respectively, indicating an increase by 8.7 % and contributing about 27.8 % to the total EI in these years. Between 1996 and 2000, the EI steadily decreased from 0.031 to 0.027 toe per US$1,000 in 1996 and 2000 giving a drop of 13.55 % and a contribution to the total EI of about 25 %. Subsequently, between 2002 and 2004 the EI increased by 5.4 % and decreased significantly by 54.3 % from 2006 to 2011; this may be due to changes in government fiscal policy on the industrial sector and some forms of efficiency measures. However, the primary driving force of the energy intensity of the industrial sector is the rapid growth of investment and also, increase in number of energy intensive industries like the steel manufacturing, cement and construction.
Transportation sector
The transportation sector comprising the road, air and water remained the principal consumer of energy in Nigeria (Fig.
14
). The EI of the sector rose by 17.74 % with increase from 0.064 toe per US$1,000 in 1990 and reaching a value of 0.078 toe per US$1,000 in 1996. The contribution to the total EI from 1990 to 1996 was 55.47 %. The EI value decreased from 0.069 to 0.039 toe per US$1,000 in 1998 and 2010 indicating a drop of 43.17 % with a slight increase of 1.65 % in 2011. The contribution of the transportation sector to the total EI from 1990 to 2011 was the highest and stood at 59.63 %.
Residential/commercial sectors
The EI of the residential sector decreased from 0.010 toe per US$1,000 in 1990 to 0.001 toe per US$1,000 in 2011 reflecting a drop by 90 %. The EI of the residential sector have been on the decrease over the studied periods indicating a little use of energy in the sector. The reason for the low EI in the sector is due to the epileptic power supply and non-availability of grid supply to the rural communities of the country where about 70 % of the entire population reside. The contribution of the residential sector to the total EI from 1990 to 2011 was 3.99 %. The commercial sectors are also characterized with low EI values. The EI of the sector decreased from 0.019 toe per US$1,000 in 1990 to 0.002 toe per US$1,000 in 2011 having drop of 89.47 %. The contribution of the sector to the total EI between 1990 and 2011 was 7.84 and 3.85 % above that of the residential sector. The sector witnessed an increase in EI by 28.1 % between 1994 and 1996 followed by a 17.27 % decrease between 2000 and 2002. The fluctuations in the performance may be attributed to the unstable economic policies. However, the commercial and the residential sectors have been characterized with low energy use which is an evidence of low energy use activities.
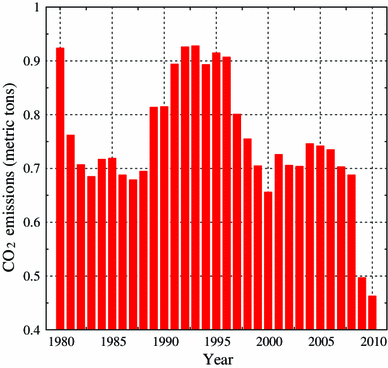
The period 1980 to 2000
The period from 1980 to 2000 was characterized by decrease in total EI and CO
2
emissions per unit GDP as shown in Figs.
9
and
15
. The overall CO
2
emissions and per person CO
2
emissions were also found to increase as the energy consumption increases. The average GDP growth rate was 2.45 % while the energy consumption growth rate was 0.39 %. This was satisfactory for a sustainable development where the energy consumption growth rate was reasonably lower than the GDP growth rate. It was observed that the ECEC within this period was around 0.15 and from 1992 to 1995 the country’s economy improved with a corresponding reduction in energy consumption leading to a negative ECEC (Fig.
13
).
Fig. 15
Per capita CO
2
emissions from the consumption of energy (1980–2010). Data source [
41
]
The period 2001 to 2004
The period from 2001 to 2004 witnessed an increase in energy consumption with a corresponding increase in CO
2
emissions per capita. The ECEC at this period was 0.20 with a 12 % increase in EI (Fig.
13
). The GDP growth rate shown in Fig.
9
was 5.2 % while the energy consumption growth rate was 0.98 %; this may be attributed to the increase in investment, the resuscitation and establishment of the cement industry, small steel industries, establishment of new gas turbine plants and the rapid growth witnessed in the telecommunication industries. For example, MTN a telecom company and the leading mobile phone provider in Nigeria had over 6,000 diesel generators installed for power supply in its base stations. The plants operate for 20 h a day, and the company spends about 5.5 million USD on diesel fuel yearly to keep the plants running [
41
,
42
]. Other providers also exist to give a boom to the sector. It will also be deduced that the improvement of the economy from 1980 to 2000 and from 2001 to 2004 was marginal.
The period 2005 to 2011
From 2005 to 2011, there was a decline in EI but the energy consumption growth rate was almost steady though declined in between years. The EI for the industrial sector (Fig.
14
) was found to have dipped from 0.022 to 0.011 toe per US$1,000 while the CO
2
emissions per capita (Fig.
15
) declined by 37.6 % from 2005 to 2010. The GDP and energy consumption growth rates were 2.11 and 0.06 %, respectively. This small sustainable improvement in energy efficiency obtained especially between 2005 and 2011 was attributed to policy measures and energy programs launched by the Energy Commission of Nigeria (ECN) in 2004 [
43
]. In addition, the low energy growth rate from 2005 to 2011 may be attributed to the decay in the performance of the industrial sector. The contribution of the industrial sector in real GDP declined from 3.59 % in 2009 to 4.49 % in 2010 while that of the transportation declined from 6.83 % in 2009 to 6.79 % in 2010. The drop in performance of the industrial sector was due to inadequate infrastructure especially energy, transport, high cost of funds, multiple taxation and small domestic patronage whereas for the transportation sector, the low trade-associated activities and the poor state of the highways decelerated the growth [
44
].
Challenges of carbon pollution
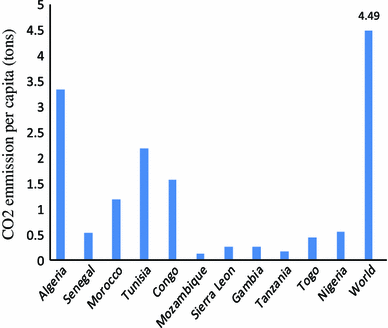
Crude oil and natural gas account for about 42 and 32 % of the country’s total energy consumption compared to 48 and 20 % of the world average values (Fig.
5
). Pollutant emissions in Nigeria are mostly from consumption of these energy sources and accounts for over 75 % of CO
2
emissions. The major sources of CO
2
emissions are from coal and crude oil/petroleum consumption due to their respective carbon content. The total CO
2
emission has increased steadily from 94 to 101 million metric tons between 1992 and 1996. Coal accounted for 2.8 % of CO
2
emissions while natural gas consumption, natural gas flaring and petroleum consumption accounted for 15.69, 62.94 and 33.61 % of CO
2
emissions, respectively [
11
]. The total CO
2
emissions from gas flaring dropped from 62.94 % in 1996 to 47.23 % in 2011. This drop was due to government policy directing all oil-producing companies to shut in oil fields where the gas production and flaring were considerably more than the crude oil produced. This culminated into a reduction in the volume of gas flared from 2.5 to 1.5 bcf/d in 2010 [
45
]. With the country trailing the path of industrialization, there is large potential for the total CO
2
to increase as the energy consumption rises to compensate for the growing and economy. The comparison of per capita CO
2
emission for some selected African countries in 2009 is presented in Fig.
16
. The world CO
2
emissions per capita were estimated at 4.49 tons in 2009 [
45
], with Nigeria having a share of 0.52 tons; Algeria and Tunisia emitted the highest value of 3.33 and 2.18 tons, respectively. In 2011, Nigeria contributed about 0.32 % to the world CO
2
emissions recording a dip of about 0.002 % from 2009 [
46
]. Furthermore, Africa has the potential of CO
2
increase and based solely on the ground that the majority of countries in Africa are growing almost simultaneously and struggling for economic independence from the large economies. This growth will inevitably be complimented with an increase in energy consumption and the consequent increase in CO
2
emission.
Fig. 16
Comparison of CO
2
emission per capita of some African countries in 2009. Data source [
42
]
Energy policies in Nigeria
In 2004, the National Energy Policy provided a framework for optimal use of the country’s energy resources (renewable and conventional) for sustainable development [
43
]. This includes to [
43
]:
Ensure adequate growth of the country’s energy resources, with varying energy resource options, for the implementation of national energy security, efficient energy supply system and a balanced energy mix,
Ensure increased contribution of energy productive activities to federal income,
Guarantee adequate, reliable and sustainable energy supply at competitive costs and in an environmentally sustained manner, to the different segments of the national economy for substantial development,
Ensure an efficient and cost-effective utilization form of energy resources,
Expedite the process of acquisition and dissemination of technology and managerial competence in the sector and strengthen local content for adequate stability and self-sufficiency,
Promote increased investments and expansion of the energy sector industries with significant private sector participation,
Develop a comprehensive, integrated and well-defined plan for the sector and initiate successful developmental programs,
Promote international cooperation in energy marketing and projects development in both the African continent and the entire world,
Manage the nation’s abundant energy resources to promote international cooperation.
Sustainable energy development strategies
One of the major strategies to meet energy demand is through the adoption of energy-efficient appliances. ECN/UNDP through a project has completed energy efficiency and conservation plans to reduce energy consumption at the residential sector by the replacement of incandescent bulbs with energy-saving bulbs [compact fluorescent lamps (CFL)]. The commission has recognized the fact that lighting alone takes more than 18 % of the total power consumed in the residential sector compared to about 8–11 % in the advanced countries [
47
]. It is projected that Nigeria needs about 50 million CFL’s to replace the incandescent lamps in the residential sector; with this replacement, a saving of approximately 1,500 MW of electricity can be achieved. Other efficient master plan includes, the phasing out of backward generating capacity having low efficiency and rather investing in smart grid, enhancing electrical equipment through technological innovation for improved energy efficiency, introducing a national building codes, establishing federal efficiency standards to reduce electricity consumption, ensure appliances labeling and certification and energy conservation and management in industries.
In addition, the following sustainable strategies were pronounced according to the Renewable Energy Master Plan (REMP) [
30
] viz: (1) the need to move from a fossil economy to one driven by growing share of renewable energy and (2) harnessing renewable energy resources in a manner and at prices that will support the implementation of equitable and sustainable development. In this framework, the projected energy demands in the sectors of the economy are presented in Table
7
based on 7 % growth rate. To meet with this demand, the target is to get solar contribution of 5, 75, and 500 MW to the energy mix structure in 2012, 2015 and 2025, respectively, while wind power contribution is set at 1, 19 and 38 MW for same years for short term, medium term and long term in both cases [
19
].
Table 7
Projected sectoral energy demand in Nigeria based on 7 % growth rate [
19
]
Sector
2010
2015
2020
2025
2030
Industry (%)
28.92
37.01
40.75
14.69
48.78
Transport (%)
27.62
24.56
22.92
22.27
21.62
Household (%)
38.16
33.05
30.62
27.27
24.12
Service (%)
5.30
5.39
5.72
5.78
5.49
Patterns of energy expansion strategies
The government expansion strategy in the energy sector includes the integration of energy resources that are non-fossil into the energy mix structure. Renewable energy is expected to contribute about 14, 23 and 36 % for short, medium and long term of the overall energy and electricity supply in Nigeria by 2030. The targets for renewable energy production are presented in Table
8
. Furthermore, wind energy resources in the short term will require an increase of more than a hundred percentage to produce 30 MW in 2015 and 40 MW in 2030. Some wind power projects are being in existence and operational (though on a small scale). Solar PV installations are on the increase and about 1 MW total dispersed installations are going on country wide for low energy applications such as water pumping, street lighting, vaccine refrigerators and community lighting [
48
].
Table 8
Targets for renewable power generation (MW) in Nigeria [
19
]
Resources
Short term 2008
Medium term 2015
Long term 2030
Hydro (large)
11,259
15,930
48,000
Hydro (small)
3,500
7,430
11,900
Solar PV
5
120
500
Solar thermal
–
1
5
Biomass
–
100
800
Nuclear
–
1,000
4,000
Wind
1
30
40
All renewable
14,765
24,611
65,245
All energy resources
17,000
30,000
190,000
Conclusions
Nigeria is the largest and most populated country in Africa; a fast-developing nation and a major player among oil-producing countries in the world. The country is still lacking in terms of providing sufficient energy to run her economy despite the high increase in demand. The energy consumption has increased in the last three decades. The consumption rate increased by 3.6 % in 2011 over that in 2010, giving a total energy utilization of about 4.4 quadrillion with traditional biomass while wastes contribute about 82 % of the overall energy consumption. The estimated conventional energy reserve in 2011 stood at 2.7 billion tons for coal, 37.2 billion barrels for crude oil and 5.1 trillion cubic meters for natural gas. The country is also naturally endowed with vast deposition of renewable energy resources.
Furthermore, most of the challenges faced by the energy sector were found to exist from imbalance in energy demand and supply, dependence on external energy resources for domestic consumption, low energy efficiency and environmental pollution. Hence, in a bid to address these problems, the government has structured strategies which include reduction of energy consumption in the residential and industrial sector through an effective energy conservation and management system, with the integration of renewable and clean energy resources into the total energy mix. Under this new policy, the energy demand and supply is expected to be implemented in a sustainable way to achieve the needed balance between economic development, social development and eco-friendly protection.
Acknowledgments
Authors appreciate the Library staff of Central Bank of Nigeria, Calabar for their cooperation in making it possible to access the data used for this study.
Conflict of interest
The authors declare that there are no conflicts of interests regarding the publication of this article.
Authors’ contributions
FIA collected data and drafted the manuscript. BNN, OSO carried out a thorough review and evaluation of the data. FIA and SAO supervised the study and approved the first draft. The authors all read and approved the final manuscript.
References
Ajayi and Ajanaku (2007) Nigeria’s energy challenge and power development: the way forward (pp. 1-3)
Kalu and Tomasz (2010) Sustainable energy development: the key to a stable Nigeria (pp. 1558-1570) 10.3390/su2061558
Ohunakin (2010) Energy utilization and renewable energy sources in Nigeria (pp. 171-177) 10.3923/jeasci.2010.171.177
Suleiman, S.: Energy consumption and economic growth: causality relationship for Nigeria. OPEC Energy Rev.
34
(1), 15–24 (2010)
National Bureau of Statistics (NBS) (2007). National Core Welfare Indicator Questionnaire (CWIQ) Survey. National Bureau of Statistics (NBS), Abuja, p 2, Summary Sheet
M2M Workshop—Nigeria: Nigeria’s Country report on coal mine methane recovery and use, presented at the methane to markets regional workshop, December 2, 2005, Beijing, China
Coal exploration and power generating opportunities in Nigeria. The ministry of mines and steel development (2010).
http://mmsd.gov.ng/Downloads/Coal.pdf
. Accessed 12 July 2013
Energy commission of Nigeria. ECN annual report, Abuja (2011)
Iloeje, OC: Renewable energy development in Nigeria: status and prospects. In: Proceedings of a National workshop on energizing rural transformation in Nigeria: scaling up electricity access and renewable energy (2002)
Ohunakin et al. (2013) Economic analysis of wind energy conversion systems using levelized cost of electricity and present value cost methods in Nigeria10.1186/2251-6832-4-2
Oyedepo et al. (2012) Analysis of wind speed data and wind energy potential in three selected locations in south-east Nigeria10.1186/2251-6832-3-7
Idris et al. (2012) Nigeria’s wind energy potentials: the path to a diversified electricity generation-mix 2(4) (pp. 2434-2437)
Ohunakin (2011) Wind resources in North-East geopolitical zone, Nigeria: assessment of the monthly and seasonal characteristics (pp. 1977-1987) 10.1016/j.rser.2011.01.002
Ohunakin (2011) Assessment of wind energy resources for electricity generation using WECS in North-Central region, Nigeria (pp. 1968-1976) 10.1016/j.rser.2011.01.001
Ohunakin et al. (2011) Wind energy evaluation for electricity generation using WECS in seven selected locations in Nigeria (pp. 3197-3206) 10.1016/j.apenergy.2011.03.022
Adaramola et al. (2012) Techno-economic evaluation of wind energy in southwest Nigeria 6(4) (pp. 366-378) 10.1007/s11708-012-0205-y
Akin (2008) Nigeria’s dual energy problems: policy issues and challenges inter (pp. 17-18)
Energy Commission of Nigeria and United Nations Development Programme (ECN-UNDP). Renewable Energy Master Plan (REMP): final draft report (2005)
Sambo, AS: Renewable Energy Development in Nigeria. In: Energy commission of Nigeria paper presented at the World’s future council and strategy workshop on renewable energy, Accra, Ghana, June, 2010
Okafor and Joe-Uzuegbu (2010) Challenges to development of renewable Energy for electric power sector in Nigeria 2(2) (pp. 211-220)
Oloketuyi et al. (2013) Determination of optimum tilt angles for solar collectors in low-latitude tropical region10.1186/2251-6832-4-29
Ohunakin et al. (2014) Solar energy applications and development in Nigeria: drivers and barriers (pp. 294-301) 10.1016/j.rser.2014.01.014
Central Bank of Nigeria (CBN) Annual report and statement of accounts (2012)
Electricity production and consumption in Nigeria (2012).
http://www.indexmundi.com
. Acessed 08 Sept 2013
Abam et al. (2011) Thermodynamic assessment of grid-based gas turbine power plants in Nigeria (pp. 1026-1033)
Demand side management and efficient lighting initiatives in Nigeria. Paper presented at the WEC Africa Workshop on Energy Efficiency Addis Ababa, Ethiopia 29–30 June 2009
Huld, T, Šúri, M, Dunlop, E, Albuisson, M, Wald, L: Integration of HelioClim-1 database into PVGIS to estimate solar electricity potential in Africa. In: Proceedings from 20th European photovoltaic solar energy conference and exhibition Barcelona, Spain. 6–10 June 2005