Department of Mechanical Engineering, Technological University of Panama, Panama, PA
Department of Biological and Agricultural Engineering, Kansas State University, Manhattan, KS, 66506, US
USDA Agricultural Research Service, National Laboratory of Agriculture and the Environment, Ames, IA, 50011, US
Department of Agronomy, Kansas State University, Manhattan, KS, 66506, US
Department of Chemical Engineering, Kansas State University, Manhattan, KS, 66506, US
Abstract
Pen surface amendments for mitigating emissions of greenhouse gases (GHGs), such as nitrous oxide (N
2
O), methane (CH
4
), and carbon dioxide (CO
2
), from beef cattle feedlots, were evaluated under controlled laboratory conditions. Amendments were organic residues (i.e., sorghum straw, prairie grass, woodchip), biochar from those organic residues and from beef cattle manure, and activated carbon. Manure samples were collected from several randomly selected pens from two beef cattle feedlots in Kansas and used in the experiments, either as dry (0.10 g · g
−1
wet basis water content) or moist (0.35 g · g
−1
wet basis). For each amendment, four different treatment levels (i.e., amounts of material) were placed on top of manure samples in glass containers and analyzed for GHG emissions using a photo-acoustic infrared multi-gas analyzer. From measured concentrations, emission rates were determined. For the dry manure conditions, all amendment materials showed significant reduction of N
2
O and CO
2
emissions compared to the control (i.e., no amendment). For the moist manure conditions, none of the amendments showed significant effects on GHG emissions during the first 8 days; at days 10 and 15 after application, however, the biochar materials performed significantly better than the control (i.e., no surface amendment) in reducing N
2
O and CH
4
emissions. No significant difference was observed in GHG emissions when the amendments were placed on top or mixed within the top surface layer of the manure.
Background
Animal feeding operations (AFOs), such as open beef cattle feedlots, emit a variety of air pollutants, including particulate matter (PM), ammonia (NH
3
), odor, and volatile organic compounds (VOCs) that have the potential to cause health problems to workers and neighbors. In addition, they emit greenhouse gases (GHGs), including carbon dioxide (CO
2
), methane (CH
4
), and nitrous oxide (N
2
O) [
1
], and their contribution to climate change is a growing environmental concern [
2
]. Global increases in anthropogenic CO
2
concentrations are largely due to fossil fuel use and industrial processes. For CH
4
, increases have come through both industrial and agricultural activities, whereas increases in N
2
O are primarily from agricultural activities with soil management as its main source [
3
,
4
]. Ruminant livestock operations are considered significant contributors to global CH
4
concentration [
3
,
4
].
Numerous factors can influence the emission of GHGs from beef cattle feedlots. Woodbury et al. [
5
] reported that pen surfaces in cattle feedlots were aerated and highly organic and favorable for both mineralizing and nitrification, while the sub-surfaces were compacted with anaerobic zones making them susceptible to denitrification. This co-existence of both nitrification and denitrification processes in tandem have also been reported to occur with manure composting [
6
,
7
]. However, the process of denitrification and subsequent N
2
O emission is highly variable with surface water content controlling surface emission flux rates [
8
]. This observation is also supported by Woodbury et al. [
5
], who found that denitrifying enzyme activity was highly variable both seasonally and spatially. Aguilar [
8
] reported that moist/muddy surface conditions (0.52 cm
3
· cm
−3
) had the largest median emission flux of 2.03 mg · m
−2
· h
−1
compared to either dry or flooded conditions with median fluxes ranging from 0.10 to 0.16 mg · m
−2
· h
−1
. The highly variable nature of emissions from feedlot surfaces has also been shown to occur for other compounds, including NH
3
, VOCs, and CO
2
[
9
].
Considering that cattle feedlots could potentially contribute significantly to global N
2
O levels, some mitigation strategies must be undertaken to reduce emissions. Nitrification inhibitors have been suggested as a possible mitigation strategy and research has shown the effectiveness of these compounds [
10
–
14
]. Nitrification inhibitors are chemicals used to reduce the rate ammonium converts to nitrate and they have been shown to be effective in reducing N
2
O emissions from soils. However, costs and animal safety issues make the use of nitrification inhibitors less attractive for AFOs. Alternatively, Adams et al. [
15
] reported that the manipulation of manure carbon/nitrogen (C:N) ratio by direct application of organic matter to the pen surfaces, might be an effective mitigation strategy used to decrease N losses. Consequently, soil amendments that can change the C/N ratio might be a cost-effective means of reducing GHG emissions from cattle feedlots.
This study was conducted to evaluate the effectiveness of surface amendments (i.e., organic residues and biochar) in reducing emission of GHGs from feedlot manure. The effects of manure water content (i.e., dry vs. moist) and the means of application of the amendment (i.e., topical vs. mixed) were also considered.
Methods
Experiments
A series of laboratory experiments was conducted to evaluate the effectiveness of pen surface amendments in reducing emissions of N
2
O, CH
4
, and CO
2
from feedlot manure. Amendments were organic residues (i.e., sorghum straw, prairie grass, woodchip), biochar from those organic residues and from beef cattle manure, and activated carbon. Table
1
summarizes the experimental parameters for the different experiments. Approximately 130 kg of manure was collected from several randomly selected pens in two beef cattle feedlots in Kansas. The collected manure was completely mixed and air dried for several days until the average gravimetric water content (wet mass basis) reached approximately 0.10 g · g
−1
. Large clods were removed manually from the dry manure and from the amendment materials. The dry manure and amendment materials were sieved using an ASTM E-II No 4 (4.75 mm) standard sieve. For each amendment, four different amounts of material were applied on top of manure samples within glass containers and analyzed for GHG emissions using a photo-acoustic infrared multi gas analyzer.
Table 1
Experimental parameters
Experiment
Manure conditions (wet basis)
Amendment
Water content (g · g−1)
Bulk density (g · cm−3)
Material
Wet bulk density (g · cm−3)
Treatment
Amount (mm or g)
Mass/Surface area (kg · m−2)
1
Topical application of organic residues and biochar on moist manurea
0.35
1.1
WC
0.36
0, 1, 3, 5 mm
0, 0.36, 1.08, 1.80
SS
0.14
0, 1, 3, 5 mm
0, 0.14, 0.42, 0.71
PG
0.12
0, 1, 3, 5 mm
0, 0.12, 0.35, 0.58
WCB
0.41
0, 1, 3, 5 mm
0, 0.41, 1.23, 2.05
SSB
0.16
0, 1, 3, 5 mm
0, 0.16, 0.48, 0.79
PGB
0.14
0, 1, 3, 5 mm
0, 0.14, 0.43, 0.71
2
Topical application of biochar and activated carbon on moist manurea
0.35
1.1
WCB
0.41
0, 1, 3, 5 mm
0, 0.41, 1.23, 2.05
SSB
0.16
0, 1, 3, 5 mm
0, 0.16, 0.48, 0.79
PGB
0.14
0, 1, 3, 5 mm
0, 0.14, 0.43, 0.71
PMB
1.02
0, 1, 3, 5 mm
0, 1.02, 3.05, 5.08
LMB
0.53
0, 1, 3, 5 mm
0, 0.53, 1.59, 2.65
EAC
0.62
0, 1, 3, 5 mm
0, 0.62, 1.86, 3.09
PAC
0.38
0, 1, 3, 5 mm
0, 0.38, 1.14, 1.89
3
Topical application of organic residues and biochar on dry manureb
0.10
0.48
WC
0.36
0, 1, 3, 5 mm
0, 0.36, 1.08, 1.80
SS
0.14
0, 1, 3, 5 mm
0, 0.14, 0.42, 0.71
PG
0.12
0, 1, 3, 5 mm
0, 0.12, 0.35, 0.58
WCB
0.41
0, 1, 3, 5 mm
0, 0.41, 1.23, 2.05
SSB
0.16
0, 1, 3, 5 mm
0, 0.16, 0.48, 0.79
PGB
0.14
0, 1, 3, 5 mm
0, 0.14, 0.43, 0.71
4
GHG emission from organic residues and biocharsc
-
-
WC
0.36
0, 10 g
0, 1.5
SS
0.14
0, 10 g
0, 1.5
PG
0.12
0, 10 g
0, 1.5
WCB
0.41
0, 10 g
0, 1.5
SSB
0.16
0, 10 g
0, 1.5
PGB
0.14
0, 10 g
0, 1.5
PMB
1.02
0, 10 g
0, 1.5
LMB
0.53
0, 10 g
0, 1.5
EAC
0.62
0, 10 g
0, 1.5
PAC
0.38
0, 10 g
0, 1.5
5
Mixing of organic residues and biochars with manurea
0.35
0.60
LMB
0.53
0, 20 g
0, 3.0
EAC
0.62
0, 20 g
0, 3.0
6
Adsorption as mechanism of GHG mitigationd
-
-
WCB
0.41
0, 25 g
0, 3.8
LMB
0.53
0, 60 g
0, 9.0
EAC
0.62
0, 50 g
0, 7.5
The elemental composition of each organic residue and biochar is summarized in Table
2
. The elemental composition was measured by grinding a sample (30 g) of each material to 0.5 mm using a sample mill (Model 3010–018, Udy Corp., Fort Collins, CO, USA) and then analyzing each ground sample (2 to 3 mg ± 0.001 mg) in an Elemental Analyzer (Model 2400, Series II Perkin Elmer, Norwalk, CT, USA).
Table 2
Elemental composition of the materials used as surface amendments
Material
Composition (%)
C/N
Carbon
Hydrogen
Nitrogen
Sulfur
Woodchip (WC)
46.85
6.13
0.53
1.03
89:1
Sorghum straw (SS)
43.11
5.93
0.92
1.04
47:1
Prairie grass (PG)
44.19
6.07
0.90
1.10
49:1
Woodchip biochar (WCB)
59.82
2.42
0.94
0.40
64:1
Sorghum straw biochar (SSB)
58.38
1.63
1.13
0.28
52:1
Prairie grass biochar (PGB)
63.32
2.51
1.65
0.43
38:1
Pellet manure biochar (PMB)
10.39
0.46
1.05
0.31
10:1
Loose manure biochar (LMB)
14.13
0.51
0.92
0.25
15:1
Pellet-activated carbon (EAC)
83.44
0.43
0.83
0.41
101:1
Powder-activated carbon (PAC)
86.69
0.53
0.54
0.06
162:1
Experiment 1 - topical application of organic residues and biochar on moist manure
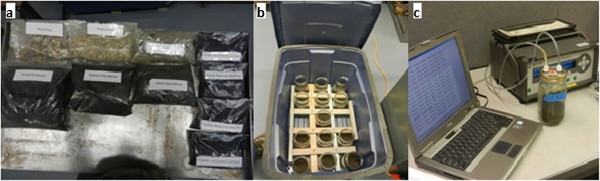
Experiment 1 considered the effects of topical application of organic residues and biochar on moist manure. Samples were prepared by mixing 238 g of dry manure (0.10 g · g
−1
water content wet basis) and 92 g of water at 22°C in 1-L wide-mouth glass containers, which were used as static flux chambers (SFCs). The water content of the moist manure was 0.35 g · g
−1
wet basis, which is similar to the average manure water content for pen surfaces observed in the field [
8
]. The moist manure was then compacted at 1.1 g · cm
−3
. Containers were kept uncapped in an enclosed space at approximately constant humidity and temperature for stabilization purposes during a period of 12 h before treatment application (Figure
1
b). In this experiment, amendments were woodchip, sorghum straw, prairie grass, woodchip biochar, sorghum straw biochar, and prairie grass biochar (Figure
1
a). Biochars were obtained from gasification of the organic residues in a laboratory updraft reactor.
Figure 1
Photographs of the experiment. (a)
Amendment materials,
(b)
glass containers with the compacted moist manure, within a plastic container with water at the bottom to maintain constant manure water content, and
(c)
measurement set up.
The prepared glass containers were randomly selected and fixed amounts (treatments) of the amendment were applied on top of the compacted manure within the containers, as indicated in Table
1
. The containers with manure but without any amendment served as the control. The amendment materials showed large differences in wet bulk density (Table
1
). Due to the small volume of the containers (1 L) used in the experiment, treatments were designed such that each would result in the same headspace volume for all amendment materials. Therefore, for each amendment material, treatments consisted of different thicknesses of the material applied on top of the manure within the containers. There were four treatments (i.e., 0 mm or control, 1 mm, 3 mm, and 5 mm), with three replicates each. The amount of amendment corresponding to each treatment was computed based on the actual wet bulk density of each amendment. As a consequence of the different wet bulk densities, the same treatment for different amendments required different masses per unit surface area (Table
1
).
The initial gas sampling of each container was performed 45 min after treatment application. Before sampling, the headspace of each glass container was flushed with ambient air to ensure that GHG concentrations were at ambient levels [
16
]. Then, the container being sampled was capped and immediately, air from its headspace was circulated through a photo-acoustic infrared multi-gas analyzer or PIMA (Model 1312, AirTech Instruments, Ballerup, Denmark) [
17
,
18
] equipped with optical filters for measuring N
2
O, CH
4
, and CO
2
, and water vapor. The PIMA was connected by two 0.5-m-long Teflon tubes as inflow and outflow to the glass container, as shown in Figure
1
c. Readings of the headspace concentrations were taken every 50 s from 0 to 10 min. Gas emissions were determined for each container. Sampling was conducted once a day for 3 days within a 5-day period (i.e., days 1, 3, and 5, with the day of treatment application serving as day 1). During this period, containers were kept uncapped in an enclosed space at approximately constant humidity and temperature conditions (Figure
1
b). For each sampling day, the laboratory air temperature and pressure were recorded with liquid-in glass thermometer and barometer, respectively. Manure gravimetric water content and temperature from each container were also measured during the sampling period.
Experiment 2 - topical application of biochar and activated carbon on moist manure
Based on results from Experiment 1, Experiment 2 was conducted to further evaluate the effectiveness of different biochars in mitigating GHG emission from moist manure. Sample preparation, treatments, and the experimental setup were similar to those for Experiment 1. However, sampling was conducted once a day for 6 days within a 15-day period (i.e., days 1, 3, 5, 8, 10, and 15). In addition to the biochars in Experiment 1 (i.e., woodchip, sorghum straw, and prairie grass biochars), Experiment 2 also included manure biochar and activated carbon as amendments.
Experiment 3 - topical application of organic residues and biochar on dry manure
Experiment 3 was conducted to evaluate the effectiveness of several amendment materials in mitigating GHG emissions from dry manure. In this experiment, 238 g of dry manure (0.10 g · g
−1
water content wet basis and 0.55 g · cm
−3
wet bulk density) were placed into 1-L glass containers; no water was added. Amendments and treatments were the same as those for Experiment 1. Control was dry manure without any amendment. Gas sampling was performed in the same fashion as for Experiments 1 and 2; however, in this case, sampling was conducted once a day for 3 days within a 5-day period (i.e., days 1, 3, 5).
Experiment 4 - GHG emission from the organic residues and biochars
To assess the potential contribution of the amendments to the GHG emission, 10 g of each amendment material were placed in 1-L glass containers. Treatments were the organic residues and biochars. Two controls were considered: (1) empty containers and (2) containers containing moist manure with gravimetric water content of 0.35 g · g
−1
wet basis and bulk density of 1.1 g · cm
−3
. Each treatment had two replications. All amendment materials used in the previous experiments were assessed (Figure
1
a). Gas samples were collected once a day for 3 days within a 5-day period (i.e., days 1, 3, and 5).
Experiment 5 - mixing of biochars with manure
Experiment 5 was conducted to evaluate the effectiveness of biochars in mitigating GHG emissions when mixed within the top manure layer. Amendment materials to mitigate GHG emissions from pen surfaces in beef cattle feedlots are meant to be placed on the pen surfaces; however, with animal activity, some of the amendments are expected to be mixed with the top surface layer of the moist and loose areas of the pen, while others will remain on the top of the harder and drier pen surfaces. Fixed amounts of manure and water, as described in experiment 1, were mixed in the 1-L glass containers within 2 min (0.35 g · g
−1
wet gravimetric water content and 0.66 g · cm
−3
wet bulk density). As soon as each manure sample was prepared, the treatment was mixed within the first 5-cm top layer in the container. Treatments included 20 g of manure biochar and 20 g of activated carbon. Control was moist manure without any amendment. There were two replications for each treatment. Gas samples were collected once a day for 4 days within a 10-day period (i.e., days 1, 3, 5, and 10).
Experiment 6 - mechanism of GHG emission reduction
Experiment 6 was conducted to determine if gas adsorption is a possible mechanism in mitigating GHG emission from pen surfaces. In this experiment, 500-cc glass containers were used as sealed chambers, in which, 150 cc of standard N
2
O gas (3.5 ppm) were injected into the container. Amendment materials (treatments) were woodchip biochar, loose manure biochar, and activated carbon. They were first oven-dried at 125°C for 12 h to desorb any trace gases. During sampling, 25, 60, and 50 g of woodchip biochar, manure biochar, and activated carbon, respectively, were placed into the containers and capped with a lid prepared for syringe sampling. The control treatment was an empty container with indoor air. There were two replications for each treatment. The amendments’ masses were computed to allow a headspace volume of 400 cc. Within 2 min after treatment preparation, 3-cc air samples were collected from the containers and analyzed for N
2
O concentration using a GC (Model GC-14B, Shimadzu Scientific Instrument, Columbia, MD, USA). The GC had a Porapak-Q (80/100 mesh) stainless steel column (3.175 × 10
–3
m diameter by 1 m length), electron-capture detector, and UHP/zero nitrogen carrier gas. The oven, injector, and detector temperatures were 60°C, 100°C, and 300°C, respectively, as described by Bremer [
19
]. The first sample was considered as the base line N
2
O concentration for each treatment. As soon as the first sample was collected, 100 cc of air were extracted from the containers and then, 150 cc of N
2
O 3.5 ppm standard gas were injected into each container. In this manner, a low positive pressure was always present in the containers even after the final sampling event. Ten minutes after the N
2
O standard gas injection, a second 3-cc headspace air sample was collected from each container and analyzed in the GC for N
2
O concentration. Fifty minutes later, gas sampling was repeated. After the first day, headspace gas sampling was then repeated once a day for 4 more days within a 6-day period (i.e., days 2, 3, 4, and 6).
As soon as the last gas samples were taken, the containers were placed into an oven (Model OV-500B-1, Blue M Electric Co., Blue Island, IL) and heated to reach different temperatures (35°C, 40°C, and 75°C). Each temperature setting was kept for 2 h and then, 3-cc gas samples were taken from the containers and analyzed in the GC for N
2
O gas concentration. Finally, once the final temperature was reached and gas samples collected, the oven was turned off, letting the containers to cool down to room temperature (23°C) for 24 h. A final gas sample was collected from each container and analyzed in the GC.
Data analysis
The emission flux from each container was calculated from mass balance, that is
F=kV/AΔC/Δt,
where
k
is a conversion constant,
V
is headspace volume,
A
is surface area, and
ΔC
/
Δt
is the change in gas concentration with time within the enclosed space. In general, the relationship between gas concentration and time within the enclosed space was linear; as such, the slope (
S
) of the linear regression between gas concentration and time was used to represent
ΔC
/
Δt
(ppm · min
−1
). For experiments involving moist manure (experiments 1, 2, and 5), the average
R2
values ± standard deviation for the linear relationship between gas concentration and time were 0.99 ± 0.01, 0.99 ± 0.01, and 0.90 ± 0.20 for N
2
O, CO
2
, and CH
4
, respectively.
In general, the gas emissions depended on their previous day’s flux. To account for the correlation between emission flux values, the Autoregressive One, AR(1), structure was used on the residuals. Data were analyzed using Proc Glimmix of SAS [
20
] using a 5% level of significance.
P
values were adjusted by Tukey [
21
]. When the Type III test of fixed effects indicated no significant (treatment) × (time) interaction, the treatment effects were analyzed and compared to the control. When (treatment) × (time) interaction was significant, analysis was done based on sampling days.
Results and discussion
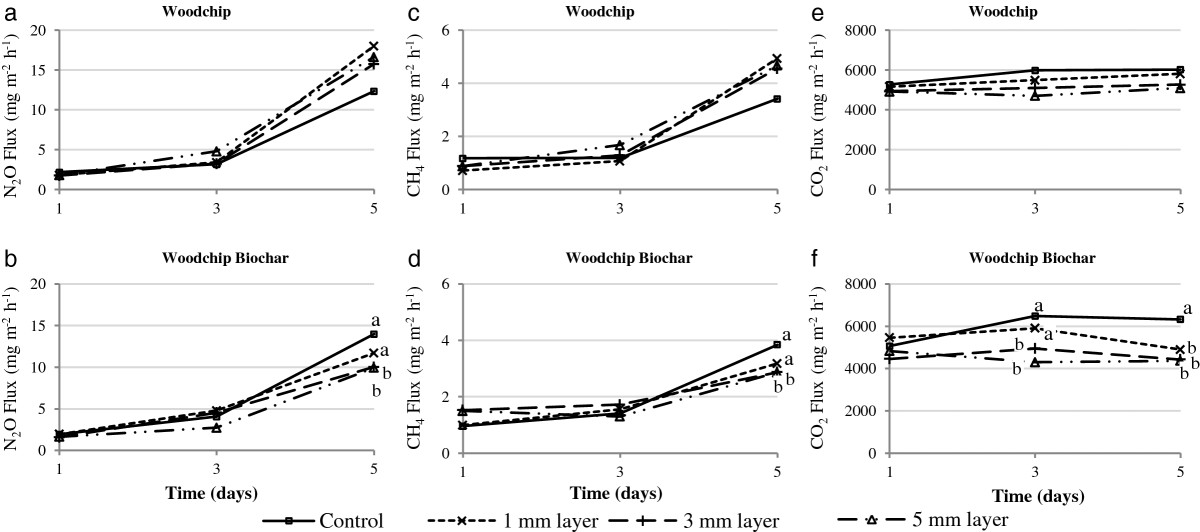
Experiment 1 - topical application of organic residues and biochar on moist manure
For each treatment and control, emissions of N
2
O and CH
4
increased with sampling day; the increase was generally much higher from sampling days 3 to 5 than from samplings day 1 to 3. The emissions of CO
2
, on the other hand, did not change much with sampling day. Figure
2
shows results of GHG emissions from moist manure amended with woodchip and woodchip biochar. Statistical analysis showed significant (treatment) × (time) interactions, as such, comparison of treatments with control was based on sampling days. In general, topical application of the organic residues on the manure sample showed some reduction, although not significant, in emissions. However, the biochars at 3- and 5-mm levels significantly reduced GHG emissions at sampling day 5; CO
2
emissions were also significantly reduced on day 5 even with a 1-mm amendment of woodchip biochar (Figure
2
).
Figure 2
Effects of topical application of woodchips and woodchip biochar on greenhouse gas emissions from moist manure.(a)
effect of WC in N
2
O flux,
(b)
effect of WCB in N
2
O flux,
(c)
effect of WC in CH
4
flux,
(d)
effect of WCB in CH
4
flux,
(e)
effect of WC in CO
2
flux, and
(f)
effect of WCB in CO
2
flux. Within the same day, treatments with the same letter or those with no letters are not significantly different at
α
= 5%.
Experiment 2 - topical application of biochar and activated carbon on moist manure
Similar to experiment 1, there were significant (treatment) × (time) interactions. As such, treatment effects were analyzed based on sampling days. Topical application of 3 mm and 5 mm of loose manure biochar (Figure
3
b) and pellet manure biochar (Figure
3
c) showed similar effects as pellet-activated carbon (Figure
3
a) in reducing N
2
O emissions after day 10. For all sampling days, N
2
O emission flux from the control was larger than those from the 3-mm and 5-mm treatments of both manure biochars, as also occurred with the three treatments of pellet-activated carbon (Figure
3
a). However, in the case of manure biochars, those differences were significant only on day 15, while activated carbon significantly reduced N
2
O emissions starting at day 10. Powder-activated carbon, as expected, showed the same behavior in GHG reduction as pellet-activated carbon. The 3-mm treatment of loose manure biochar and pellet manure biochar, compared to the control, reduced N
2
O emissions by 63% and 57%, respectively, on day 15. The reduction was slightly lower than that from the 3-mm treatment of activated carbon, which had a reduction of 73%. Reductions of N
2
O emissions by activated carbon and manure biochar increased with sampling day (Figure
3
a, b, c). Moreover, with the exception of activated carbon, the 1-mm treatment did not result in any significant reduction in N
2
O emission flux possible because of poor surface covering.
Figure 3
Effects of topical application of biochar and activated carbon on GHG emissions from moist manure.(a)
effect of EAC in N
2
O flux,
(b)
effect of LMB in N
2
O flux,
(c)
effect of PMB in N
2
O flux,
(d)
effect of WCB in N
2
O flux,
(e)
effect of SSB in N
2
O flux,
(f)
effect of PGB in N
2
O flux,
(g)
effect of EAC in CH
4
flux,
(h)
effect of LMB in CH
4
flux,
(i)
effect of PMB in CH
4
flux,
(j)
effect of WCB in CH
4
flux,
(k)
effect of SSB in CH
4
flux,
(l)
effect of PGB in CH
4
flux,
(m)
effect of EAC in CO
2
flux,
(n)
effect of LMB in CO
2
flux,
(o)
effect of PMB in CO
2
flux,
(p)
effect of WCB in CO
2
flux,
(q)
effect of SSB in CO
2
flux,
(r)
effect of PGB in CO
2
flux. Within the same day, treatments with the same letter or those with no letters are not significantly different at
α
= 5%.
The 3-mm and 5-mm treatments of woodchip biochar also resulted in significant reduction of N
2
O starting at day 10 (Figure
3
d). Moreover, 5-mm treatment of prairie grass biochar also reduced N
2
O emissions on day 15 (Figure
3
f). No treatment of sorghum straw biochar showed any significant effect on N
2
O emissions (Figure
3
e). Among biochar materials, the 3-mm treatment of loose manure biochar was best in reducing N
2
O emissions from the moist manure on day 15 (Figure
3
b).
The reduction in N
2
O emission with biochar-amended manure is not surprising since previous research on biochar have reported significant reductions in N
2
O emissions from soils [
22
,
23
]. Taghizadeh-Toosi [
24
] reported reductions in N
2
O fluxes by as much as 70% for pasture soils following the incorporation of 3 kg · m
−2
of biochar into the soil. In addition, others have shown that emissions of N
2
O decreased as soil was amended with increased amounts of biochar [
25
,
26
]. Even in rice paddy soils amended with biochar, there was a significant reduction (51%) in total N
2
O emission, but higher levels of biochar amendments did not necessarily decrease N
2
O emission rates [
27
,
28
].
Effects of application of biochar on CH
4
emissions were generally similar to those of N
2
O emissions. Application of 3 mm and 5 mm of manure biochars showed significant reductions of CH
4
emissions compared to the control on day 15 (Figure
3
h, i). All three treatments of activated carbon (Figure
3
g) and prairie grass biochar (Figure
3
l) resulted in significant reduction of CH
4
emission on day 15. The 1-mm and 3-mm treatments of sorghum straw biochar (Figure
3
k) also showed significant reduction of CH
4
emission on day 15. The 3-mm treatment of activated carbon showed significant reduction of CH
4
emission on day 15 at 72% compared to the control treatment, while pellet manure biochar, loose manure biochar, sorghum straw biochar, and prairie grass biochar had significant reductions of 73%, 63%, 39%, and 47%, respectively, on day 15. There was no significant reduction in CH
4
emission treated with woodchip biochar. This is supported by Aguilar-Chávez et al. [
22
] who also did not find any significant effect on CH
4
emissions due to application of biochar to agricultural soils.
In the case of CO
2
, the three treatments of activated carbon (Figure
3
m) resulted in significant reduction of CO
2
emissions during the whole experimental period, with the larger reduction obtained from the largest amount of activated carbon placed on the moist manure surface, i.e., 5-mm treatment (3.09 kg · m
−2
). The 5-mm treatment of woodchip biochar (Figure
3
p) also significantly reduced CO
2
emissions but only at day 15. No other material/treatment combination significantly influenced CO
2
emissions from moist manure.
Differences in CO
2
emissions from soil amended with several biochars have been reported as a result of the differences in the biochars used [
22
]. Cayuela et al. [
23
] reported that biochar, used as soil amendment, was the most stable residue with the lowest CO
2
loss with respect to the total C added. Rogovska et al. [
26
] reported that biochar sequestered large amounts of highly stable C, but either increased or decreased CO
2
emissions from the soils, depending on soil characteristics. Scheer et al. [
29
] reported no significant differences in net fluxes of GHGs between biochar-amended pastures and control plots. In that study, the biochar from cattle feedlot manure was applied at a rate of 1 kg · m
−2
to a depth of 10 cm and the GHG emission was measured 28 months later.
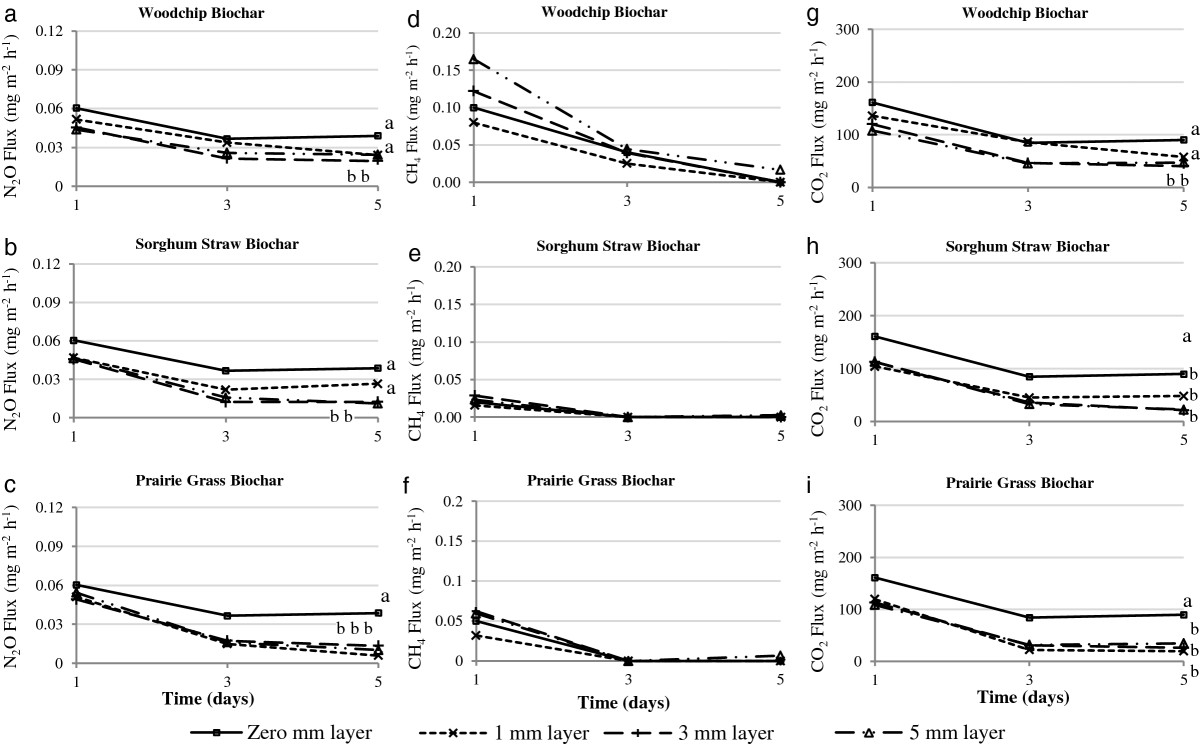
Experiment 3 - topical application of organic residues and biochar on dry manure
Figure
4
summarizes the emissions from the dry manure samples as affected by application of biochars. As expected, emissions from the dry manure samples were considerably lower than those from the moist manure samples (Figures
2
and
3
). Even though emissions were small, all amendment materials showed significant reduction in N
2
O and CO
2
emissions. The three treatments of prairie grass and sorghum straw significantly reduced N
2
O emissions. For the woodchip biochars, only the 3-mm and 5-mm treatments showed significant effect in reducing N
2
O emissions. This might be a consequence of the poor surface area coverage by the 1-mm treatment of woodchip biochar.
Figure 4
Effects of topical application of biochars on greenhouse gas emissions from dry manure.(a)
effect of WCB in N
2
O flux,
(b)
effect of SSB in N
2
O flux,
(c)
effect of PGB in N
2
O flux,
(d)
effect of WCB in CH
4
flux,
(e)
effect of SSB in CH
4
flux,
(f)
effect of PGB in CH
4
flux,
(g)
effect of WCB in CO
2
flux,
(h)
effect of SSB in CO
2
flux,
(i)
effect of PGB in CO
2
flux. Within the same day, treatments with the same letter and those with no letters are not significantly different at
α
= 5%.
In the case of CH
4
, only the three treatments of prairie grass and sorghum straw biochars significantly affected CH
4
emissions but only during the first day of the experiment. This result was possibly a consequence of the low emission flux of CH
4
from the substrate due to its low water content. Note that for experiment 3, the manure samples were not compacted so that conditions were likely aerobic, which may significantly reduce denitrification or methanogenesis, the main mechanisms of N
2
O and CH
4
formation in the soil, respectively [
30
,
31
].
In the case of CO
2
, the three treatments of all amendments, with the exception of the 1-mm treatment of woodchip biochar, significantly reduced CO
2
emission flux (Figure
4
g, h, i). Under aerobic conditions, most soil microorganism use O
2
as an electron acceptor, releasing CO
2
into the atmosphere [
31
].
Experiment 4 - GHG emission from the organic residues and biochars
Table
3
summarizes the GHG emissions from the amendment materials, tested without manure, and the control. Emissions from the organic residues and biochars were not significantly different from those for control 1 (indoor air). Also, emissions of all three GHGs from the amendment materials were significantly lower than those from control 2 (moist manure). As such, there was no significant contribution of GHGs from the organic materials and biochars when used as soil amendment.
Table 3
Mean emissions of greenhouse gases from the amendment materials themselves
Treatment
Flux (mg · m−2 · h−1)
N2O
CH4
CO2
Control-1 (indoor air)
0.01 a
0.00 a
0.7 a
Control-2 (moist manure)
6.00 b
2.01 b
5782 b
Loose manure biochar
0.01 a
0.00 a
11.7 a
Pellet-activated carbon
0.03 a
0.00 a
70.3 a
Pellet-manure biochar
0.01 a
0.00 a
2.8 a
Powder-activated carbon
0.03 a
0.00 a
46.8 a
Prairie grass
0.02 a
0.00 a
9.0 a
Prairie grass biochar
0.03 a
0.00 a
43.0 a
Sorghum straw
0.04 a
0.00 a
69.5 a
Sorghum straw biochar
0.04 a
0.00 a
82.0 a
Woodchip
0.02 a
0.00 a
13.8 a
Woodchip biochar
0.02 a
0.03 a
21.5 a
Experiment 5 - mixing of biochars with manure
Table
4
summarizes the GHG emissions from the control and from the manure biochar and activated carbon treatments. Both manure biochar and activated carbon significantly reduced emissions of N
2
O and CO
2
compared with the control. There was no significant reduction of CH
4
emission flux; nevertheless, as in experiment 2, at day10, there was significant reduction in CH
4
emission flux for both moist manure treatments compared with the control. The manure biochar showed similar effect as pellet-activated carbon in reducing N
2
O emissions (Table
4
) and their mitigating effect increased with time. These results suggest that mixing the biochar with the top loose and moist surface layers in the pens would be at least as good as or better than the topical application of the amendments in controlling GHGs from pen surfaces. In this experiment, the manure samples were not compacted, which could help explain the larger fluxes compared with those from experiments 1 and 2.
Table 4
Mean emissions of GHGs under mixed moist manure/amendment condition
Treatment
Flux (mg · m−2 · h−1)
N2O
CH4
CO2
Control (no amendment)
12.05 a
2.05 a
1,2051 a
Loose manure biochar mixed with moist manure
8.71 b
1.52 a
9,151 b
Activated carbon mixed with moist manure
8.11 b
1.58 a
6,735 c
Experiment 6 - mechanism of GHG emission reduction
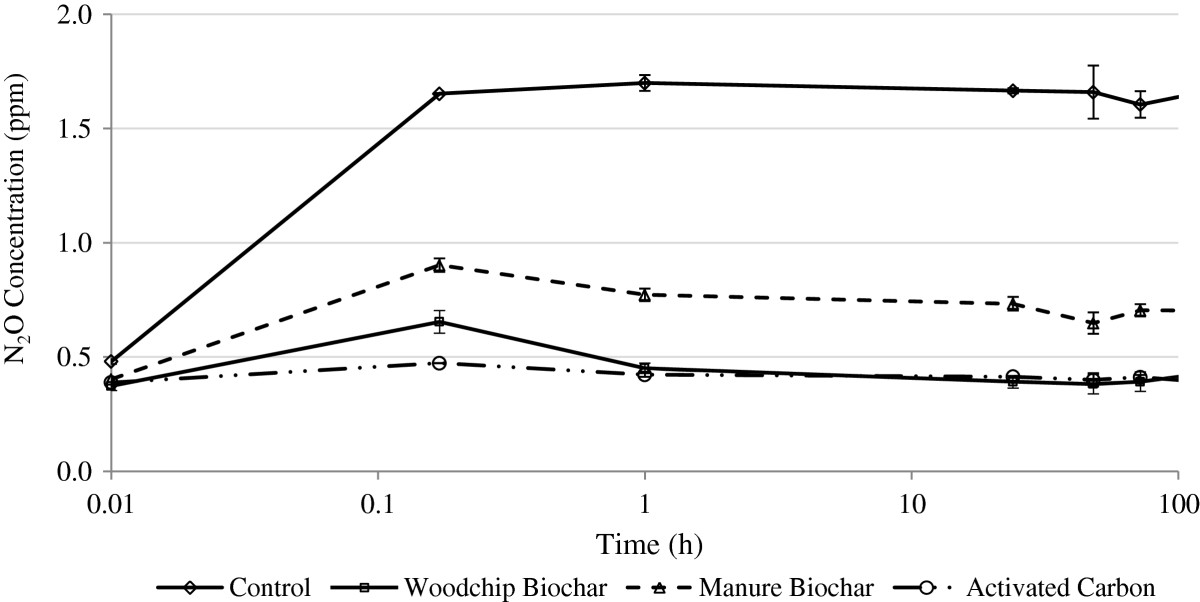
Figure
5
plots the headspace concentration of N
2
O in the different containers without (control) and with amendments. For all containers, a known amount of N
2
O (i.e., 150 cc, 3.5 ppm) was injected into the containers at 0.17 h. As soon as the N
2
O was injected, measured concentration of N
2
O for the control (indoor air without any amendment) increased from 0.48 to 1.65 ppm. For containers with treatments (i.e., woodchip biochar, manure biochar, and activated carbon), the increase in concentrations after injection of the same standard N
2
O gas was significantly lower. No further significant changes in N
2
O concentrations were observed after the first hour of the experiment (Figure
5
). The significant difference in N
2
O concentration might be a consequence of several mechanisms, including adsorption. When biochar materials are added to the soil, they are able to adsorb organic molecules through several mechanisms [
32
]. Peng et al. [
33
] reported activated carbon with high pore volume as a good N
2
O adsorbent.
Figure 5
Nitrous oxide concentrations at headspace of containers without (control) and with amendments.
A known amount of N
2
O was injected into each container at 0.17 h.
To confirm that adsorption was a possible mechanism for N
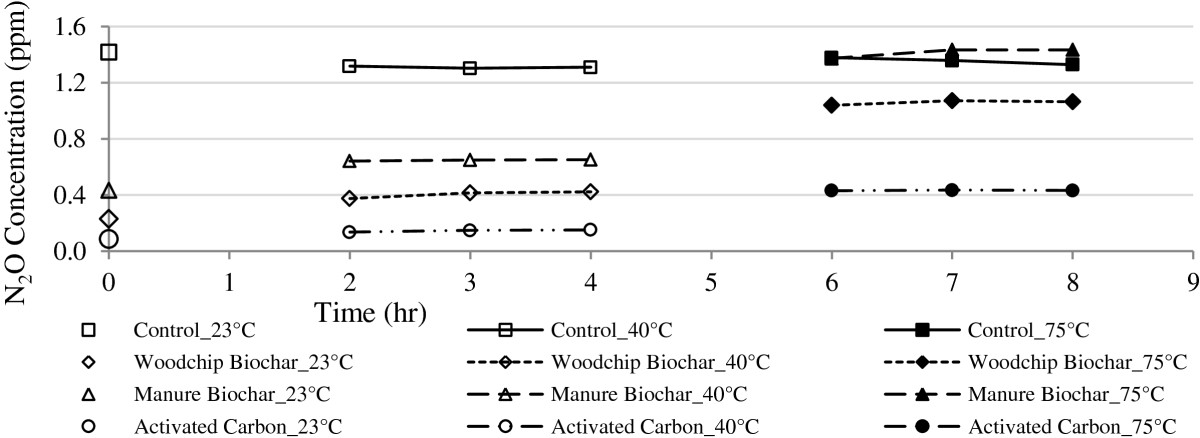
2
O concentration reduction within the containers, once the 120-h period of gas sampling at room temperature (23°C) was completed, each container still capped was heated to 35°C, 40°C, and 75°C. Then, gas samples were drawn from the container headspace and immediately analyzed for N
2
O concentration in a GC. Results indicated that at temperatures higher than room temperature (23°C), the N
2
O concentration within the containers increased but remained relatively constant for a given temperature (Figure
6
). Apparently, the adsorbed N
2
O at room temperature was released at higher temperature, but once that temperature stabilized, there was no any additional desorption.
Figure 6
Effect of temperature on N2O concentrations inside containers with various amendment materials.
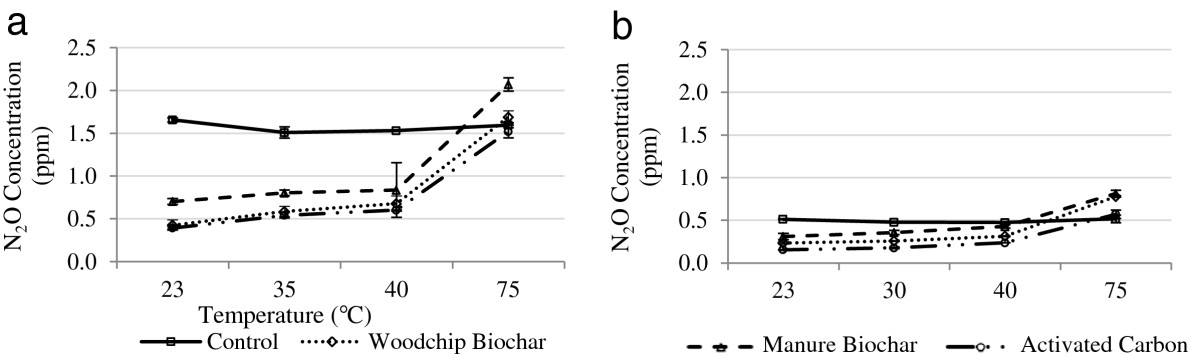
Figure
7
a shows the concentrations of N
2
O inside the heated containers with biochars. For each material and control, there was no significant change in N
2
O concentrations when samples were heated from 23°C to 40°C. At temperatures larger than 40°C, however, all materials showed significant N
2
O desorption. Moreover, N
2
O concentrations for the control did not significantly change with increasing temperatures. These results confirm that there was no chemical reaction between the biochar and the N
2
O injected into the containers, suggesting that the main mechanism responsible for the increase in N
2
O concentration within the containers when heated was desorption. Therefore, adsorption is a possible mechanism for the reduction of N
2
O emission from the manure treated with biochar and/or activated carbon in the previous experiments. Once the containers were cooled to room temperature, the final N
2
O concentrations decreased to levels comparable to those for the 23°C-to-40°C range.
Figure 7
Nitrous oxide concentrations inside containers with amendment materials. (a)
effect of temperature on desorption of N
2
O after injection of 150 cc of 3.5 ppm N
2
O standard gas and
(b)
effect of temperature on desorption of N
2
O from the amendment materials without injection of N
2
O standard gas.
The higher manure temperature in pen surfaces in a beef cattle feedlot in Kansas during 15 consecutively months was 40.5°C [
8
]. The lack of significant change in N
2
O gas concentration within the containers when temperature rose from 23°C to 40°C is useful because this suggests that the GHGs adsorbed on the amendment materials in the feedlot surfaces would not be desorbed even during the higher summer temperatures. Moreover, the fact that there was a significant difference in N
2
O gas concentration within the containers between the treatments (amendment materials) and the control (Figures
5
and
7
a) supports the hypothesis that the biochar materials can be used as surface amendments to reduce GHG emissions from pen surfaces of beef cattle feedlots, even though a significant effect in GHG reduction was observed only from days 10 and 15 after biochar application (Figure
3
).
As expected, significant N
2
O desorption was observed when substrates were heated (Figure
7
a); in the interval from 40°C to 75°C, all materials reached the N
2
O concentration of the control. This suggests that at 75°C, both biochar and activated carbon have at least released 100% of the N
2
O previously adsorbed. Figure
7
b represents the N
2
O gas desorption from the amendment materials themselves without any external addition of N
2
O gas standard into the containers. At 23°C, the N
2
O concentration in all containers with the three amendment materials was significantly lower than the one in the control at the same temperature. This finding suggests that the amendment materials adsorbed part of the N
2
O concentration present in the indoor air within the containers. When containers were heated from 23°C to 40°C, there was no significant gas desorption from the amendment materials. Once the temperature exceeded 40°C, a larger amount of N
2
O was released from the materials, reaching the N
2
O concentration of the control. Therefore, because the materials did not react at temperatures between 23°C to 40°C, no gas desorption is expected from the biochars in the field since temperatures did not commonly reach 40°C [
8
].
The adsorption capacities of selected amendment materials were estimated from the results. From Figure
5
, N
2
O concentrations within the containers remained relatively constant over time, indicating that the adsorption capacity of the amendment materials might have been reached. Based on the average gas concentration, the adsorption capacity of each material was computed with respect to the control. Estimated adsorption capacities (<0.1 μg N
2
O/g of material) were orders of magnitude lower than the reduction in N
2
O emission observed from experiment 2 (Figure
3
a, b, d). As such, adsorption did not appear to be the main N
2
O mitigation mechanism.
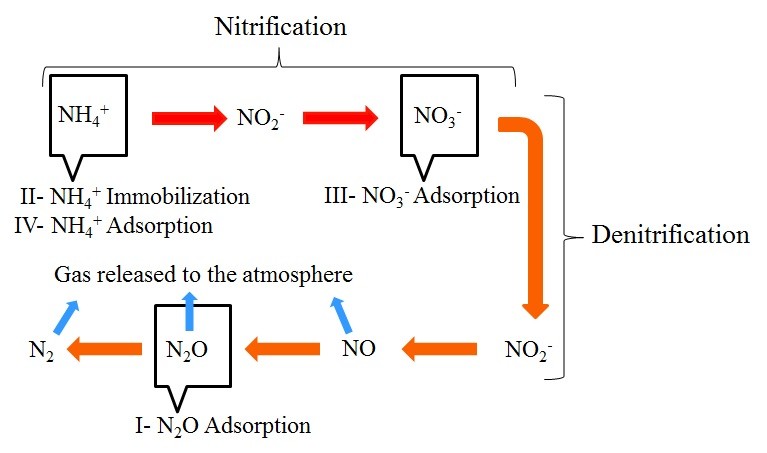
From previous studies for soils, other possible N
2
O mitigation mechanisms [
34
] include NH
4+
immobilization, NO
3−
adsorption, and NH
4+
adsorption (Figure
8
). The NH
4+
immobilization mechanism is related to the C/N ratios of biochars. Table
2
shows that with the exception of manure biochar, all other amendments have a C/N ratio greater than 20:1, which represents low N content [
35
]. When the biochars are mixed with the manure, the microorganisms’ activity is expected to increase due to the extra C. Because the amendments have low N contents [
35
,
36
], the microorganisms will likely immobilize part of the available inorganic N (NH
4+
) in the manure surface. Once the NH
4+
is used, nitrification and denitrification will decrease, with a net effect of reduced emissions of N
2
O [
36
] from the manure. This is supported by Adams et al. [
15
], who reported lower N losses in feedlot pens under increased surface manure C/N ratio as result of the application of sawdust on pen surfaces. Other researchers have reported linear relationship between the organic matter content and the amount of N preserved in the manure [
37
]. Therefore, as manure C content increases, it is expected that less N will volatilize from the manure surfaces.
Figure 8
Possible mechanisms for mitigation of N2O emission from feedlot manure by biochar or activated carbon.
The N
2
O mitigation mechanisms related to NO
3−
adsorption by the biochar (Figure
8
) is supported by previous studies on soil, drinking water, and wastewater. Kameyama et al. [
38
], in a study on the effect of biochar on NO
3−
leaching in soil, reported significant NO
3−
adsorption on the biochar. Yao et al. [
39
] reported that several biochars significantly adsorbed NO
3−
from soils, with removal rates of up to 3.7%. Nunell et al. [
40
], in a study of NO
3−
removal from wastewater using activated carbon, reported high NO
3−
adsorption on wood saw dust activated with potassium hydroxide. They reported that a combined effect of carbon surface chemistry (high basic functional groups and low acidic groups) and carbon porous characteristics were responsible for the NO
3−
adsorption. In a study of NO
3−
removal from drinking water, Mizuta et al. [
41
] reported that the bamboo charcoal was 15% more effective in adsorbing NO
3−
than commercial activated carbon.
As previously indicated, another possible N
2
O mitigation mechanism is nitrification inhibition through the adsorption of NH
4+
. Yao et al. [
39
] reported that nine biochars significantly adsorbed NH
4+
, with removal rates of up to 15.7%.
Based on results from those studies, biochar and activated carbon can adsorb N
2
O, NO
3−
, and NH
4+
. If the adsorbed NH
4+
from manure is not available for microbial activity, nitrification inhibition might result, with a reduction of NO
3−
generation. If NO
3−
is also directly adsorbed onto the biochar and not available for microbial activity, a net denitrification reduction is expected. The net result would be a reduction on N
2
O emission rates.
Conclusions
Highlights
Organic residues and biochar were evaluated in controlling GHGs from feedlot manure.
Applying organic residues on feedlot manure had limited effects on GHG emissions.
Applying biochar or activated carbon on feedlot manure reduced GHG emissions.
Adsorption did not appear to be the primary mechanism for the N
2
O emission reduction.
This research evaluated, under controlled laboratory conditions, the effectiveness of application of organic residues, biochar, and activated carbon in controlling emissions of N
2
O, CH
4
, and CO
2
from beef cattle feedlot manure. The following conclusions were drawn:
Topical application of organic residues (i.e., prairie grass, sorghum straw, and woodchip) and biochar on dry manure showed significant reduction of N
2
O and CO
2
emissions but did not affect CH
4
emission. When applied on moist manure, the organic residues did not significantly affect GHG emission.
Topical application of biochar did not show significant reduction of GHG emissions for the first 8 days. From days 10 and 15, application of biochar materials significantly reduced N
2
O and CH
4
emissions compared with the control (i.e., no amendment). Biochar from manure (loose or pelletized) appeared to be the most promising material for reducing GHG emissions from pen surfaces because their effect was similar to that of activated carbon.
The method of application of biochar (i.e., topical vs. mixed) did not significantly influence the effectiveness of the material in reducing GHG emissions.
Adsorption on biochar or activated carbon appeared to be a mechanism for reducing N
2
O emission from feedlot manure; however, other mechanisms (e.g., NH
4+
immobilization, NO
3−
adsorption, and NH
4+
adsorption) might be important in N
2
O mitigation.
Acknowledgements
This study was supported in part by the government of the Republic of Panama through SENACYT/IFARHU/Universidad Tecnológica de Panamá, Kansas Agricultural Experiment Station, and USDA-NIFA Special Research Grant ‘Air Quality: Reducing Air Emissions from Cattle Feedlots and Dairies (TX and KS),’ through the Texas AgriLife Research. Special thanks to Dr. Dale Bremer and Dr. Donghai Wang for allowing us to use their equipment and to Dr. Wenqiao Yuan and Arthur James for providing some of the amendment materials.
Competing interests
The authors declare that they have no competing interests.
Authors’ contributions
OAA designed the experimental study, collected and analyzed the data, and drafted the manuscript. RM conceived the study, participated in its design, and made critical revisions to the manuscript. SLT participated in its design, provided measurement instrumentation, and contributed to the manuscript. CWR participated in the experimental design, and provided measurement instrumentation. LEE participated in the experimental design, and made critical revisions to the manuscript. All authors read and approved the final manuscript.
References
Mosier et al. (1998) Closing the global N2O budget: nitrous oxide emissions through the agricultural nitrogen cycle (pp. 225-248) 10.1023/A:1009740530221
Stackhouse et al. (2011) Greenhouse gas and alcohol emissions from feedlot steers and calves (pp. 899-906) 10.2134/jeq2010.0354
Woodbury et al. (2001) Seasonal and spatial variations of denitrifying enzyme activity in feedlot soil (pp. 1635-1642)
Ma et al. (2008) Soil formate regulates the fungal nitrous oxide emission pathway (pp. 6690-6696) 10.1128/AEM.00797-08
Maeda et al. (2010) Source of nitrous oxide emissions during the cow manure composting process as revealed by isotopomer analysis of and amoA abundance in betaproteobacterial ammonia-oxidizing bacteria (pp. 1555-1562) 10.1128/AEM.01394-09
Aguilar (2013) Dissertation
Woodbury et al. (2006) An inexpensive laboratory and field chamber for manure volatile gas flux analysis (pp. 767-772) 10.13031/2013.20480
Malla et al. (2005) Mitigating nitrous oxide and methane emissions from soil in rice–wheat system of the Indo-Gangetic plain with nitrification and urease inhibitors (pp. 141-147) 10.1016/j.chemosphere.2004.09.003
Menendez et al. (2006) 3, 4-dimethylpyrazol phosphate effect on nitrous oxide, nitric oxide, ammonia, and carbon dioxide emissions from grasslands (pp. 973-981) 10.2134/jeq2005.0320
Parkin and Kaspar (2006) Nitrous oxide emissions from corn–soybean systems in the midwest (pp. 1496-1506) 10.2134/jeq2005.0183
Weiske et al. (2001) Effect of the new nitrification inhibitor DMPP in comparison to DCD on nitrous oxide (N2O) emissions and methane (CH4) oxidation during 3 years of repeated applications in field experiments (pp. 57-64) 10.1023/A:1012669500547
Weiske et al. (2001) Influence of the nitrification inhibitor 3, 4-dimethylpyrazole phosphate (DMPP) in comparison to dicyandiamide (DCD) on nitrous oxide emissions, carbon dioxide fluxes and methane oxidation during 3 years of repeated application in field experiments (pp. 109-117) 10.1007/s003740100386
Adams et al. (2004) Effect of organic matter addition to the pen surface and pen cleaning frequency on nitrogen mass balance in open feedlots (pp. 2153-2163)
Chiyoka et al. (2011) Nitrous oxide emissions from chernozemic soils amended with anaerobically digested beef cattle feedlot manure: a laboratory study (pp. 492-502) 10.1016/j.anifeedsci.2011.04.035
Cayuela et al. (2010) Nitrous oxide and carbon dioxide emissions during initial decomposition of animal by-products applied as fertilisers to soils (pp. 235-242) 10.1016/j.geoderma.2010.04.026
Predotova et al. (2011) Effects of cuvette surface material on ammonia-, nitrous oxide-, carbon dioxide-, and methane-concentration measurements (pp. 347-349) 10.1002/jpln.201000420
Bremer (2006) Nitrous oxide fluxes in turfgrass (pp. 1678-1685) 10.2134/jeq2005.0387
Aguilar-Chávez et al. (2012) Greenhouse gas emissions from a wastewater sludge-amended soil cultivated with wheat (triticum spp. L.) as affected by different application rates of charcoal (pp. 90-95) 10.1016/j.soilbio.2012.04.022
Cayuela et al. (2010) Bioenergy by-products as soil amendments? Implications for carbon sequestration and greenhouse gas emissions (pp. 201-213)
Taghizadeh-Toosi et al. (2011) Biochar incorporation into pasture soil suppresses in situ nitrous oxide emissions from ruminant urine patches (pp. 468-476) 10.2134/jeq2010.0419
Bruun et al. (2011) Application of biochar to soil and N2O emissions: potential effects of blending fast‒pyrolysis biochar with anaerobically digested slurry (pp. 581-589) 10.1111/j.1365-2389.2011.01377.x
Rogovska et al. (2011) Impact of biochar on manure carbon stabilization and greenhouse gas emissions (pp. 871-879) 10.2136/sssaj2010.0270
Zhang et al. (2012) Effects of biochar amendment on soil quality, crop yield and greenhouse gas emission in a Chinese rice paddy: a field study of 2 consecutive rice growing cycles (pp. 153-160) 10.1016/j.fcr.2011.11.020
Zhang et al. (2010) Effect of biochar amendment on yield and methane and nitrous oxide emissions from a rice paddy from Tai Lake Plain, China (pp. 469-475) 10.1016/j.agee.2010.09.003
Scheer et al. (2011) Effect of biochar amendment on the soil-atmosphere exchange of greenhouse gases from an intensive subtropical pasture in Northern New South Wales (pp. 47-58) 10.1007/s11104-011-0759-1
Hofstra and Bouwman (2005) Denitrification in agricultural soils: summarizing published data and estimating global annual rates (pp. 267-278) 10.1007/s10705-005-3109-y
Li (2007) Quantifying greenhouse gas emissions from soils: scientific basis and modeling approach (pp. 344-352) 10.1111/j.1747-0765.2007.00133.x
Joseph et al. (2010) An investigation into the reactions of biochar in soil (pp. 501-515) 10.1071/SR10009
Peng et al. (2009) Adsorption of nitrous oxide on activated carbons (pp. 3079-3081) 10.1021/je9001625
Erickson and Klopfenstein (2001) Managing N inputs and the effect on N losses following excretion in open-dirt feedlots in Nebraska (pp. 830-835) 10.1100/tsw.2001.363
Kameyama et al. (2012) Influence of sugarcane bagasse-derived biochar application on nitrate leaching in calcaric dark red soil (pp. 1131-1137) 10.2134/jeq2010.0453
Yao et al. (2012) Effect of biochar amendment on sorption and leaching of nitrate, ammonium, and phosphate in a sandy soil (pp. 1467-1471) 10.1016/j.chemosphere.2012.06.002
Nunell et al. (2012) Conversion of biomass from an invasive species into activated carbons for removal of nitrate from wastewater (pp. 87-95) 10.1016/j.biombioe.2012.05.001
Mizuta et al. (2004) Removal of nitrate-nitrogen from drinking water using bamboo powder charcoal (pp. 255-257) 10.1016/j.biortech.2004.02.015