Faculty of Environmental Studies, Universiti Putra Malaysia, Serdang, Selangor, 43400, MY
Abstract
Palm oil mills are generally self-sufficient in terms of energy. However, burning of biomass fuel in a boiler has generated serious air pollution problem due to inappropriate boiler operation and inefficient dust collection system. This study aims to simulate the total dust emission from palm oil mills in Malaysia by modelling biomass fuel composition and dust collector efficiency. It has been found that before removal, the simulated average dust load after biomass boiler was 51.67 ± 5.39 g/s at a confidence level of 95%, and total dust load was 389,961 tonnes/year. Simulation values of total dust emission at different percentages of dust collector efficiency at 60%, 70%, 80%, 90% and 95% were 155,984, 116,988, 77,992, 38,996 and 19,498 tonnes/year, respectively. The simulation has also shown that dust concentration at a boiler outlet was 4.5 g/Nm
3
. From the study, dust removal efficiency should be above 91% to ensure the compliance of dust concentration at 0.4 g/Nm
3
as prescribed by the Environment Quality (Clean Air) Regulations of 1978. Whereas in 2009, Sabah state has processed the most quantities of fresh fruit bunches; it has posed a potential impact on the environment and public in terms of total dust emission. Besides stack sampling that is used to monitor dust emission status, simulation can be a more simple way and an alternative to estimate the emission.
Background
Malaysia is one of the largest palm oil producers in the world. However, the process of producing palm oil has generated million tonnes of empty fruit bunches, fibre and palm shell every year as wastes. Fibre and shell are mixed at certain ratios and used as fuel to generate energy to run the palm oil mill. Utilization of this palm waste as boiler fuel is creating a serious emission problem in the industry. The emissions are not only posing threat on human health, but also affecting agricultural crops, forest species and ecosystem [
1
–
4
]. Under the enabling legislation provided by the 1974 Environmental Quality Act, the Malaysian Government has issued the Environment Quality (Clean Air) Regulations, which came into force on 1 October 1978 and which limited air emissions from stationary fuel burning sources. For the palm oil industry, the principal concern of the regulation is toward the control of dark smoke and dust emission from the burning waste, which are mixtures of fibre and shell. Under Regulations 21 and 25, the maximum permitted level of dust concentrations in gas emitted will be 0.5 g/Nm
3
before 1 October 1978 and a limit of 0.4 g/Nm
3
for plant erected after the date, expressed in terms of 12% CO
2
.
A study conducted by Rozainee et al. [
5
] shows that the mean particulate concentration emitted from water-tube boilers equipped with and without particulate control equipment was 1.11 ± 0.58 g/Nm
3
and 1.93 ± 1.40 g/Nm
3
, respectively, with only one of the boilers studied met the Department of Environment limits of 0.40 g/Nm
3
whilst others were still violating the standards. From another study by Rashid and Rozainee [
6
], it was found that the boilers, using palm waste as fuel at palm oil mills, are producing very much higher levels of dust emission of up to 11.6 g/Nm
3
. According to De Kock and Yap [
7
], many dust collectors are installed without proper design and quality control procedures and many were simply copied from original suppliers. Dust collectors are often installed without verifying the performance during commissioning with only stack emission measurements carried out. By gross estimation, dust generated from typical 25 tonnes/h boiler combustion is around 4.5 g/Nm
3
. Nowadays, most of the palm oil mill boiler operations are equipped with multi-cyclones to filter out the dust generated. For 60% of dust collection efficiency on average, it can be forecasted that the emission would be around 1.8 g/Nm
3
after the multi-cyclone, which create an estimated dust load of 450 tonnes/year.
In 2009, there were around 417 oil palm processing plants in the country [
8
] As compared with the number of mills in 1999, there are additionally more than 80 new mills that were put into operation as of today (over a span of 10 years). It is not difficult to foresee the air pollution from palm oil mill boilers that are yet to comply with the standard of 0.4 g/Nm
3
, which is still continually creating a great burden to the local atmosphere. The palm oil industry has made a tremendous effort to increase its productivity over the past decades, but at the same time, the palm waste has also increased. Many studies focus on handling palm oil mill effluent or to maximize the utilization of biomass as renewable energy, yet there is lack of data and information about dust emission monitoring and follow-up as well as methods and technologies to lower emissions from biomass boiler.
Simulation of total dust emission can be used to estimate the trend of dust emission in the future and help in setting its reduction target for palm oil mills in Malaysia. It can also be used to facilitate decision-making processes that are related to air pollution control as part of emission inventory estimations. Therefore, the objective of this study is to estimate the total dust emission from palm oil mills in Malaysia from the perspectives of fuel compositions and efficiency of dust collection system to elucidate the air pollution problem that might have been neglected in the past. Simulation was carried out using several models: dust load and dust concentration model as well as dust collector efficiency. Dust load and dust concentration models are based on the composition of fibre and shell (Tables
1
and
2
and Figure
1
), and the dust loading rate is calculated based on monthly average operation hours of a palm oil mill (Table
3
). The selected efficiency range of dust collector was used to show the total dust emission rate, based on simulated dust load and dust concentration.
Table 1
Chemical composition on dry basis of fibre and shell
Element
Fibre
Shell
Fuel mixture of fibre and shell (simulated)
H (%)
6.0
6.3
6.09
C (%)
47.2
52.4
48.76
S (%)
0.3
0.2
0.27
N (%)
1.4
0.6
1.16
O (%)
36.7
37.3
36.88
Ash (%)
8.4
3.2
6.84
Table 2
Calculation steps in determining dust concentration after biomass boiler
Step 1: From ultimate analysis, amount of oxygen required and air/fuel ratio were calculateda
Step 2: Calculated wet and dry composition of flue gas conditionb
Step 3: Air volume was calculated based on ideal gas law at normal condition, and dust concentration was corrected to 12% carbon dioxidec
Monthly average operating hours of palm oil mill in 2009
State
January
February
March
April
May
June
July
August
September
October
November
December
Average
Johor
394.67
356.24
370.12
366.33
420.10
440.56
488.55
431.30
422.23
551.10
443.22
414.74
424.93
Kedah
397.85
420.37
433.33
395.53
423.66
476.69
577.16
494.81
487.94
524.84
409.82
382.10
452.01
Kelantan
267.27
229.19
276.91
297.33
270.71
274.28
306.10
336.82
331.53
445.99
303.30
319.32
304.90
Melaka
468.15
455.96
441.31
476.76
484.34
502.47
495.88
458.75
487.49
597.81
409.19
434.45
476.05
N. Sembilan
451.32
452.73
456.48
467.37
459.63
474.88
516.05
475.70
481.04
546.72
419.78
373.17
464.57
Pahang
360.60
334.92
387.06
362.92
402.57
394.19
429.87
433.29
428.28
534.00
411.32
371.16
404.18
Perak
367.52
368.36
402.74
404.09
451.18
464.65
516.41
447.19
425.13
505.99
402.46
411.48
430.60
P. Pinang
429.71
477.58
476.61
483.85
519.53
528.93
625.42
578.27
505.76
590.22
519.68
516.65
521.02
Selangor
379.15
386.27
406.49
414.12
404.52
447.80
472.55
391.97
391.25
457.88
393.20
371.47
409.72
Terengganu
333.48
273.77
348.10
332.15
344.54
327.55
421.18
413.03
421.53
588.35
437.59
424.55
388.82
P. Malaysia
384.97
375.54
399.92
400.05
418.08
433.20
484.92
446.11
438.22
534.29
414.96
401.91
427.68
Sabah
407.79
326.58
357.50
343.76
353.87
357.00
347.79
366.74
410.19
520.56
465.88
467.63
393.77
Sarawak
358.14
306.75
326.55
314.27
347.12
325.94
333.28
374.15
408.73
486.30
407.19
386.86
364.61
Sabah/Sarawak
382.97
316.67
342.03
329.02
350.50
341.47
340.54
370.45
409.46
503.43
436.54
427.25
379.19
Malaysia
384.64
365.73
390.27
388.21
406.81
417.91
460.85
433.50
433.43
529.15
418.55
406.13
419.60
Methods
Source of emission
Baseline information collected from Malaysian Oil Palm Statistics 2009 [
9
] such as number of mills, fruit yield, oil palm planted area and mill operation hours (Table
3
) in every district of Malaysia in 2009 was used as input data for the simulation. Biomass boilers are often used to supply steam for palm fruit sterilization processes and turbines to generate power for plant operation. Due to the availability of adequate quantities of fibre and shell materials, which are used as solid fuel in the steam boiler, palm oil mills are generally self-sufficient in terms of energy. However, burning of biomass waste to generate energy has caused serious air pollution problem.
Generally, as suggested by USEPA, air pollutant emission can be estimated by using the following equation [
10
]:
E=A×EF×1-ER/100,
where,
E
= emissions,
A
= activity rate, EF = emission factor and ER = overall emission reduction efficiency as percentages.
Dust load model
Dust load can be defined as the concentration of solids in the inlet gas stream [
11
]. This study used the unit of mass flow, in gramme per second (g/s) for the dust load to show the loading rate to dust collector. The emission factor and the activity rate, which in this study refer to the fuel feeding rate to the boiler, were calculated in order to estimate the dust load.
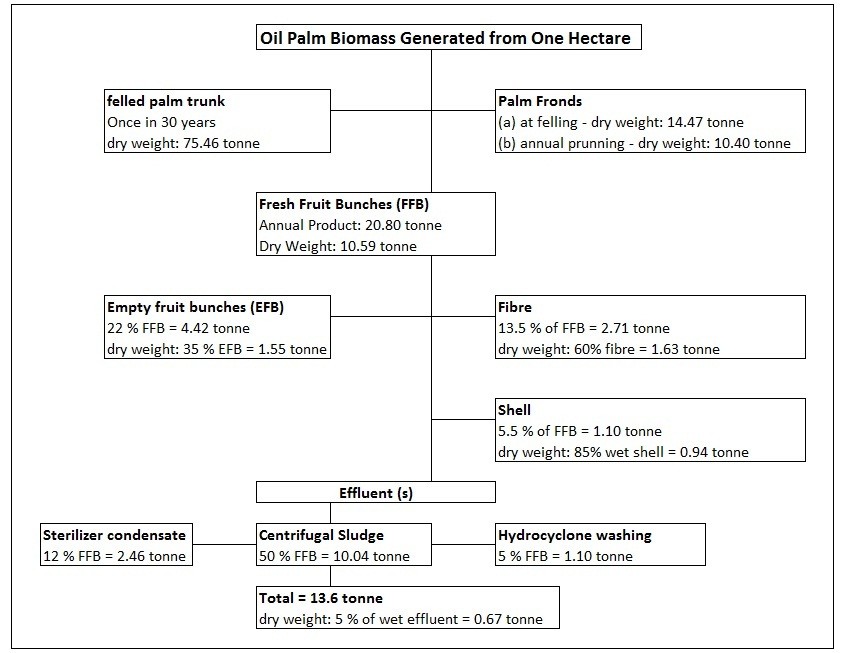
The emission factor was determined by the amount of ash in gas flow and the ash content of palm oil biomass (fuel mixture of fibre and shell) in kilogramme of dust emitted per kilogramme of biomass burned. From Figure
1
, it is found that the percentage of fibre and shell in fresh fruit bunches (FFB) are 13.5% and 5.5%, respectively [
12
] Therefore, the ratio of fibre and shell mixture in 1 kg of bulk fuel can be calculated by the following equations:
Fibremass=PercentageoffibreinFFBPercentageoffibreinFFB+PercentageofshellinFFB,Shell=1–PercentageoffibreinFFBPercentageoffibreinFFB+PercentageofshellinFFB.
The following are the sample calculations:
Fibre=0.1350.135+0.055=0.7kg,Shell=1–0.7=0.3kg.
Note that the ratio of fibre and shell (0.7 and 0.3 kg, respectively) may differ since shell is a valuable by-product that may be used in lower percentages as fuel.
From the chemical compositions on the dry basis of palm oil waste as shown in Table
1
, the ash content for fibre and shell are 8.4% and 3.2%, respectively [
3
]. Hence, the ash content for the fuel mixture is estimated as follows:
Ashpercentage=Fibreashpercentage×Fibremass+Shellashpercentage×Shellmass.
Here is its sample calculation:
Ashpercentage=8.4×0.7+3.2×0.3=6.84%.
As most of the boiler firing systems like the suspension firing system and the fluidized bed combustion methods have very high dust entrainment (as high as 80%), older boiler design which uses spreader stoker has about 20% to 30% of the fuel being burned in suspension and thus has much less dust entrainment in the gas stream [
13
]. However, the data and statistics for the above boiler information are not available; it is assumed that the ash percentage in gas stream is 50%. Therefore, the emission factor can be calculated as follows:
Emissionfactor=6.84%ashcontent×50%ingasstream=0.0342kgdust/kgbiomass.
Dust generation rate from biomass fuel combustion in boiler can be estimated by taking into account the mill capacity as total fresh fruit bunches processed over a certain milling operation hours. By multiplying the mill capacity with the percentage of biomass generated from processed FFB, the biomass fuel feeding rate to the boiler can be estimated as follows:
Fuelfeedrate=TotalFFBMilloperationhours×[Fibrepercentage×Dryweightpercentage+Shellpercentage×Dryweightpercentage].
This implies that the dust load equation can be deduced as follows:
Dustload=Emissionfactor×Fuelfeedrate.
Statistical analysis
The average of total dust load is calculated to typify the overall situation of dust load per mill before the dust collector. In the future, any upgrade of mills or additional new mills in the country might contribute to the changes of the average dust load, which can be used to indicate the level of pollution source. Descriptive statistics was used to summarize the simulated average dust load. Furthermore, the normality of the data was tested using Anderson-Darling and Lilliefors test [
14
–
16
].
Dust concentration model
Dust concentration before the dust collector was simulated using ultimate analysis and air/fuel ratio calculation (Table
1
). An example of the calculation for this model is shown in Table
2
. A ratio of 70% fibre and 30% shell is applied for the mass percentage estimation in the ultimate analysis.
The combustion process involves the oxidation of constituents in the fuel that are capable of being oxidized [
17
] and can therefore be represented by chemical equations as follows:
S+O2→SO22H2+O2→2H2OC+O2→CO2O2needed=∑O2requiredforcombustion–O2fromairAir/fuelratio(AFtheo)=O2needed1+3.76×28.97100
where 3.76 is the amount of N
2
/O
2
in air (as a ratio), 28.97 is the mol mass of atmospheric air and calculation is based on 100 kg of fuel.
At normal conditions, air volume is calculated at 0°C, 101.3 kPa based on the ideal gas law:
V=nRTP,
where
V
= volume of gas (Nm
3
),
n
= moles,
R
= universal gas constant, 8.314 J K
-1
mol
-1
and
T
= temperature (K).
Dust concentration before the dust collector is therefore calculated by mass of fly ash divided by air volume and corrected to 12% CO
2
.
Dust collector efficiency
Even though the Malaysian Standard of Performance Evaluation for Mechanical Dust Collector has been introduced since 2003, implementation of the application is not as encouraged as expected. Moreover, as reported by De Kock and Yap [
7
], the performance of dust collectors installed at palm oil mills are generally low in efficiency due to improper design and lack of quality control as well as poor maintenance. The efficiency of a typical multi-cyclone after a biomass boiler can be as low as 40% only. This study simulates the dust emissions for dust collection system efficiencies of 60%, 70%, 80%, 90% and 95%.
Results and discussion
Results
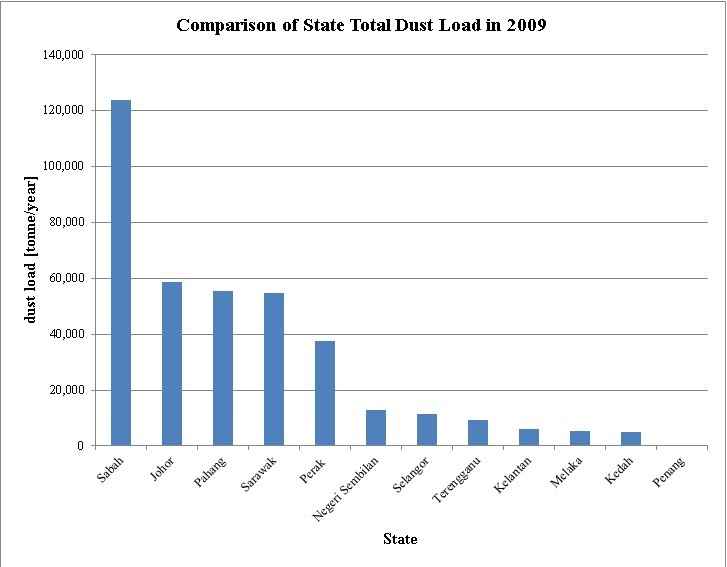
Figure
2
shows the comparison of state total dust load. It can be seen that Sabah, Johor, Pahang, Sarawak and Perak are the states with significantly higher total dust load as compared with other states. Table
4
shows the results from districts of Malaysia based on simulated total mill capacity, total fuel feeding rate, total dust loading to dust collector and average dust load. The results were sorted from largest to smallest value of total dust load. The descriptive statistics, normality test and confidence interval of average dust load are reported in Table
5
. The selected simulated data were found to be normally distributed (
p
> 0.05) based on Anderson-Darling and Lilliefors test, with the average dust load of 51.67 ± 5.39 g/s at a confidence level of 95%.
Figure 2
Comparison of state total dust load in 2009.
Table 4
Simulated total mill capacity, total fuel feed rate, total dust load and average dust load
Data from[8]
Simulation results
State
District
Mill quantity
FFB yield
Planted area
Total capacity
Total mill capacity
Total fuel feed rate
Total dust load
Average dust load
(tonnes/ha)
(ha)
(tonnes/year)
(tonnes/h)
(tonnes/h)
(g/s)
(g/s)
Sabah
Kinabatangan
30
21.73
348,450
7,571,819
1,602.40
204.71
1,944.72
64.82
Sabah
Lahad Datu
24
20.39
275,622
5,619,933
1,189.33
151.94
1,443.40
60.14
Sarawak
Miri
15
16.71
257,832
4,308,373
984.71
125.80
1,195.07
79.67
Sabah
Tawau
14
22.62
203,809
4,610,160
975.64
124.64
1,184.06
84.58
Sabah
Labuk Sugut
19
20.7
198,493
4,108,805
869.54
111.08
1,055.29
55.54
Sabah
Sandakan
14
21.32
168,660
3,595,831
760.98
97.21
923.54
65.97
Johor
Kluang
19
19.91
188,604
3,755,106
736.42
94.08
893.73
47.04
Pahang
Rompin
23
18.92
176,792
3,344,905
689.65
88.10
836.97
36.39
Sarawak
Bintulu
9
17.23
158,869
2,737,313
625.63
79.92
759.28
84.36
Perak
Hilir Perak
15
25.91
106,793
2,767,007
535.49
68.41
649.89
43.33
Johor
Kota Tinggi
15
17.17
145,050
2,490,509
488.42
62.40
592.75
39.52
Pahang
Bera
9
21.93
94,442
2,071,113
427.02
54.55
518.24
57.58
Johor
Segamat
9
19.70
102,048
2,010,346
394.25
50.37
478.47
53.16
Sarawak
Mukah
5
13.1
130,990
1,715,969
392.20
50.10
475.98
95.20
Pahang
Kuantan
9
18.54
89,916
1,667,043
343.71
43.91
417.13
46.35
Pahang
Pekan
6
20.47
78,377
1,604,377
330.79
42.26
401.45
66.91
Johor
Muar
5
22.17
68,802
1,525,340
299.14
38.21
363.04
72.61
Perak
Sri Manjong
3
27.18
54,088
1,470,112
284.51
36.35
345.29
115.10
Kelantan
Gua Musang
7
12.32
83,081
1,023,558
279.76
35.74
339.52
48.50
Johor
Batu Pahat
6
19.32
66,007
1,275,255
250.09
31.95
303.52
50.59
Terengganu
Kemaman
6
15.96
69,600
1,110,816
238.08
30.41
288.93
48.16
Johor
Johor Baru
5
18.42
65,256
1,202,016
235.73
30.11
286.09
57.22
Perak
Batang Padang
6
20.56
58,179
1,196,160
231.49
29.57
280.94
46.82
Pahang
Maran
7
17.88
60,888
1,088,677
224.46
28.67
272.41
38.92
Sabah
Kunak
7
21.98
47,930
1,053,501
222.95
28.48
270.58
38.65
Sarawak
Samarahan
4
13.31
64,679
860,877
196.76
25.14
238.79
59.70
Sarawak
Sibu
5
13.21
63,706
841,556
192.34
24.57
233.43
46.69
Perak
Perak Tengah
5
20.79
47,172
980,706
189.79
24.25
230.34
46.07
Pahang
Kuala Lipis
3
17.85
48,927
873,347
180.06
23.00
218.53
72.84
N. Sembilan
Jempol
5
18.21
53,498
974,199
174.75
22.32
212.08
42.42
Selangor
Kuala Selangor
5
25.05
33,614
842,031
171.26
21.88
207.85
41.57
Selangor
Kuala Langat
6
22.33
37,582
839,206
170.69
21.81
207.15
34.52
Pahang
Jerantut
4
19.49
38,626
752,821
155.22
19.83
188.37
47.09
Johor
Mersing
5
16.41
47,475
779,065
152.78
19.52
185.42
37.08
Sarawak
Kuching
3
15.43
41,417
639,064
146.06
18.66
177.27
59.09
Sabah
Semporna
4
23.24
28,734
667,778
141.32
18.05
171.51
42.88
Sarawak
Kapit
3
13.09
45,377
593,985
135.76
17.34
164.76
54.92
Sabah
Keningau
3
18.75
31,756
595,425
126.01
16.10
152.93
50.98
N. Sembilan
Port Dickson
2
23.8
29,399
699,696
125.51
16.03
152.32
76.16
N. Sembilan
Tampin
3
19.85
34,500
684,825
122.84
15.69
149.08
49.69
Melaka
Jasin
2
25.14
26,749
672,470
117.72
15.04
142.87
71.43
Perak
Kuala Kangsar
2
22.89
25,289
578,865
112.03
14.31
135.96
67.98
Perak
Krian
4
21.53
26,197
564,021
109.15
13.94
132.47
33.12
Kedah
Kulim
3
21.95
25,762
565,476
104.25
13.32
126.52
42.17
Terengganu
Dungun
2
12.75
36,894
470,399
100.82
12.88
122.36
61.18
Sarawak
Betong
1
14.01
29,086
407,495
93.14
11.90
113.03
113.03
Pahang
Temerloh
3
10.75
40,924
439,933
90.70
11.59
110.08
36.69
Pahang
Raub
3
17.78
24,323
432,463
89.16
11.39
108.21
36.07
Melaka
Alor Gajah
1
22.4
22,697
508,413
89.00
11.37
108.01
108.01
Pahang
Bentong
3
19.1
22,452
428,833
88.42
11.30
107.30
35.77
Selangor
Ulu Selangor
4
18.81
22,610
425,294
86.50
11.05
104.98
26.24
Johor
Pontian
1
14.44
29,206
421,735
82.71
10.57
100.37
100.37
Perak
Larut Matang
8
20.69
20,505
424,248
82.10
10.49
99.64
12.46
Perak
Kinta
1
22.59
16,075
363,134
70.28
8.98
85.29
85.29
Sabah
Beaufort
2
12.82
24,614
315,551
66.78
8.53
81.05
40.52
Selangor
Sepang
4
17.26
18,691
322,607
65.61
8.38
79.63
19.91
Sarawak
Sri Aman
1
9.58
29,606
283,625
64.82
8.28
78.67
78.67
N. Sembilan
Seremban
3
19.68
17,635
347,057
62.25
7.95
75.55
25.18
Terengganu
Ulu Terengganu
3
12.97
20,916
271,281
58.14
7.43
70.56
23.52
Kedah
Baling
1
22.29
13,112
292,266
53.88
6.88
65.39
65.39
Terengganu
Setiu
1
13.19
18,382
242,459
51.96
6.64
63.07
63.07
Kelantan
Kuala Krai
2
15.27
11,933
182,217
49.80
6.36
60.44
30.22
Kedah
Bandar Bahru
2
23.22
10,880
252,634
46.58
5.95
56.53
28.26
N. Sembilan
Jelebu
1
18.09
14,216
257,167
46.13
5.89
55.98
55.98
Perak
Selama
1
18.27
12,215
223,168
43.19
5.52
52.42
52.42
Sarawak
Limbang
1
14.68
12,452
182,795
41.78
5.34
50.70
50.70
Kelantan
Tanah Merah
1
13.82
10,377
143,410
39.20
5.01
47.57
47.57
Sabah
Tenom
1
20.35
5,695
115,893
24.53
3.13
29.77
29.77
Selangor
Klang
2
18.03
6,261
112,886
22.96
2.93
27.86
13.93
Selangor
Petaling
1
22.28
4,737
105,540
21.47
2.74
26.05
26.05
Sabah
Kota Marudu
2
11.71
8,293
97,111
20.55
2.63
24.94
12.47
Penang
S. Prai Selatan
2
15.35
6,863
105,347
16.85
2.15
20.45
10.22
Terengganu
K. Terengganu
1
9.24
3,901
36,045
7.73
0.99
9.38
9.38
Other districts without palm oil mills
120,497
2,114,759
Malaysia
Total mills
417
4,685,085
89,255,221
17,726.34
2,264.54
21,513.1
51.67
Table 5
Descriptive statistics, normality test and confidence interval of average dust load
Selected data
Average dust load (g/s)
Size
73
Mean
51.6696
Standard deviation
23.5164
Range
9.38 to 115.10
Skewness
0.6285
Kurtosis
0.4650
Normality test
Anderson-Darling
score = 0.6528
(p value)
(0.05 = < p < 0.10)
Lilliefors D = max [D-, D+]
0.0871 = max [0.0440, 0.0871]
(p value)
(0.15 = < p < 0.20)
Confidence interval (95%)
51.67 ± 5.39 g/s
Table
6
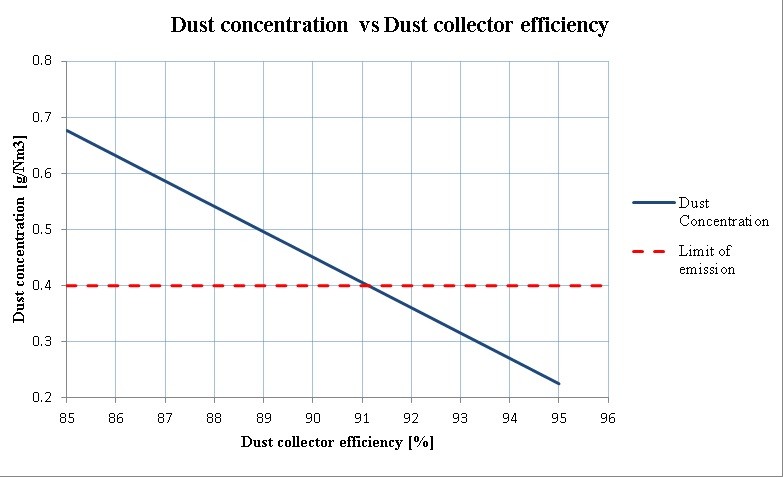
shows the results for comparison of simulated state dust emission at 60%, 70%, 80%, 90% and 95% of dust removal efficiency. It is no doubt that the highest dust collector efficiency has the lowest outlet emission. The significant difference in values shows that whereas the lowest efficiency emitted 155,984 tonnes/year, the highest efficiency emitted only 19,498 tonnes/year. The relationship between simulated dust concentration and dust removal efficiency is shown in Figure
3.
To achieve dust concentration with emission limit of 0.4 g/Nm
3
, the removal efficiency should be above 91%.
Table 6
Comparison of simulated state total dust emission at different dust removal efficiency
State
Before removal
District dust emission (tonnes/year)
(tonnes/year)
60%
70%
80%
90%
95%
Sabah
123,870
49,548
37,161
24,774
12,387
6,194
Johor
58,805
23,522
17,641
11,761
5,880
2,940
Pahang
55,502
22,201
16,651
11,100
5,550
2,775
Sarawak
54,924
21,969
16,477
10,985
5,492
2,746
Perak
37,431
14,973
11,229
7,486
3,743
1,872
Negeri Sembilan
12,945
5,178
3,884
2,589
1,295
647
Selangor
11,567
4,627
3,470
2,313
1,157
578
Terengganu
9,310
3,724
2,793
1,862
931
466
Kelantan
5,895
2,358
1,768
1,179
589
295
Melaka
5,159
2,064
1,548
1,032
516
258
Kedah
4,851
1,941
1,455
970
485
243
Penang
460
184
138
92
46
23
Malaysia
389,961
155,984
116,988
77,992
38,996
19,498
Figure 3
Correlations between simulated dust concentrations and dust removal efficiency.
Discussions
Dust load
From Figure
2
, it was shown that while Johor, Pahang, Perak, Sabah and Sarawak are among the states that have the most quantities of mills, Sabah has the highest dust load among all states, which has a potential impact on the environment if not handled well. Due to the high processing rate of FFB, it is expected that more biomass fuel will be burned in boilers, thus resulting in higher dust load if compared with other states. The average dust load of 51.67 g/s from Tables
4
and
5
quantified the pollution source of a palm oil mill in 2009. Since there is no record of dust collector efficiency from palm oil mills in Malaysia, the average dust load can be used to estimate the overall emission from a range of dust collector efficiency. However, there is no limit stipulated by the Malaysia Environmental Quality Act 1974 for dust load, as a bigger mill definitely has higher dust load. Therefore, dust concentration is universally used as standard limit, although information of dust load is useful to track dust volume that has been released to the environment within a certain period of time, regardless of the size of a mill. Considering a case of two palm oil mills, 100 tonnes/h and the other is 50 tonnes/h, both emitting 0.4 g/Nm
3
, they fall within the limit of the standard. However, dust load for the 100 tonnes/h mill (approximately 120 g/s) is double the dust load of 50 tonnes/h (approximately 60 g/s). This simply explains the pollution situation in a more direct way when compared to dust concentration.
From Table
6
, at a different grade of dust removal efficiency, the total dust emission as simulated reduced drastically from 155,984 to 19,498 tonnes/year. This further illustrates the importance of pollution control where pollution sources have increased because of new development without proper control; the consequence can be very serious. High emission trends from palm oil mills were believed that these have not been rectified for the past decades, thus the low dust removal efficiency.
Dust concentration
The simulated dust concentration at the boiler outlet was 4.5 g/Nm
3
at 12% CO
2
. This is in agreement with the results reported in the literature. For wood-fired boilers, Buonicore and Davis [
18
] reported a value of 3,000 mg/Nm
3
, whilst De Kock and Yap [
19
] reported that the boiler flue gas dust loads varied from 1490 to 4300 mg/Nm
3
. These results were not corrected for carbon dioxide; hence, the dust load could have been higher after 12% CO
2
correction. Furthermore, it can be seen from Figure
3
that even a small difference in dust collection efficiency can make a significant difference in dust concentration. For example, at 95% efficiency, the dust concentration is 0.225 g/Nm
3
, whereas at 90% efficiency, which is lower, the dust concentration is 0.450 g/Nm
3
. The latter result will not comply with the Clean Air Regulation of 1978 at 0.4 g/Nm
3
.
Efficiency of dust collection system
There are a few considerations that might cause lower efficiency in the dust collection system on boilers. One of the reasons is the deterioration of a dust collection system. Even properly designed systems from reputable suppliers may show a decrease in performance characteristics due to wear and poor maintenance. In principle, the dust collector is like any other equipment, requiring regular maintenance, servicing, evaluation and testing to ensure its operation is efficient and optimal. Poor awareness among the millers who only focus on maximizing mill productivity and who try to minimize the cost of production, instead of investing in high-efficiency pollution control system and good maintenance practice to protect the environment, is a major concern. The reason might be that there is no return or profit from the investment; it is merely a requirement of the Clean Air Regulation of 1978. Because of this, many mills simply use low-cost dust collectors just to fulfil the basic requirement of having a solid fuel boiler. Furthermore, improper design of dust collection systems, including poor quality control of material, can shorten the lifespan or increase the deterioration rate of a dust collection system, or it might even escalate the problem. For example, putting a wet scrubber instead of dry mechanical cyclone after a biomass boiler might create further problem since wastewater needs an extra wastewater treatment system to prevent water pollution problems.
Dust particle size
Dust particle size is one of the critical factors that must be carefully considered when designing a mechanical dust collector. A properly designed filter will be able to take out finer particles from the gas stream and will result in a lower dust concentration at the stack. A poorly designed dust collector will not be able to capture fine particles, thus affecting its overall efficiency.
Boiler operation
Under normal operating conditions in a palm oil mill, the boiler plant is subjected to fluctuating loads which are accompanied by variables. These fluctuating loads are inherent in the process plant operation and are the main cause for lowered boiler efficiency, which directly influence the air pollution problem, production capacity in terms of throughput of fresh fruit bunches, products recovery efficiency and the quality of products produced [
20
]. This means that if the boiler efficiency is low, it might need a higher load of fuel to heat up the boiler itself in order to get the required steam demand. When fuel feeding rates increase, more ash will be generated from fuel combustion, resulting in higher dust loads to the dust collection system, hence higher dust emission to the atmosphere. Therefore, it is critical for millers to make sure the boiler operation is always at optimal conditions.
Fuel conditioning
In older boilers, inefficient combustion is due to the condition of fuel which is mostly wet and lumpy, inconsistent fuel feeding and poor fuel distribution on the furnace grate of boiler. Pre-conditioning of fuel can help in better combustion in the boiler and increase the boiler efficiency, at the same time, eliminating dark smoke. Due to the increased combustion efficiency, the carbon dioxide content will be increased, resulting in lower dust emission when expressed in terms of 12% CO
2
[
21
,
22
].
Performance evaluation and reduction target
The performance evaluation of mechanical dust collector (MS 1723: 2003) involves simultaneous isokinetic measurements at the inlet and outlet of the dust collector in order to determine the actual dust collection performance characteristic of the system installed. This performance characteristic as measured can be used for verifying the design specifications. After the performance characteristic has been determined, future measurements will show if any deterioration has taken place. These measurements should be part of the maintenance programme of the mill. This will assist not only in ensuring that the emission complies with the set of standards, but also in planning maintenance work on dust collector in advance. Evaluation results should be kept as records by state branches under the Department of Environment. Establishing a databank is not only for performance evaluation and monitoring purpose, but also for the identification of inefficient systems so that action can be taken to control the pollution. Setting a short-term or long-term reduction target can help to improve dust emission. For example, with reference to Table
6
, by knowing the current status of the industry’s total emission of 155,984 tonnes/year at overall efficiency of 60% and considering the industry and its affordability in terms of profit, the most cost-effective solution available can be recommended and a target can be set at increasing the efficiency to 95% to reduce the emission to 19,498 tonnes/year.
Conclusions
This study has proven that simulation can be used as an alternative to estimate dust emission and recommends that the minimum efficiency for a dust collector required for a boiler besides actual measurement be done on the stack. However, regular measurement of the dust collector performance, which can be done by simultaneous isokinetic measurements at the inlet and outlet of the dust collector, is critical to accurately identify the problem so that subsequent action can be taken to overcome it.
Issues such as factors that affect dust collector efficiency, boiler operation, fuel conditioning, performance evaluation and reduction target have been discussed. Unless proper implementation and necessary improvement of the above actions have been taken, high dust emission will continue to pose serious problems to the industry and environment.
Acknowledgements
The authors would like to acknowledge Excel Air Engineering Sdn Bhd and Malaysia Palm Oil Board (MPOB) for providing useful information in completing this paper.
Competing interests
The authors declare that they have no competing interests.
Authors’ contributions
YCK carried out the data collection and formulation. AMHA participated in the design of the study and performed the statistical analysis. Both authors read and approved the final manuscript.
References
Abdullah (2007) Wong, LI, Saari, M, Salmiaton, A, Abdul Rashid 4(2) (pp. 271-278)
Harimi et al. (2006) Numerical optimisation of excess air with respect to fibre-to-shell ratio during incineration process 7(2)
Mahlia et al. (2001) An alternative energy source for palm oil wastes industry for Malaysia and Indonesia (pp. 2109-2118) 10.1016/S0196-8904(00)00166-7
Yaccob Khan et al. (1989) Air pollution control in palm oil mill industry in Malaysia Bangkok
Rozainee et al. (1998) A field evaluation of particulate emissions from palm oil mills (pp. 1-6)
Rashid and Rozainee (1993) Particulate emissions from a palm oil mill plant–a case study. Jurnal. Teknologi, Universiti. Teknologi (pp. 19-24)
De Kock and Yap (2000) Performance criteria of dust collectors for palm oil mill boilers (pp. 185-194)
United States Environmental Protection Agency (USEPA):
Emissions factors & AP 42, compilation of air pollutant emission factors
. . Accessed 8 December 2011
http://www.epa.gov/ttnchie1/ap42
. Accessed 8 December 2011