Biochemical Engineering Laboratory, Department of Chemical Engineering, Obafemi Awolowo University, Ile-Ife, Osun State, 220005, NG
Department of Chemical Engineering, Landmark University, Omu-Aran, Kwara State, P.M.B 1001, NG
Abstract
Statistical approach was employed to optimize biodiesel production from sesame oil in this work. Precisely, response surface methodology was applied, and the effects of four variables,
viz.
reaction temperature, catalyst amount, reaction time, and methanol/oil molar ratio, and their reciprocal interactions were determined. Central composite rotatable design was used to generate a total of 30 individual experiments, which were designed to study the effects of these variables during alkali-catalyzed methanolysis of sesame oil. A statistical model predicted the highest conversion yield of sesame biodiesel to be 99.71% at the following optimized variable conditions: reaction temperature of 63°C, catalyst amount of 1.04 wt.%, and methanol/oil molar ratio of 6.24, with a reaction time of 51.09 min. Using these variables under experimental condition in four independent replicates, an actual biodiesel yield of 98.36% was accomplished. The fuel properties of biodiesel produced were found to be within the ASTM D6751 and DIN EN 14214 biodiesel specifications.
Background
The need for alternative fuel, which can solve the problems of finite nature of fossil fuels and their environmental concerns, is imperative. About 98% of carbon emissions result from fossil fuel combustion [
1
]. The continued and increasing use of diesel derived from fossil oil intensifies air pollution and magnifies the global warming problem caused by CO
2
and other particulate matters [
2
]. Biodiesel, which is renewable in nature, non-toxic, and environmentally friendly with higher octane number than diesel, is the most promising candidate. It can be defined as the alkyl esters of long-chain fatty acids derived from renewable feedstock like vegetable oils or animal fats, obtained by transesterifying oil or fat with an alcohol [
3
].
Despite the food vs. fuel challenge facing the world, both edible and non-edible vegetable oil have been successfully used to produce biodiesel with superior qualities to diesel. These feedstocks include soybean oil [
4
], moringa oil [
5
], sunflower oil [
6
], rapeseed oil [
7
], palm oil [
8
], jatropha oil [
9
], camelina oil [
10
], neem oil [
11
,
12
], karanja oil [
13
], and sesame oil [
14
]. The ideal vegetable oil for biodiesel must be readily available, its plant should be easy to cultivate, and its composition must include a high percentage of monounsaturated fatty acids (C16:1, C18:1), a low proportion of polyunsaturated acids (C18:2, C18:3) and a controlled amount of saturated fatty acids (C16:0, C18:0) [
15
].
Transesterification of oil or fat to produce a high yield of biodiesel is typically investigated by optimizing the following reaction variables: alcohol/oil molar ratio, catalyst concentration, reaction temperature, and reaction time involved in the process. Both the effects of the variables and their reciprocal interactions have been evaluated using response surface methodology (RSM). RSM is a useful statistical tool, which has been applied in research for optimizing various processes including pretreatment of the
Jatropha curcas
fruit hull for enzymatic hydrolysis [
16
], bioremediation of contaminated soil [
17
], and transesterification reaction of vegetable oils. Transesterification of
Moringa oleifera
oil to biodiesel was optimized via RSM by Rashid et al. [
5
], whereas Tiwari et al. [
9
] optimized biodiesel production from jatropha oil with high free fatty acids using RSM. Jeong et al. [
18
] optimized the transesterification process of animal fat ester, while Yuan et al. [
7
] used RSM for optimization of waste rapeseed oil with high FFA to biodiesel. Also, Zhang et al. [
19
] applied RSM for the optimization of
Zanthoxylum bungeanum
seed oil transesterification to biodiesel using CaO as catalyst. Optimization of transesterification variables for biodiesel production from cottonseed oil using RSM has also been reported [
20
].
Sesamum indicum
, commonly called beniseed in Africa but globally known as sesame, is a fast-growing crop whose oilseed can be utilized for biodiesel production through transesterification process. It is an important oilseed crop cultivated in many parts of the world. Its seed is composed of 50% to 52% oil, 17% to 19% protein, and 16% to 18% carbohydrate [
21
]. Fatty acid compositions of the oil are mostly oleic (32.7% to 53.9%), linoleic (39.3% to 59%), palmitic (8.3% to 10.9%), and stearic (3.4% to 6.0%) acids [
22
]. However, the fatty acid composition of this oil varies considerably among the different varieties worldwide [
22
,
23
]. Sesame oil has emerged as a potential feedstock for biodiesel production. Although the transesterification of this seed oil from Turkey and Pakistan cultivars to biodiesel has been reported [
14
,
24
,
25
], the process has not yet been optimized using a statistical approach such as response surface methodology, and the maximum yield reported was 92% [
24
].
In this present study, an effort was made to optimize the process conditions for transesterification of sesame oil from a Nigeria cultivar to biodiesel. RSM with central composite rotatable design (CCRD) was applied, and the effect of four variables (reaction temperature, catalyst amount, reaction time, and methanol/oil molar ratio) at five levels and their reciprocal interactions were evaluated.
Methods
Materials
S. indicum
samples were collected from Lokoja, Nigeria. Chaffs were separated from the oilseeds by winnowing. The cleaned oilseeds were milled to powder by grinding with a plate machine. All chemicals and reagents used for this work were of analytical grades.
Extraction of sesame oil
Soxhlet apparatus and
n
-hexane as solvent were used for the oil extraction. Initially, the apparatus was charged with a known weight of the oilseed powder in a muslin cloth placed in a thimble of the apparatus. A round bottom flask containing a known volume of
n
-hexane was fixed to the end of the apparatus, and a condenser was tightly fixed at the bottom end of the extractor. The whole setup was heated up in a heating mantle at a temperature of 70°C. The excess solvent in the oil was recovered by distillation.
Experimental design of biodiesel production
In this work, the central composite experimental design was employed to optimize the transesterification of sesame oil to biodiesel. A five-level-four-factor design was applied, which generated 30 experimental runs. These included 16 factorial points, 8 axial points, and 6 central points to provide information regarding the interior of the experimental region, making it possible to evaluate the curvature effect. Selected variables for the transesterification process from the sesame oil were reaction temperature (
X1
), catalyst amount (
X2
), reaction time (
X3
), and methanol/oil molar ratio (
X4
). The coded levels of the independent variables are given in Table
1
. The experiments were randomized to minimize the effects of unexplained variability in the observed response due to extraneous factors.
Table 1
Factors and their levels for composite central design
Variable
Symbol
Coded factor levels
−2
−1
0
1
2
Reaction temperature (°C)
X1
50
55
60
65
70
Catalyst amount (wt.%)
X2
0.7
0.8
0.9
1.0
1.1
Reaction time (min)
X3
40
45
50
55
60
Methanol/oil molar ratio
X4
4
5
6
7
8
Sesame biodiesel production procedure
The base-catalyzed reaction was carried out according to the work of Schinas et al
.
[
26
]. The transesterification reaction of sesame oil was carried out in a glass reactor (1-L capacity). The reactor was charged with a known weight of the oil sample, which was preheated to the desired temperature. A known weight of NaOH pellet (catalyst) was dissolved in a specific volume of methanol and was transferred into the preheated oil on the hot plate with a magnetic stirrer. The resulting mixture was transferred into a separating funnel for glycerol and methyl ester separation. The glycerol was allowed to separate by gravity for 24 h. Two phases separated clearly, the less dense methyl ester at the top and the denser phase of glycerol at the bottom. The glycerol was tapped off the bottom of the separating funnel, leaving behind methyl ester in the separating funnel. The methyl ester was washed with distilled water to remove residual catalyst, glycerol, methanol, and soap. The methyl ester was further dried over a heated CaCl
2
powder. The final product was the sesame biodiesel, and the yield was calculated gravimetrically as described in Equation
1
:
Beniseedbiodiselyield%w/w=WeightofbiodieselproducedWeightofBeniseedoilused
Statistical data analysis
Sesame biodiesel production data were analyzed statistically using response surface methodology, in order to fit the quadratic polynomial equation generated by the Design Expert software version 8.0.3.1 (Stat-Ease Inc., Minneapolis, MN, USA). To correlate the response variable to the independent variables, multiple regressions were used to fit the coefficient of the polynomial model of the response. The quality of the fit of the model was evaluated using a test of significance and analysis of variance (ANOVA). The fitted quadratic response model is described by
Y=b0+∑i=1kbiXi+∑i=1kbiiXi2+∑i<jkbijXiXj+e,
where
Y
is the response variable (sesame biodiesel yield),
bo
is the intercept value,
bi
(i = 1, 2,…, k) is the first-order model coefficient,
bij
is the interaction effect, and
bii
represents the quadratic coefficients of
Xi
, and
e
is the random error.
Oil and fuel properties
Fuel properties, namely, moisture content, density at 15°C, kinematic viscosity at 40°C, iodine value, acid value, higher heating value, flash point, pour point, cloud point, cetane number, diesel index, API, and aniline point of both sesame oil and biodiesel, were determined following standard methods and compared with American and European standards (ASTM D 6751 and DIN EN 14214).
Analysis of fatty acid compositions of sesame biodiesel
Fatty acid profile of the sesame biodiesel was determined using gas chromatography (HP 6890 powered with HP ChemStation Rev. A 09.01 (1206) software, Agilent Technologies Inc., Santa Clara, CA, USA). The sesame biodiesel sample (50 mg) was esterified for 5 min at 95°C with 3.4 mL of the 0.5 M KOH in dry methanol. The mixture was neutralized using 0.7 M HCl, and 3 mL of 14% boron triflouride in methanol was added. The mixture was heated for 5 min at a temperature of 90°C to achieve complete methylation process. The fatty acids were thrice extracted from the mixture with redistilled
n
-hexane. The content was concentrated to 1 μL for gas chromatography analysis, and 1 μL was injected into the injection port of gas chromatography (GC).
Results and discussion
Properties of the sesame seed oil used as feedstock
The analysis of the seed oil showed that it has a moisture content of 0.09%, specific gravity of 0.88, and kinematic viscosity of 31.39 mm
2
/s. The acid value of the oil was 0.50 mg KOH/g oil, while the iodine value was 108 g I
2
/100 g oil. Whereas the saponification value and the peroxide value of the oil were 190 mg KOH/g oil and 7.80 meq O
2
/kg oil, respectively, its higher heating value and cetane number were 40.02 MJ/kg and 50.73, respectively. These results are within earlier reported values in the literature [
14
,
27
].
Optimization of sesame biodiesel production
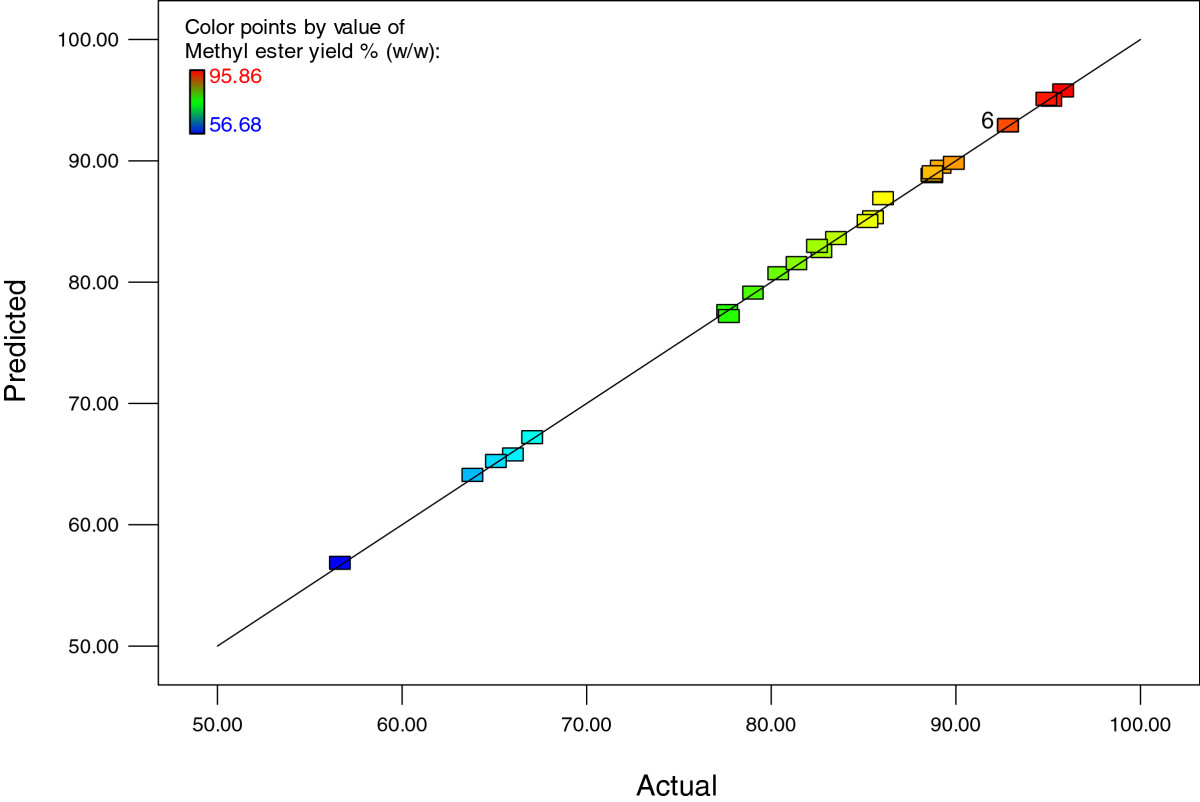
The coded factors considered in this work with experimental results, predicted values, as well as the residual values obtained, are shown in Table
2
. The parity plot showed a satisfactory correlation between the actual and predicted values of sesame biodiesel yield (Figure
1
). Table
3
showed the results of the test of significance for every regression coefficient. The results revealed that the
p
value of the model terms was significant, i.e.,
p
< 0.05. In this particular case, the four linear terms (
X1
,
X2
,
X3,X4
), six cross products (
X1X2
,
X1X3
,
X1X4
,
X2X3
,
X2X4
,
X3X4
), and the four quadratic terms (
X12
,
X22
,
X32
, and
X42
) were all remarkably significant model terms at 95% confidence level. Based on the large
F
values and low corresponding
p
values, all the linear terms had very strong effects on the biodiesel yield. However, methanol/oil molar ratio
X4
(
F
value = 9831.27) was the most significant variable followed by the catalyst amount
X2
(
F
value = 3364.87), followed by reaction time
X3
(
F
value = 1835.80), and lastly, reaction temperature
X1
(
F
value = 1192.78). In order to minimize error, all the coefficients were considered in the design. The model coefficients and probability values, i.e., coded values, are shown in Table
4
. The model also proved suitable for adequate representation of the real relationship among the selected independent variables (
X1
,
X2
,
X3,X4
). Results of the ANOVA of the regression equation are presented in Table
5
. The model
F
value of 3,234.83 with a low probability value (
p
< 0.0001) implied a high significance for the regression model [
7
]. The goodness of fit of the model was checked by the coefficient of determination (
R2
), which should be at least 0.80 for the good fit of a model [
28
]. The
R2
value of 0.9995 indicated that the sample variation of 99.95% for biodiesel was attributed to the independent variables, and only 0.05% of the total variations are not explained by the model. The value of the adjusted determination coefficient (adjusted
R2
of 0.9989) was also very high, supporting a high significance of the model [
29
,
30
], and all
p
values were less than 0.0001 except for
X3X4
with a
p
value of 0.0012, which indicated the model proved suitable for the adequate representation of the actual relationship among the selected variables. The lack-of-fit term of 0.9589 was not significant relative to the pure error. The final equation in terms of coded factors for the central composite response surface quadratic model is expressed in Equation
3
.
Yw/w%=92.87+2.43X1+4.08X2+3.01X3+6.97X4−1.38X1X2+1.14X1X3−1.81X1X4−1.42X2X3−4.27X2X4−0.34X3X4−2.72X12−4.88X22−0.98X32−2.94X42
Table 2
CCRD and experimental, predicted, and residual values for five-level four-factor response surface analysis
Standard order
X1(°C)
X2(wt.%)
X3(min)
X4
Experimental value % (w/w)
Predicted value % (w/w)
Residual values % (w/w)%
1
−1
−1
−1
−1
56.68
56.80
−0.12
2
1
−1
−1
−1
66.05
65.73
0.32
3
−1
1
−1
−1
79.06
79.08
−0.02
4
1
1
−1
−1
82.77
82.50
0.27
5
−1
−1
1
−1
63.86
64.05
−0.19
6
1
−1
1
−1
77.67
77.56
0.11
7
−1
1
1
−1
80.44
80.67
−0.23
8
1
1
1
−1
88.78
88.66
0.12
9
−1
−1
−1
1
83.55
83.57
−0.02
10
1
−1
−1
1
85.56
85.28
0.28
11
−1
1
−1
1
88.72
88.78
−0.06
12
1
1
−1
1
85.26
84.97
0.29
13
−1
−1
1
1
89.23
89.45
−0.22
14
1
−1
1
1
95.86
95.74
0.12
15
−1
1
1
1
88.78
89.00
−0.22
16
1
1
1
1
89.94
89.77
0.17
17
−2
0
0
0
77.75
77.14
0.61
18
2
0
0
0
86.10
86.86
−0.76
19
0
−2
0
0
65.13
65.19
−0.06
20
0
2
0
0
81.42
81.51
−0.09
21
0
0
−2
0
82.53
82.93
−0.40
22
0
0
2
0
95.22
94.97
0.25
23
0
0
0
−2
67.10
67.16
−0.06
24
0
0
0
2
94.95
95.04
−0.09
25
0
0
0
0
92.87
92.87
0.00
26
0
0
0
0
92.87
92.87
0.00
27
0
0
0
0
92.87
92.87
0.00
28
0
0
0
0
92.87
92.87
0.00
29
0
0
0
0
92.87
92.87
0.00
30
0
0
0
0
92.87
92.87
0.00
Figure 1
Parity plot showing the distribution of actual vs. predicted values of sesame biodiesel yield.
Table 3
Test of significance for every regression coefficient of CCRD
Source
Sum of squares
df
Mean square
F value
p value
X1
141.17
1
141.17
1,192.78
<0.0001
X2
399.11
1
399.11
3,364.87
<0.0001
X3
217.74
1
217.74
1,835.80
<0.0001
X4
1,166.08
1
1,166.08
9,831.27
<0.0001
X1X2
30.44
1
30.44
256.66
<0.0001
X1X3
20.95
1
20.95
176.66
<0.0001
X1X4
52.16
1
52.16
439.80
<0.0001
X2X3
32.06
1
32.06
270.33
<0.0001
X2X4
291.47
1
291.47
2,457.40
<0.0001
X3X4
1.87
1
1.87
15.77
0.0012
X12
202.54
1
202.54
1,707.61
<0.0001
X22
653.17
1
653.17
5,506.87
<0.0001
X32
26.34
1
26.34
222.05
<0.0001
X42
237.47
1
237.47
2,002.10
<0.0001
Table 4
ANOVA of regression equation
Source
Sum of squares
df
Mean square
F value
p value
Model
3,234.82
14
231.06
1,948.06
< 0.0001
Residual
1.78
15
0.12
Lack of fit
1.78
10
0.18
0.28
0.9589
Pure error
0.000
5
0.000
Totals corrected for the mean
3,236.60
29
Table 5
ANOVA for response surface quadratic model for intercept
Factors
Coefficient estimate
df
Standard error
95% CI low
95% CI high
VIF
Intercept
92.87
1
0.14
92.57
93.16
-
X1
2.43
1
0.070
2.28
2.58
1.00
X2
4.08
1
0.070
3.93
4.23
1.00
X3
3.01
1
0.070
2.86
3.16
1.00
X4
6.97
1
0.070
6.82
7.12
1.00
X1X2
−1.38
1
0.086
−1.56
−1.20
1.00
X1X3
1.14
1
0.086
0.96
1.33
1.00
X1X4
−1.81
1
0.086
−1.99
−1.62
1.00
X2X3
−1.42
1
0.086
−1.60
−1.23
1.00
X2X4
−4.27
1
0.086
−4.45
−4.08
1.00
X3X4
−0.34
1
0.086
−0.53
−0.16
1.00
X12
−2.72
1
0.066
−2.86
−2.58
1.05
X22
−4.88
1
0.066
−5.02
−4.74
1.05
X32
−0.98
1
0.066
−1.22
−0.84
1.05
X42
−2.94
1
0.066
−3.08
−2.80
1.05
All the linear terms and cross-product term
X1X3
had a positive effect on the sesame biodiesel yield, while the rest of the surface quadratic model terms had negative effects on the yield. The low values of standard error observed in the intercept and all the model terms demonstrated that the regression model fits the data well, and the prediction was good (Table
5
). The variance inflation factor (VIF) obtained in this study showed that the center points are orthogonal to all other factors in the model.
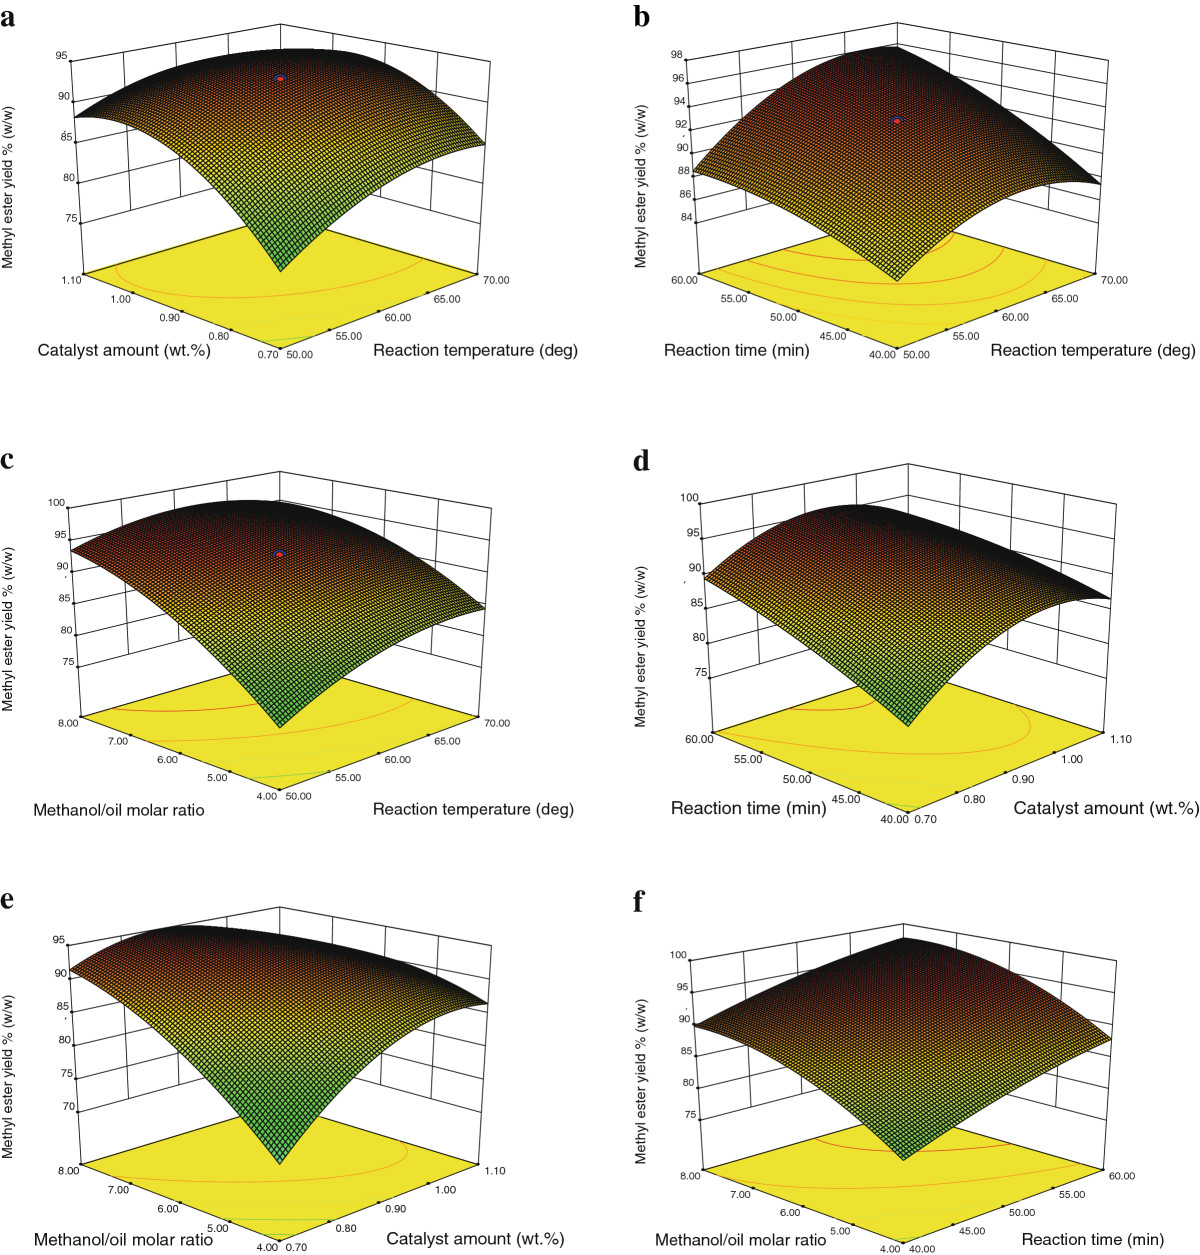
Generally, the 3D response surface plots are graphical representations of the regression equation for the optimization of the reaction variables, and they are presented in Figure
2
. The curvatures’ nature of the three-dimensional surfaces in Figure
2
a,c,f suggested mutual interaction of catalyst amount with reaction temperature, methanol/oil molar ratio with reaction temperature, and methanol/oil molar ratio with reaction time, respectively. On the other hand, the curvatures’ nature of the three-dimensional surfaces in Figure
2
b,d,e indicated moderate interactions of reaction time with reaction temperature, reaction time with catalyst amount, and methanol/oil molar ratio with catalyst amount, respectively.
Figure 2
Surface plots for conversion of sesame seed oil to biodiesel.
(
a
) catalyst amount and reaction temperature, (
b
) reaction time and reaction temperature, (
c
) methanol/oil molar ratio and reaction temperature, (
d
) reaction time with catalyst amount, (
e
) methanol/oil molar ratio and catalyst amount, and (
f
) methanol/oil molar ratio and reaction time.
The optimal values of the independent variables selected for the transesterification of sesame biodiesel were obtained by solving the regression equation (Equation 2) using the Design Expert software. The optimal conditions for this process were statistically predicted as
X1
= 63°C,
X2
= 1.04 wt.%,
X3
= 51.09 min, and
X4
= 6.24. The predicted sesame biodiesel yield under the above set of conditions was
Y
= 99.71%. In order to verify the prediction of the model, the optimal conditions were applied to three independent replicates, and the average biodiesel yield obtained was 98.63%, which is well within the predicted value for the model equation.
Sesame biodiesel quality characterization and fuel properties
The results of GC analysis revealed that sesame biodiesel is mainly composed of methyl esters of linoleic acid (45.17%) and oleic acid (39.02%), palmitic acid (8.47%) followed by 5.15% stearic acid, 0.93% behenic acid, 0.77% arachidic acid, 0.15% linolenic acid, 0.09% myristic acid, 0.04% palmitoleic acid, 0.03% arachidonic acid, and 0.01% erucic acid. These observations further showed that the sesame biodiesel produced under the optimal condition was within ASTM D 6751 specifications for free and total glycerol contents. In addition, Table
6
shows the results of the evaluation of sesame seed oil and fuel properties of the sesame biodiesel. Most of the fuel properties of sesame biodiesel from this study compared well with ASTM D6751 and EN 14214 biodiesel specifications.
Table 6
Properties of sesame biodiesel in comparison to biodiesel standards
Parameters
Sesame oil
Sesame biodiesel
ASTM D6751
EN 14214
Moisture content %
0.09
0.014
<0.03
0.02
Kinematic viscosity (mm2/s) at 40°C
31.39
4.03
1.9 to 6.0
3.5 to 5.0
Iodine value (g I2/100 g )
108
86.72
-
120 max
Acid value (mg KOH/g)
0.50
0.25
0.50 max
0.5 max
Density (kg/m3) at 25°C
833
873
-
860 to 900
Higher heating value (MJ/kg)
40.20
41.35
-
-
Flash point (°C)
-
180
>130
>120
Pour point (°C)
-
6
-
-
Cloud point (°C)
-
18
-
-
Diesel index
55.80
69.17
50.40
-
API
29.30
30.03
36.95
-
Cetane number
50.73
59.80
47 min
51 min
Aniline point (°F)
190.42
230.33
331.00
-
Conclusions
The results obtained in this study using response surface methodology to determine the effects of four reaction variables, namely, oil/methanol molar ratio, reaction temperature, catalyst concentration, and reaction time on sesame biodiesel yield via methanolysis, indicate that the biodiesel produced had fuel properties that satisfied both the ASTM D 6751 and EN 1424 standards. The statistical model predicted the optimal conditions for the selected transesterification variables as reaction temperature of 63°C, catalyst amount of 1.04 wt.%, reaction time of 51.09 min, and methanol/oil molar ratio of 6.24 with an actual sesame biodiesel yield of 98.63%. Hence, the work established the usefulness of RSM for optimum conversion of sesame (
S. indicum
) seed oil to biodiesel and also suggests that sesame oil could be effectively used as feedstock for biodiesel production.
Authors’ information
EB is a senior lecturer in the Department of Chemical Engineering, Obafemi Awolowo University, Ile-Ife, Nigeria. He holds B.Sc. and M.Sc. degrees in Chemical Engineering from Obafemi Awolowo University. He also received a Ph.D. degree in Biotechnology from Technical University Carolo-Wilhelmina, Braunschweig, Germany in 2005. He was a DAAD scholar and a guest scientist at the National Research Centre for Biotechnology, Germany between April 2001 and December 2004, respectively. His research focus is in the area of biofuel development and bioconversion of agricultural crops and wastes to useful products. TFA is a lecturer in the Department of Chemical Engineering, Landmark University, Nigeria. He holds a M.Sc. degree in Chemical Engineering from Obafemi Awolowo University, Ile-Ife, Nigeria.
Acknowledgments
E. Betiku gratefully acknowledged the equipment donation by the World University Service, Germany and provision of relevant literature by the DAAD. The authors also thank A.K. Omole and O.E. Aluko for their technical support.
Competing interests
Authors declare that they have no competing interests.
Authors’ contributions
EB conceived and designed the research work. He is the major contributor in the preparation of the manuscript. TFA was involved in the laboratory work, and he drafted the manuscript. Both authors read and approved the final manuscript.
References
Balat (2010) Potential alternatives to edible oils for biodiesel production - a review of current work (pp. 1479-1492) 10.1016/j.enconman.2010.10.011
Shay (1993) Diesel fuel from vegetable oils: status and opportunities 4(4) (pp. 227-242) 10.1016/0961-9534(93)90080-N
Aransiola et al. (2010) Production of biodiesel by transesterification of refined soybean oil (pp. 391-399)
Rashid et al. (2011) Application of response surface methodology for optimizing transesterification of Moringa oleifera oil: biodiesel production (pp. 3034-3042) 10.1016/j.enconman.2011.04.018
Berrios et al. (2007) A kinetic study of the esterification of free fatty acids (FFA) in sunflower oil (pp. 2383-2388) 10.1016/j.fuel.2007.02.002
Yuan et al. (2008) Optimization of conversion of waste rapeseed oil with high FFA to biodiesel using response surface methodology (pp. 1678-1684) 10.1016/j.renene.2007.09.007
Margaretha et al. (2012) Calcium oxide from Pomacea sp. shell as a catalyst for biodiesel production10.1186/2251-6832-3-33
Tiwari et al. (2007) Biodiesel production from jatropha oil (Jatropha curcas) with high free fatty acids: an optimized process (pp. 569-575) 10.1016/j.biombioe.2007.03.003
Wu and Leung (2011) Optimization of biodiesel production from camelina oil using orthogonal experiment 88(11) (pp. 3615-3624) 10.1016/j.apenergy.2011.04.041
Muthu et al. (2010) Synthesis of biodiesel from neem oil using sulfated zirconia via transesterification 27(4) (pp. 601-608)
Aransiola et al. (2012) Production of biodiesel from crude neem oil feedstock and its emissions from internal combustion engines 11(22) (pp. 6178-6186) 10.5897/AJB11.2301
Meher et al. (2006) Optimization of alkali-catalyzed transesterification of Pongamia pinnata oil for production of biodiesel 97(12) (pp. 1392-1397) 10.1016/j.biortech.2005.07.003
Saydut et al. (2008) Transesterified sesame (Sesamum indicum L.) seed oil as a biodiesel fuel 99(14) (pp. 6656-6660) 10.1016/j.biortech.2007.11.063
Wang et al. (2011) Production and selected fuel properties of biodiesel from promising non-edible oils: Euphorbia lathyris L., Sapium sebiferum L. and Jatropha curcas L 102(2) (pp. 1194-1199) 10.1016/j.biortech.2010.09.066
Marasabessy et al. (2012) Dilute H2SO4-catalyzed hydrothermal pretreatment to enhance enzymatic digestibility of Jatropha curcas fruit hull for ethanol fermentation10.1186/2251-6832-3-15
Agarry and Ogunleye (2012) Box-Behnken design application to study enhanced bioremediation of soil artificially contaminated with spent engine oil using biostimulation strategy10.1186/2251-6832-3-31
Jeong et al. (2009) Optimization of transesterification of animal fat ester using response surface methodology (pp. 25-30) 10.1016/j.biortech.2008.05.011
Zhang et al. (2010) Biodiesel production from vegetable oil using heterogenous acid and alkali catalyst 89(10) (pp. 2939-2944) 10.1016/j.fuel.2010.05.009
Fan et al. (2011) Biodiesel production from crude cottonseed oil: an optimization process using response surface methodology (pp. 1-8) 10.2174/1876973X01004010001
Ustimenko-Bakumovsky (1983) Mir Publishers
Yeramanos et al. (1972) Oil content and composition of the seed in the world collection of sesame introductions (pp. 20-23) 10.1007/BF02545131
Brar (1982) Variations and correlations in oil content and fatty acid composition of sesame (pp. 434-439)
Ahmad et al. (2010) Environment-friendly renewable energy from sesame biodiesel 32(2) (pp. 189-196) 10.1080/15567030802467480
Ahmad et al. (2011) Quantitative and qualitative analysis of sesame oil biodiesel, Energy Sources 33(13) (pp. 1239-1249)
Schinas et al. (2009) Pumpkin (Cucurbita pepo L.) seed oil as an alternative feedstock for the production of biodiesel in Greece (pp. 44-49) 10.1016/j.biombioe.2008.04.008
Elleuch et al. (2007) Quality characteristics of sesame seeds and by-products 103(2) (pp. 641-650) 10.1016/j.foodchem.2006.09.008
Guan and Yao (2008) Optimization of viscozyme L-assisted extraction of oat bran protein using response surface methodology (pp. 345-351) 10.1016/j.foodchem.2007.05.041