Review
Introduction
The main solid residues from sugar and ethanol production are sugarcane bagasse and sugarcane trash, also named as sugarcane agriculture residues (SCAR) a [ 1 ]. Sugarcane bagasse is the fibrous waste that remains after the recovery of sugar juice via crushing and extraction. It also has been the principal fuel used around the world in the sugarcane agro-industry because of its well-known energy properties [ 2 , 3 ]. The introduction of mechanized sugarcane harvesting combined with technological improvements has empowered the cogeneration in sugar and ethanol factories. This development has taken place during the last two decades of the twentieth century, and it has changed radically the viewpoint on the use of residuals in the sugarcane agro-industry [ 4 – 6 ].
Sugarcane (
Saccharum officinarum
)
b
is the world's largest cash crop. There are more than 90 sugar-producing countries around the world. Especially for underdeveloped countries, sugarcane residue disposal has a first-order priority. The world's sugarcane production has experimented a dramatic growth during the last decade (Figure
1
).
World's sugarcane production 1997 to 2010
[
7
]
.Figure 1

The world sugarcane agro-industry has processed more than 1,685 × 10 6 tons in 2010. The mentioned amount of sugarcane generated 23.6 × 10 6 tons of bagasse (dry basis) and a similar amount of SCAR. The energy content of both residues could mean about 85 × 10 6 tons of oil equivalent. In other words, the sugarcane agro-industry produces around 660 kg of solid residues for each milled ton of cane (wet basis).
Among the sugarcane-producing countries, Brazil, today the world's leader in the use of renewable energies c in general, in bioenergy in particular, plays a special role in this field. The Brazilian sugarcane agribusiness development is a successful reference which could be replicable partially or modified by many sugarcane-producing countries [ 7 – 12 ]. Brazil has the most developed and integrated biofuel program in the world. It is an indisputable fact that Brazilian liquid biofuels are most well known across the world. The bioethanol that comes from sugarcane is especially important [ 13 – 18 ]. From a technical and economical point of view, it is cheaper and easier to produce ethanol from sugarcane than from corn. The ethanol from sugarcane produced in Brazil is three to four times cheaper than the bioethanol from corn produced in the USA. d In order to produce ethanol from corn, an additional step is necessary in the production process. The starch of corn should be converted to sugar before the fermentation, while in the case of sugarcane, the sugar for fermentation is contained directly in the sugarcane juice. This advantage of ethanol from sugarcane is really an opportunity for underdeveloped sugarcane-producing countries to diversify the sugarcane industry through the introduction of new sugarcane by-products, such as fuel bioethanol and other sugarcane derivates. However, the production of fuel bioethanol from sugarcane juice competes with the production of sugar, other food products, and medicines. This fact plus other elements, such as issues concerning greenhouse gas (GHG) emissions, the rise of oil price in the international market, and other geopolitical factors associated with traditional oil supply instability, are encouraging the introduction of the second-generation biofuels as a new opportunity obtained from biomass residues and lignocellulosic biomass.
This new trend should be considered during the modernization of the sugar industry or for energy planning by companies and governments. The main reason to take into account the production of second-generation bioethanol is that, as it was already mentioned, 66% of the residues of sugarcane are lignocellulosic.
In the light of second-generation bioethanol production surplus sugarcane bagasse could be used to produce bioethanol or to produce surplus electricity. The use of bagasse for second-generation bioethanol production, instead of its traditional use as fuel for cogeneration in the sugar factory, has raised some new concerns on its possible substitute. Although SCAR energy use is still minuscule in the Brazilian sugar factories, it seems to be that SCAR should be the substitute of the bagasse for cogeneration in the sugar factory.
The main aim of this paper is to carry out an assessment on the bagasse and SCAR availability and their energy use in the sugarcane agro-industry. The trade-off on sugarcane bagasse energy use (electricity cogeneration vs. bioethanol production), considering the agro-industrial development level, is analyzed, too. The better options in each case are highlighted. The main environmental and techno-economic aspects concerning the sugarcane agro-industry were taken into account during the assessment process. The most promising trends of the sugarcane agro-industry and the barriers that should be overcome in its implementation are pointed out.
Agro-industrial features of sugarcane agribusiness
Agricultural aspects
The sugarcane is a prodigious gramineous plant which belongs to the so-called C
4
plants (because the first product is 4-carbon sugar). These kinds of plants have the biggest potential sunlight conversion capacity into biomass (until 6.7%). In fact, the average figures reported on sunlight conversion are about 1.5% to 3%. Most of the world's sugarcane is grown between latitudes 22°N and 22°S and some up to 33°N and 33°S. Because of this reason, sugarcane plantations in commercial scale can be found from Bangladesh to South Africa, from Louisiana, USA to Argentina, and from China to Australia. Several indicators and general parameters are valid for all sugarcane-producing countries, regardless of their geographical region. Considering this fact and in order to make easier the present assessment, those very specific indicators of sugarcane that do not have expressive importance for comparison were disregarded. In Table
1
are shown the most common indicators of sugarcane agriculture, their parameters, features, performances, and the particularities that deserve to be considered.
Sugarcane parameters, indicator, and features adopted in the present work Number Parameters, indicator, and features Unit Value Observation 1 Sugarcane agriculture yield ton·ha−1 ≥70 2 Sugarcane pola content % ≥13 3 Sugarcane fiber content % 13 4 Nonsugar insoluble solid content % ≤2 to 3 5 Sugarcane plantation age months 12 to 18 6 Total rainfall or irrigation mm 1,100 to 1,500 7 Milling season duration day 180 to 210 In dry season 8 Number of harvests - ≤5 9 Harvesting method yield Manualb ton (man·day)−1 4 to 8 Burnt cane Mechanicalc ton (machine·day)−1 500 to 800 Green cane Combined harvesting methoddTable 1
Industrial aspects
Unlike the agricultural aspects, the development of the sugarcane industry has the particular footprint of each region and country. Each country's footprint includes geographical, demographical, cultural, socioeconomic, geopolitical, anthropologic, techno-economic, and environmental factors. Because of the huge amount of regional particularities, it is impossible to have a ‘one size fits all’ approach to assess the sugarcane industry across the world.
The degree of technological development is not uniform in the sugar industry, even in the same country. It is possible to find these contrasting situations in African, Latin-American, and Indian sugarcane industries. For instance, all sugar mills existing in the state of Orissa, India (seven sugar mills) present a low and very low technological development. In contrast, in the Indian state of Maharashtra (24 sugar mills), there is a combination of well technologically developed sugar mills (three sugar mills) and low technologically developed sugar mills [ 19 ].
Most of the sugar mills in Louisiana, USA have good technological development. However, in this state is located the Lasuca sugar mill (daily milling capacity about 4,000 tons of cane per day) [ 20 ], which uses natural gas for sugar manufacturing. The technological development of the Lasuca sugar mill can also be considered very low since it burns fossil fuel to meet the sugar production process energy requirement, which is retrograde today, considering the readiness level of the sugar industry technology and the environmental issues.
Although there is a general trend towards modernization, sugar mills with a very low technological development and with state-of-the-art technology are often both found in sugar-producing countries. e For this reason, in this work, the technological development of sugar factory was conventionally classified in four possible levels:
Very low technological development (VLTD),
Low technological development (LTD),
State-of-the-art technology (SOTAT),
Future step of technology development (FSOTD).
In Table
2
are shown the main features belonging to each of the considered levels of technological development.
Operational parameters, main features, and products of the different levels of sugar factory technological development Products, operational parameters, and data VLTD LTD SOTAT FSOTD Operational parameters and features Milling capacity (ton of cane per day) ≤3000 3,000 to 7,000 7,000 7,000 to 1,200 Thermodynamic cycle Rankine Rankine Rankine Rankine and Brayton BPST (Mw, K, MPa) ≤7, ≤593, 1.9 - - - CEST (Mw, K, MPa) - 38, 593, 4.2 30, 793, 6.3 BIG/GTCC (Mw, K, MPa) - - - 52, 793, 8 Steam pressure process (MPa) 0.25 0.25 0.25 0.25 Steam pressure molecular sieve (MPa) - - 0.6 0.6 Steam per ton of milled cane (%) 52 45 38 28 Electrical and mechanical consumption per ton of cane (Kw he) 25 25 25 30 Energy self-sufficiency Nog Yes Yes Yes Products Non-centrifugal sugara (ton/ton of cane) Not available Not available - - Raw centrifugal sugar 96b (ton/ton of cane) 0.1 0.117 0.12 0.12 VHP sugarc (ton per ton of cane)d - 0.117 0.12 0.12 Hydrated ethanole (L/per ton of cane) - 70 to 75 73 to 80 80 to ? Anhydrous ethanolf (L/ton of cane) - 70 70 to 75 75 to ? Electricity cogenerated per ton of cane (Kw he) 22.79 50 110 120 to 177 Surplus electricity per ton of cane (Kw he) 0 25 85 90 to 148Table 2
BPST, back-pressure steam turbine; CEST, condensation-extraction steam turbogenerator; BIG/GTCC, biomass-integrated gasifier/gas turbine combined cycle system; VHP very high pol. a It is known by a range of names: gur in India and Bangladesh, desi in Pakistan, jaggery in Africa, and panela in South America. This type of sugar, as a rule, is produced using relatively low-cost technology but can also be produced in medium and large factories. b Raw sugar is a type of sugar with sucrose content not less than 96° pol. c VHP not less than 99.3° pol. d As a rule, 50% of cane juice is used for sugar production. Half of cane juice production goes to ethanol production. The average production yield of raw centrifugal per ton of milled cane is 0.106 to 0.12 ton. The production yield of VHP sugar and refined sugar per ton of milled cane are 0.117 and 0.083 tons, respectively. e Hydrated ethanol alcohol content is 95, 56 ± 0.43 degrees Gay-Lussac (° GL). f Anhydrous ethanol minimum alcohol content is 99, 58° GL. It is used for gasoline blend. g Most of the sugar mills import electricity to meet process energy demand.
This classification is necessary from a methodological viewpoint because the level of technological development determines the real possibility of sugarcane energy use. The higher is the sugar mill technological development, the bigger will be its possibility of sugarcane energy use.
It deserves to remark that this classification is not conclusive. In other words, this classification may not reflect exactly the reality of some sugar mills across the world. The classification makes easier the analysis of the main goals of the present work and contributes to make the analysis as wide as possible.
Very low technological development
Commonly, this kind of sugar mills is a small facility that produces centrifugal and noncentrifugal sugar. Product diversification in these mills is practically inexistent. Ethanol production is semi-craft and very small scale (when it takes place). Bagasse management and disposal practices employed by these mills have remained, in most cases, the same as those used back in the early nineteenth century when the factories were designed without any relation to energy efficiency (most operate at a low 16% to 20% efficiency). At that time, factories consumed all the available bagasse just to meet mill energy demands, resulting in no accumulation of excess bagasse.
f
Regrettably, by that method, the possibility to recover and use an important quantity of energy from bagasse was lost. This mentioned waste of a potential energy source is especially unfortunate in underdeveloped sugarcane-producing countries where the demand for electric power exceeds the local capacity. Figure
2
shows the typical cogeneration scheme of a VLTD sugar factory.
VLTD sugar mill typical cogeneration system
[
21
]
.Figure 2

Low technological development
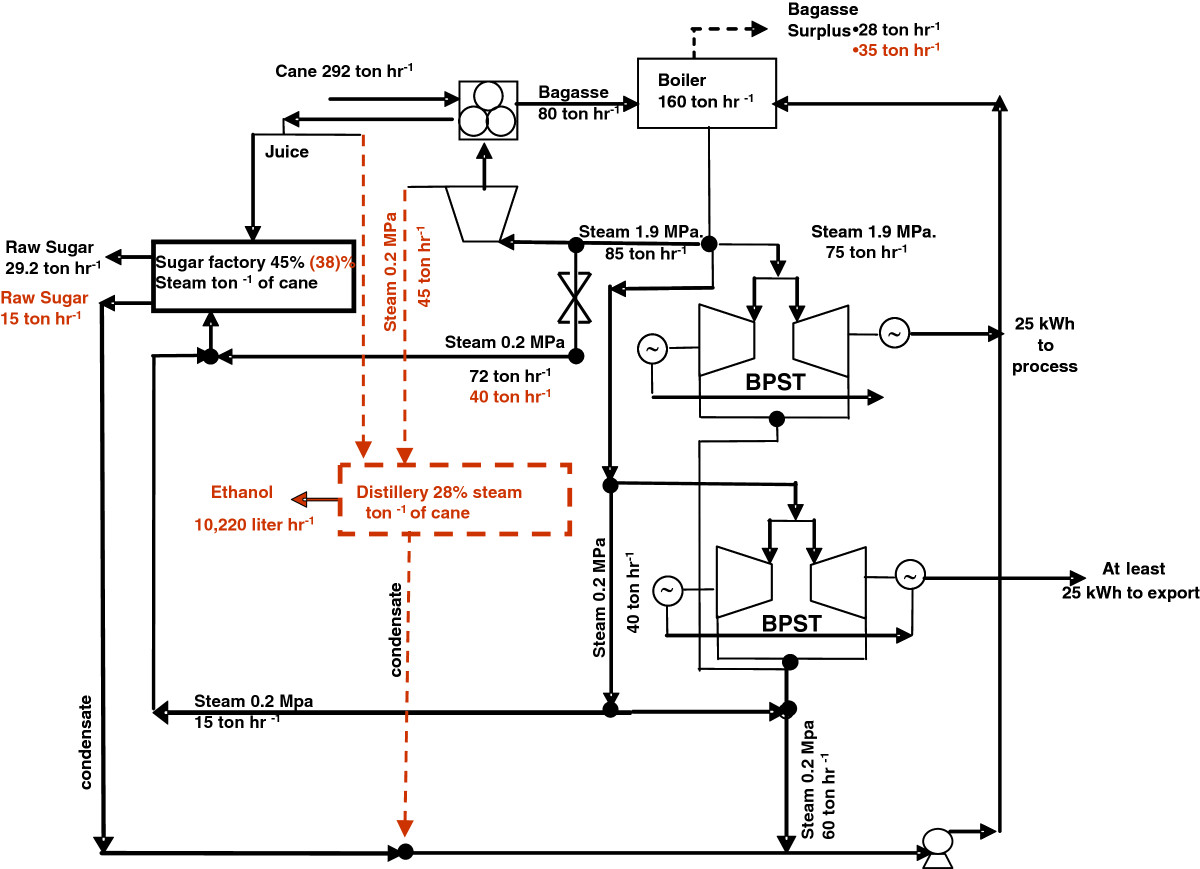
There are many possible variants of LTD sugar factories. Figure
3
shows a scheme with most common elements of these kinds of mills. Commonly, these facilities do not use sugarcane juice directly to produce ethanol. An insignificant amount of ethanol is produced from molasses obtained during sugar production in an LTD sugar mill. However, nowadays, several sugar facilities have begun their technological improvement in Latin America, Asia, and Africa. Considering the mentioned situation, the simultaneous sugar-ethanol production from sugarcane juice was calculated, assuming that half of the sugarcane juice is used for ethanol production (Figure
3
). Mass flow parameters and production rates of the simultaneous sugar-ethanol production layout are highlighted in red. It is easy to notice that when juice is not used for ethanol production, which is a common situation, the sugar production rate is twice bigger than the production when ethanol is produced.
LTD sugar mill scheme (simultaneous sugar-ethanol production option was estimated)
[
22
]
.Figure 3
Even in an LTD scheme sugar mill, there is a possibility of exporting some quantities of electricity if its process of mass energy balance is properly adjusted. However, because of the high-cost investment of transmission lines, the sugar mill rarely takes this opportunity. Thus, the surplus bagasse could be sold or used to produce board.
State-of-the-art technology
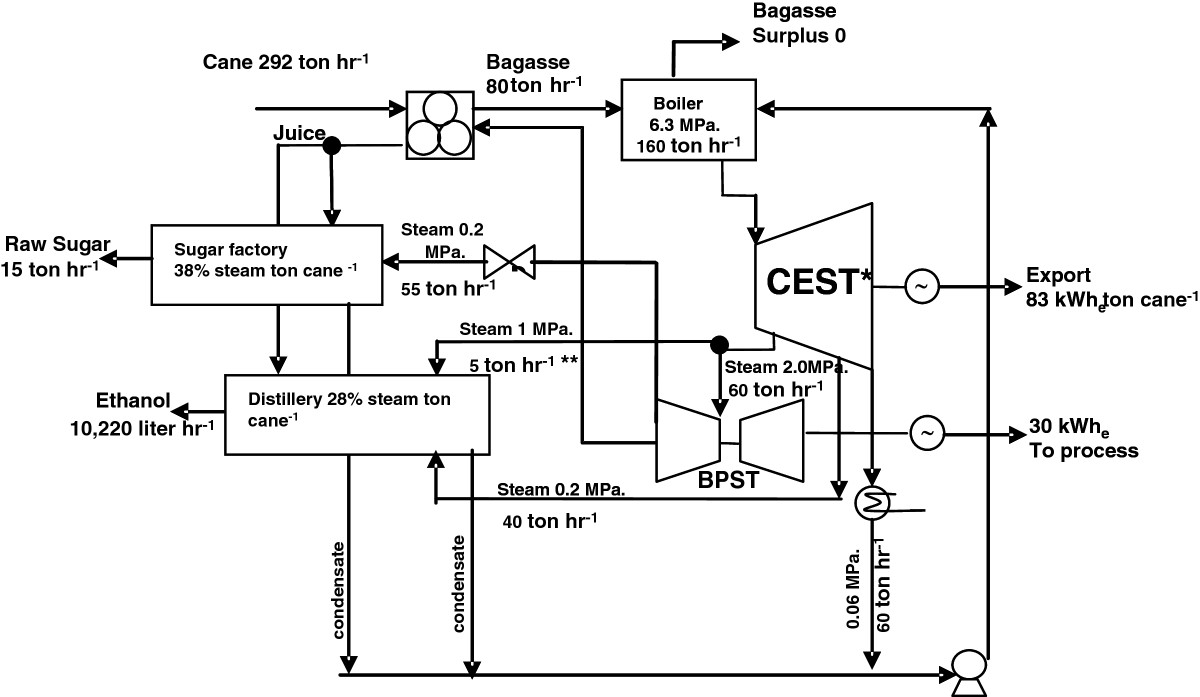
The SOTAT level is characterized by the wider variety of products, among them are raw sugar, VHP sugar, anhydrous ethanol, hydrated ethanol, and power electricity. Many Brazilian sugar mills have reached this stage. The classical scheme of a SOTAT sugar facility is shown in Figure
4
. The simultaneous sugar-ethanol production is characterized in the SOTAT stage. Several improvements were introduced in the sugar and ethanol processes in the last years. These improvements made possible a considerable decrease of steam consumption in both sugar production process and ethanol distillation. Steam-saving makes possible to increase the sugar mill cogeneration capacity.
SOTAT sugar mill scheme and cogeneration scheme of condensation extraction steam turbogenerator (CEST).
Simultaneous sugar-ethanol production: two extractions (single asterisk) and steam for molecular sieve dehydration (double asterisks) [
23
].Figure 4
Future step of technology development
There are two principal schemes potentially foreseen for FSOTD of sugar factories until today:
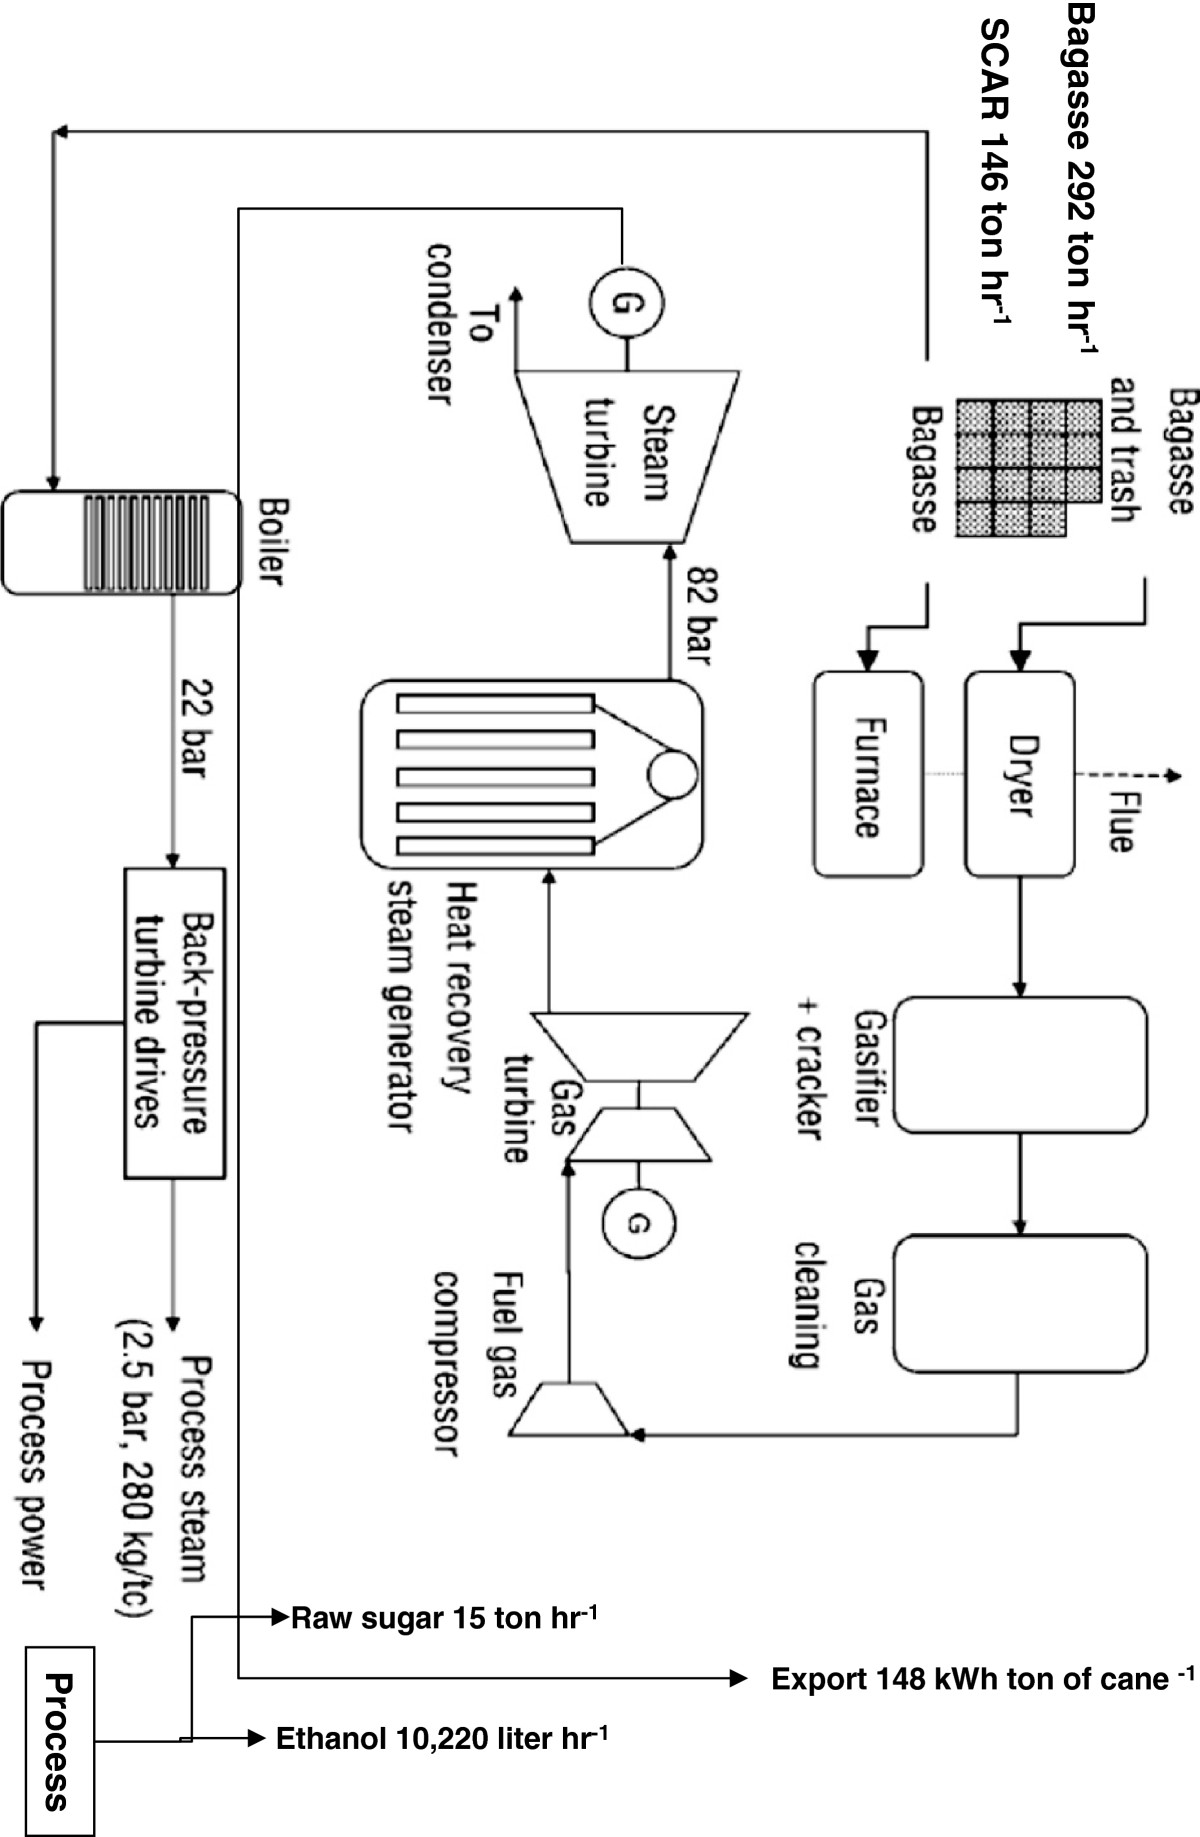
FSOTD: Maximization of electricity power cogeneration . FSOTD maximization of electricity power variant hereafter is referred also as FSOTD electricity . The sugar factory FSOTD electricity is a convenient variant when the goal is to increase electrification in poor regions without other alternative renewable energy supplies. The main disadvantages of this pathway are the seasonality characteristic of the sugarcane agro-industry, the relative small scale of sugar facilities, g and the high initial capital investment. Most well-known scheme of FSOTD electricity is the biomass integrated gasifier/gas turbine combined cycle (BIG/GTCC) system [ 24 ]. The BIG/GTCC system for a sugar mill is shown in Figure 5 .
Figure 5
Schematic diagram of the BIG/GTCC system. All process steam demand is provided from the exhaust steam of the back pressure steam turbine drives. The electrical output of the gas turbine/steam turbine combined cycle augments the mechanical and electrical power process provided by the backpressure drives. Remaining electricity is available for export to the grid. Adapted from [ 24 ].
Large-scale production of lignocellulosic ethanol including both bagasse and SCAR energy . FSOTD second-generation ethanol maximization variant hereafter is referred also as FSOTD ethanol . The second pathway of sugar factory FSOTD ethanol will be possible by the large-scale production of lignocellulosic ethanol in sugar facilities. Lignocellulosic ethanol is produced initially from sugarcane solid residues (bagasse and SCAR). Lignocellulosic ethanol is also called second-generation ethanol because its production does not compete with sugar produced from sugarcane juice such as in the case of traditional ethanol. In this case, unlike the first pathway, it maximizes ethanol production. The advantage of this scheme is that residue energy can be stored and used in the off-season period or anytime independently from its production date. The disadvantage of lignocellulosic ethanol is that ethanol production requires large quantities of water and the disposal of vinasse. h Figure 6 shows the scheme of an FSOTD ethanol factory.
Figure 6
Sugar mill cogeneration scheme (7,000 tons of cane per day). Condensing extraction steam turbine (CEST) with SCAR use and simultaneous sugar-bioethanol production (second-generation bioethanol) [ 4 ].

The feedstock and second-generation ethanol mass flows are highlighted in orange. There are two possible approaches to carry out the assessment of second-generation ethanol production efficiency in the FSOTD sugar facility. The first approach is to exclude pentose (hemicellulose) fermentation and just regard hexose (cellulose) use for ethanol production. The second approach is to consider both celluloses and hemicelluloses. The inclusion of hemicelluloses in the production process depends on their hydrolysis efficiency. The hydrolysis of hemicelluloses until today is an unsolved question [
25
]. Table
3
[
26
] shows the chemical composition of sugarcane bagasse and SCAR.
Sugarcane bagasse and SCAR chemical composition Component Chemical composition (wt.%) Bagasse SCAR Cellulose (hexoses) 46 48 Hemicelluloses (pentoses) 27 27 Lignin 23 13 Pectin 0 4 Ash 4 8Table 3
The hemicellulose represents 27% of bagasse and SCAR weight. From Table 3 , it is easy to notice that the hemicellulose exclusion means a significant decrease of the ethanol yield.
Accounting of feedstock energy
The accounting of feedstock energy can be a good tool for a quick analysis on the pre-feasibility of a manufacturing facility during project management. The key indicator of this method is the utilization rate. The assessment of unused capacity is expressed usually through the utilization rate figures. In this work, this performance indicator was adapted to assess what share of sugarcane energy is not used for each of the production schemes analyzed.
The feasibility and sustainability of sugarcane energy use have been treated by different authors [ 7 , 9 , 13 ]. Most of published works are based on environmental and techno-economical premises. In the present work, the main criteria used were sugarcane energy content and production diversification capacity installed in sugar mills. The goal is to elaborate an additional simple and complementary tool for the preliminary assessment of feasibility of a sugarcane facility. Since the used criteria for assessment, sugarcane energy content and sugar mill technological development, are simpler to evaluate than others, based on the accounting of GHG, the proposed method is easy. It is important to underline that accounting of feedstock energy does not substitute the mass-energy balance assessment of the manufacturing process. The utilization rates cannot be considered during thermodynamic calculations. Although the efficiency is also a rate indicator, its nature is completely different from the utilization rate used during accounting of feedstock energy. The efficiency takes into account enthalpy, phase changes, and thermodynamic laws; its value should be less than one. The utilization rate calculated in this work does not consider any of the aforementioned factors.
Sugarcane energy content
The total cane energy content, excluding ash (around 2% to 3%), can be divided into three main parts (see Table
4
rows 1 to 3). Traditionally, sugarcane juice (H
2
O + sacarose + molasses + insolubles) is used for sugar and ethanol production, while bagasse is used to meet the energy demand required during sugar and ethanol manufacturing processes. The SCAR energy content is similar to the bagasse energy content [
1
,
27
]. However, the modern sugarcane agro-industry does not utilize usually the energy potential of SCAR. In many places, sugarcane is burnt just before the harvest in order to facilitate easier harvesting of cane stalks. In that way, SCAR energy use is made impossible.
Utilization rate of sugarcane feedstock component parts Row Feedstock/sugarcane parts (average figures for currently commercial sugarcane varieties)[ Mass (kg)[ (1 ton of cane; dry basis) Energy content[ (MJ) Final products LHV (MJ/kg), (MJ/kW h) Unit Rate of feedstock energy use (1 ton of sugarcane) VLTD (Figure LTD (Figure SOTAT (Figure FSOTD (Figure FSOTD (Figure Yield Product energy content (MJ) Sugarcane utilization rate (%)a Yield Energy (MJ) Sugarcane utilization rate (%)a Yield Product energy content (MJ) Sugarcane utilization rate (%)a Yield Product energy content (MJ) Sugarcane utilization rate (%)a Yield Product energy content (MJ) Sugarcane utilization rate (%)a (1) (2) (3) (4) (5) (6) (7) (8) (9) (10) (11) (12) (13) (14) (15) (16) (17) (18) (19) (20) (21) 1 Juice (sucrose + molasses + others) 142 2,257 Sugar 17 kg 100 1700 0.26 58 986 0.28 58 58 986 0.31 58 986 0.35 58 986 0.33/0.34 2 Fiber residues (bagasse) 140 2,184 Ethanol 22 L 0 0 35 770 35 770 35 770 42/45 924/990 3 SCAR 140 2,184 Electricity 3.6 kW h 0 0 25 90 83 148 532,8 90 324 4 Total sugarcane 422 6,625 Total 1,700 1,846 2,041 2,289 2,234/2,300Table 4
Feedstock utilization rate calculation
The calculation of utilization rates was carried out step by step for each of the selected schemes. The results are shown in Table
4
. Columns 4, 5, and 6 of Table
4
show the main final products obtained currently at the sugar mill and their corresponding energy content. Columns 7 to 21 of Table
4
show the three parameters that characterize each of the possible stages of technological development which are production yield, products energy content, and sugarcane utilization rate. The sugarcane feedstock utilization rate was estimated using the following equation:
The relevant explanations about each of the showed figures were given as footnotes and included in the last row of Table
4
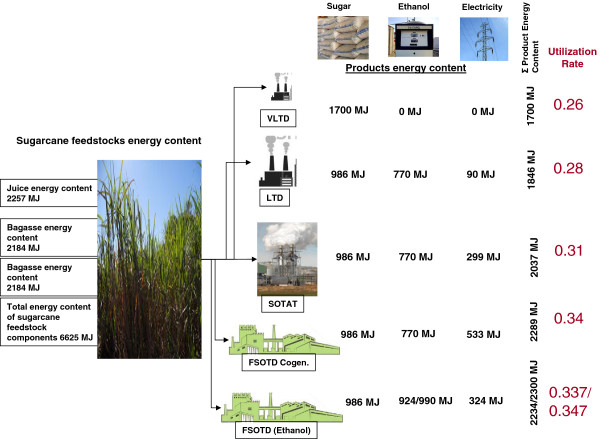
. A graphical explanation on the utilization rate indicator is shown in Figure
7
.
Graphical explanation of the utilization rate
sugarcane feedstock
calculation.Figure 7
VLTD is the stage where the main and unique product is the sugar. The rest of the schemes considered simultaneous sugar and ethanol production. All figures of sugar and ethanol production were calculated assuming that half of the sugarcane juice is used for each product.
There are no sugar mills running full in FSOTD level. SCAR energy use is not considered for FSOTD variants because the use of this residue in actual practice is still minuscule. SCAR use is the subject of several research across the world currently. All data used for FSOTD figure calculations were assumed, considering the main trends of the sugarcane agro-industry [ 28 – 31 ].
Economic impact of sugarcane energy use
The result obtained from economic impact calculation is shown in Table
5
. In this table, the utilization rates of sugarcane for each of the studied levels of technological development are also shown. In Table
5
, 1 ton of oil equivalent and its relevant energy content were included in order to facilitate the understanding of the analysis (row 2, columns 2 and 3). The current prices of Brent and West Texas Intermediate oils were also included (row 3). The relevant explanations about each of the shown figures were given as footnotes and included in the last row of Table
5
.
Economic impact of sugarcane energy use Row 1 ton (dry basis) Mass (kg) Energy content (MJ) Parameter VLTD LTD SOTAT FSOTD (electricity) FSOTD (ethanol) (1) (2) (3) (4) (5) (6) (7) (8) (9) 1 Total sugarcane 423 6,626 Total utilization rate (%)a 0.26 0.28 0.31 0.35 0.33/0.34 2 Oil equivalent 1,000 43,120 Sugarcane energy ( 0.04 0.043 0.048 0.054 0.050/0.052 3 Crude oil price (US$) [ Brent 105.26 4.2 4.51 5.04 5.67 5.25/5.46 WTI 89.90 3.59 3.86 4.31 4.85 4.49/4.67Table 5
The utilization rate of sugarcane energy does not exceed 31% nowadays. Even though SOTAT is presently the best stage of development from the viewpoint of sugarcane energy use, the total return of energy is lower than US$0.10/ton of milled cane. It is important to underline that this value is possible if sugar factories produce sugar and ethanol simultaneously. However, about 30% of Brazilian sugar factories are autonomous distilleries i (most of them were built recently), considering the forecasting of sugar price in the international market and other disadvantages such as less nimbleness of industrial process to face the failures and the oscillation of price at the sugar international market. It seems that the predominant tendency in the near future will still be simultaneous sugar-ethanol production and product diversification in the sugar factory.
Assuming that all the processed sugarcane in the world in 2010 (1,685 × 10 6 tons; see Figure 1 ) was milled in sugar factories running on VLTD scheme, their relevant profitability (expressed in oil price units) would be US$6,232 × 10 6 . On the other hand, considering that all aforementioned factories were running on LTD and SOTAT, the increase of profitability from the same amount of milled cane would be US$6,696 × 10 6 and US$7,480 × 10 6 , respectively. It is to say that there was an increase of US$464 × 10 6 and US$1,248 × 10 6 , respectively.
FSOTD requires a very high cost of investment [ 24 , 29 ], but the increase of profit is about 5% for both FSOTD electricity and FSOTD ethanol . In other works [ 24 , 28 ], capital investments for FSOTD electricity and FSOTD ethanol were estimated to be US$367 × 10 6 (in 2004) and US$311 × 10 6 (in 2011), respectively. In this way, considering the average money depreciation rate of 0.06/year, the capital investment cost is similar for both schemes. It is not possible to establish a clear economical advantage in any of the analyzed FSOTD variants. The selection of FSOTD electricity or FSOTD ethanol scheme depends on the domestic context and international economic growth tendencies.
Main barriers to overcome to further increase sugarcane energy utilization rate
The further increase of sugarcane energy use depends on several factors. Among them are physical, engineering, chemical, economical, social, biological, environmental, and political factors. For this reason, the agro-industrial development of sugarcane agribusiness is a multifactorial subject that requires a multidisciplinary approach. Regarding their influence on the issue, the following deserve special mention:
The mechanized harvesting method should be improved to make a better SCAR collection. Currently, existing methods were designed to leave SCAR in the field. Without an efficient use of SCAR energy, a complete upgrading of the sugarcane agro-industry is unthinkable.
The relative low capacity of known yeast to live in a substrate with high alcohol concentration.
The low thermoresistance of known yeasts used in the fermentation process.
The biomass cell wall resistances to microbial and enzymatic attack (also known as biomass recalcitrance) [ 32 ].
The very high cost of cellulase enzyme production.
The relatively low efficiency of known hydrolysis pretreatments.
The seasonality characteristic of sugarcane agro-industry.
The relatively small-scale sugar facilities (low agricultural yield).
The prohibitive cost of capital investment for the modernization of sugar factory.
It is necessary that a new generation of materials with high mechanical, thermal, and electrical properties is made available in order to develop a new generation of machinery that is more efficient and cheaper than the existing machinery.