Methods
Simulation
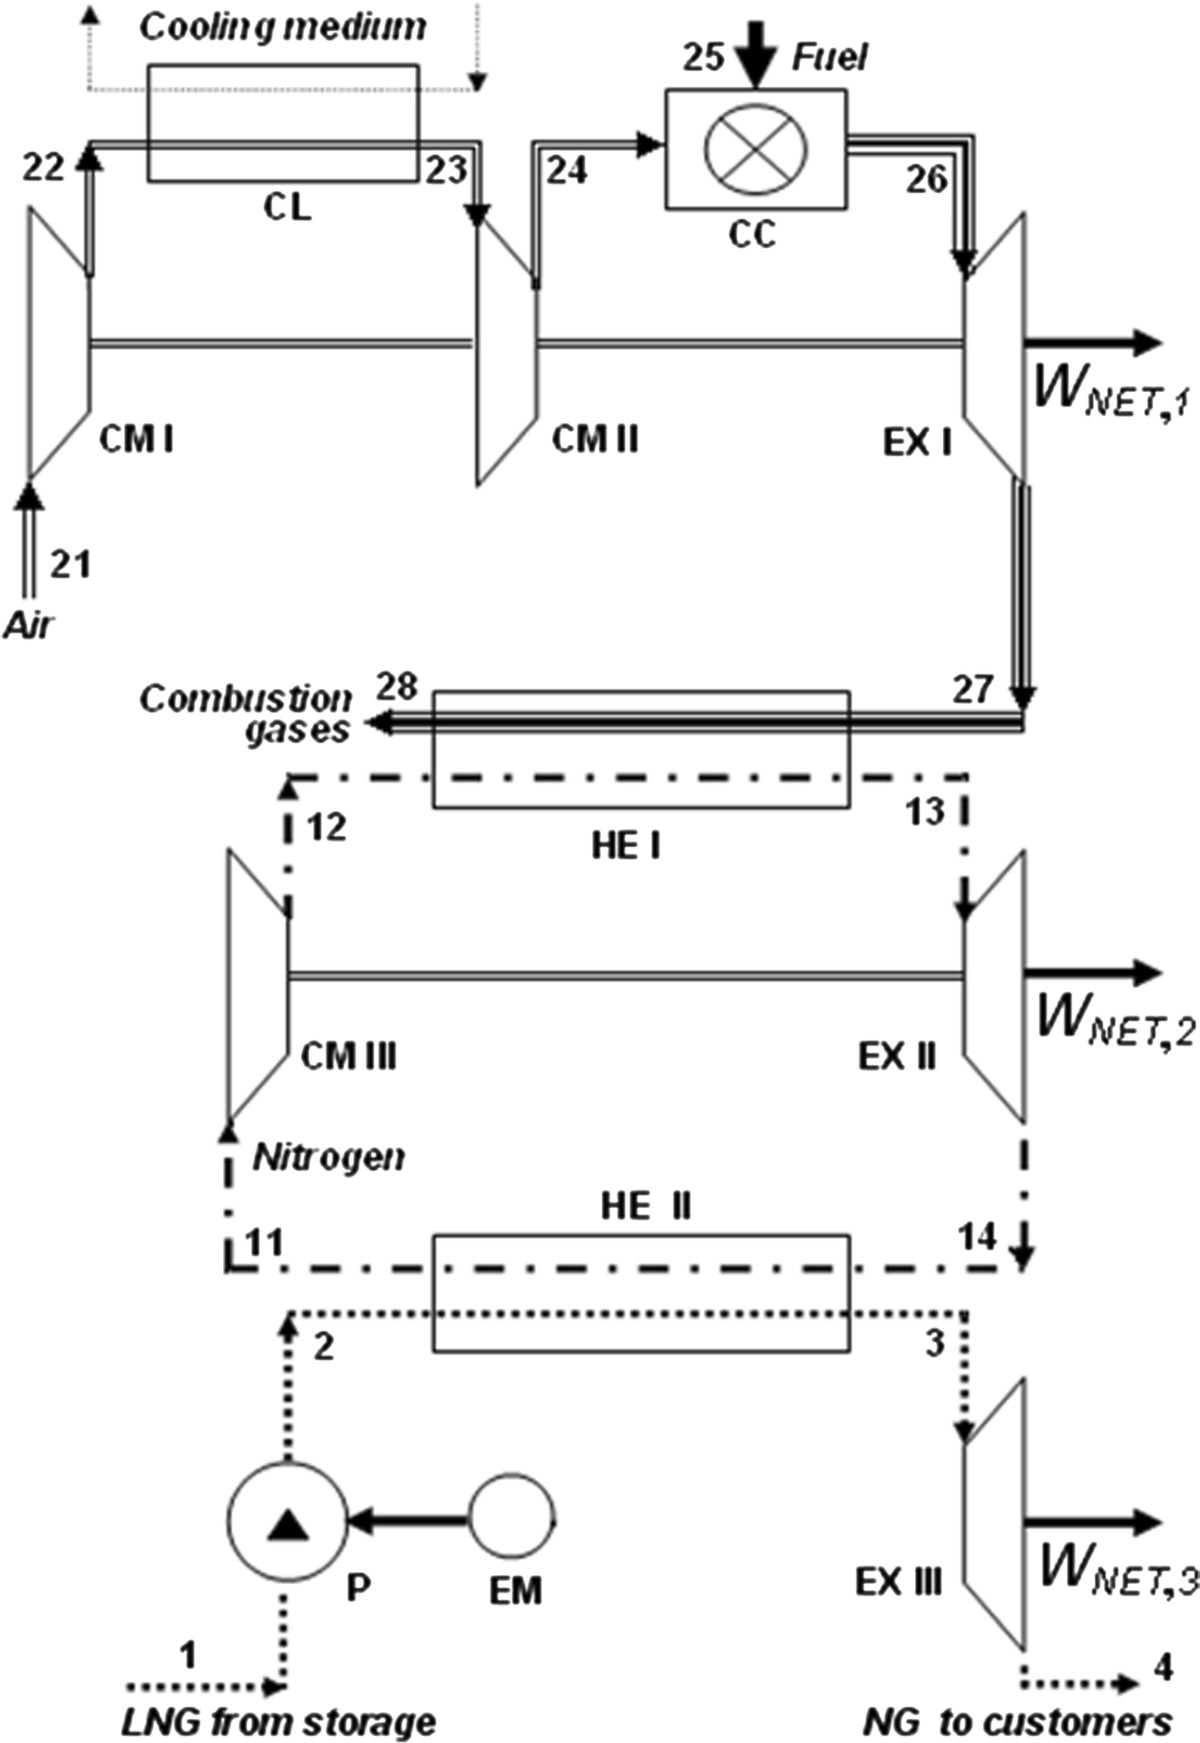
The base case is shown in Figure 1 . The overall system consists of three subsystems with the following initial data and assumptions:
· LNG subsystem (process 1–2 − 3–4) - LNG from the storage system is (a) compressed by an LNG pump (P), (b) vaporized in heat exchanger II (HE II) using the waste heat from the nitrogen power system, and (c) expanded in expander III (EX III).
· N2 subsystem (process 11–12 − 13–14) - The N2 subsystem is a closed-cycle gas-turbine power system. After being cooled in HE II, the nitrogen is compressed in compressor III (CM III), heated in heat exchanger I (HE I) using the waste heat from an open gas-turbine power system, and expanded in expander II (EX II).
· Open gas-turbine power subsystem (process 21 through 28) - Air after compression in compressor I (CM I) is cooled in the cooler (CL) transferring thermal energy to the environment and is compressed in compressor II (CM II). After the combustion process in the combustion chamber (CC), the combustion gases are expanded in expander I (EX I) and rejected to the atmosphere after being cooled in HE I. The open gas-turbine power subsystem is based on an LMS 100 gas turbine (General Electric Company, Fairfield, CT, USA) [
4
].
Schematic of the cogeneration system for vaporizing LNGFigure 1
For the simulation and the exergetic analyses, the softwares GateCycle (General Electric Company, Fairfield, CT, USA) [
5
], Gatex (Institut für Energietechnik, Technische Universität Berlin, Germany) [
6
], and EES (F-Chart Software, LLC, Madison, WI, USA) [
7
] were used. Table
1
presents some results obtained from the simulation [
3
]. The following assumptions were used:
η
CMI
= 90%,
η
CMII
= 90%,
p24/p21
= 42,
T
26
= 1,290°C,
η
EX I
= 94%,
Thermodynamic data for the material streams in the base case Material stream State (kJ/kg) LNG 1 65.03 −160 10 669.7 339.3 1,009 - 1,009 LNG 2 65.03 −144 272 250.5 778.5 1,029 - 1,029 NG 3 65.03 86 270 25.3 777.7 803 - 803 NG 4 65.03 2 80 1.0 630.0 631 - 631 N2 11 217 −129 2.85 58.6 88.4 147 - 147 N2 12 217 70 42.75 5.0 319.0 324 - 324 N2 13 217 415 40.61 162.2 314.8 477 - 477 N2 14 217 101 2.99 11.4 92.6 104 - 104 Air 21 209 15 1.013 - - 0 1 1 Air 22 209 242 6.66 - - 217 1 218 Air 23 209 117 6.53 - - 170 1 171 Air 24 209 416 43.47 - - 468 1 469 CH4 25 5.1 15 45 - - 566 51,534 52,100 Combustion gases 26 214.1 1,290 41.95 - - 1,281 9 1,290 Combustion gases 27 214.1 435 1.08 - - 190 9 199 Combustion gases 28 214.1 90 1.025 - - 18 9 27Table 1
Exergy-based analyses
Exergoeconomics is a unique combination of exergy analysis and cost analysis conducted at the component level to provide the designer or operator of an energy conversion system with information crucial to the design or operation of a cost-effective system. Decisions are made, however, at the plant component level [ 8 , 9 ]. A complete exergoeconomic analysis consists of (a) an exergetic analysis, (b) an economic analysis, and (c) an exergoeconomic evaluation.
An exergoenvironmental analysis is considered as one of the most promising tools to evaluate energy conversion processes from an environmental point of view [ 10 ]. Exergoenvironmental analysis is a proper combination of exergy analysis and life cycle assessment (LCA). The exergoenvironmental analysis consists of three steps: The first step is an exergy analysis. In the second step, an LCA of (a) each relevant system component and (b) all relevant input streams to the overall system is carried out. In the last step, the environmental impact obtained from the LCA is assigned to the exergy streams in the system.
Exergy analysis
Table 1 shows the value of exergy for each material stream. The chemical exergies for material streams of the N 2 and the LNG subsystems do not need to be considered in the exergetic analysis because only the physical exergy of the working fluid is used in the corresponding subsystems. We considered the chemical exergies only in the open gas-turbine subsystem, where combustion takes place. The physical exergies of LNG, NG, and N 2 are split into their thermal and mechanical parts according to the approach presented in [ 11 ].
The exergetic analysis has been conducted at the component level using the ‘exergy of the fuel’ and the ‘exergy of the product’ [
8
,
9
]. The definitions of
Results obtained from the conventional exergetic analysis
[
3
] Component (MW) (MW) (MW) (%) CM I 48.418 45.434 2.984 93.84 CL Dissipative component 9.993 - CM II 65.224 62.458 2.766 95.76 CC 267.603 178.131 89.466 66.57 EX I 233.661 227.569 6.092 97.39 HE I 36.926 33.091 3.834 89.83 CM III 57.021 51.222 5.799 89.83 EX II 80.956 72.829 8.127 89.96 HE II 19.722 14.427 5.295 73.15 P 34.295 28.582 5.713 83.34 EX III 11.249 9.479 1.770 84.26 Overall system ( 311.415 163.801 141.846 52.60Table 2
Exergoeconomic analysis
The exergoeconomic model for an energy conversion system consists of
cost balances
written for the
k
th component and auxiliary equations based on the P and the F rules [
8
,
9
]. The cost balances can be written as
or
where
To simplify the discussion, we assume that the contribution of
The real cost sources in an energy conversion system are the (a) capital investment (and operating maintenance expenses) for each component, (b) cost of exergy destruction within each component, and (c) cost of exergy loss from the overall system. The last two terms can be revealed only through an exergoeconomic analysis:
· The cost rate associated with exergy destruction within the
k
th component is
· The cost rate associated with exergy loss from the overall system is
The exergoeconomic model for the base case has been discussed in detail in [
12
]. Table
3
shows selected data obtained from the conventional exergoeconomic analysis. Here, the cooler is considered together with the cooling tower (
Exergoeconomic variables for the LNG-based cogeneration systems Component ($/h) ($/h) ($/h) ($/GJ) CM I 64.67 554 619 51.63 CL 11.10 Dissipative component CM II 97.01 514 611 51.63 CC 92.39 9,493 9,585 29.47 EX I 207.90 1,097 1,305 50.04 HE I 16.04 691 707 50.04 CM III 16.23 3,007 3,023 144.00 EX II 20.49 4,133 4,154 14.13 HE II 13.76 920 934 48.26 P 7.01 783 788 38.06 EX III 2.65 432 435 67.76Table 3
For the economic analysis, the methodology presented in [ 8 ] is applied using the following assumptions and sources:
· The purchased equipment cost of turbomachinery is based on data from [ 8 , 13 ].
· The purchased equipment cost of heat exchangers is based on data from [ 8 ].
· The cost of LNG is equal to $12/GJ [ 14 ].
· The average cost of money is i eff = 10%.
· The plant economic life is n = 15 years with 7,300 h/year.
· The average general inflation rate is r n = 2.5%
Exergoenvironmental analysis
Exergy analysis provides a powerful tool for assessing the quality of a resource as well as the location, magnitude, and causes of thermodynamic inefficiencies. In addition, LCA supplies the environmental impacts associated with a component or an overall system during its entire useful life. In the exergoenvironmental analysis, the environmental impacts obtained by LCA are apportioned to the exergy streams pointing out the main system components with the highest environmental impact and possible improvements associated with these components. Finally, exergoenvironmental variables are calculated, and an exergoenvironmental evaluation is carried out.
Life cycle assessment is a technique for assessing the environmental aspects associated with a product over its life cycle. The LCA process consists of goal definition and scoping (defining the system under consideration), inventory analysis (identifying and quantifying the consumption and release of materials), and interpretation (evaluation of the results) [ 15 ].
In general, any of recently introduced indicators can be used for LCA. For this exergoenvironmental analysis, an impact analysis method called Eco-indicator 99 [ 16 ] has been selected because it considers many environmental aspects and uses average European data.
In order to identify the raw material inlet flows, it is first necessary to perform a sizing of the plant components and to collect information about the weights, main materials, production processes, and scrap outputs of all relevant pieces of equipment needed to build the plant. This information is usually not very widely published (compared with the corresponding cost information). In this way, only rough calculations of the employed main materials and corresponding weights can be conducted.
The data collected in [
17
,
18
] were generalized in the form of equations (Tables
4
and
5
) and used for estimating the component-related environmental impact that occurs during the construction phase. If the materials of a component correspond to the data given in Table
4
, then the values of
Eco-indicator 99 values and material composition of components Equipment Construction material Eco-indicator 99 (mPoints/kg) Material composition (% CM I, CM II Steel 86 33.33 Steel low alloy 110 44.45 Cast iron 240 22.22 CL Steel 86 100 CT Concrete 3.8 91.00 PVC 280 9.00 CC Steel 86 33.34 Steel high alloy 910 66.66 EX I, EX II, EX III Steel 86 25.00 Steel high alloy 910 75.00 HE I, HE II Steel 86 25.00 Steel low alloy 110 75.00 CM III Steel 86 33.33 Steel low alloy 110 44.45 Cast iron 240 22.22 P Steel 86 35.00 Cast iron 240 65.00 Environmental impact functions of components for the construction phase Component Environmental impact function, (Pts of Eco-indicator 99) Variables CM 1, CM 2, CM 3 CL Heat exchange area, CT CC EX I, EX II, EX III HE I, HE II Tubes of SLA Casing of steel Heat exchange area, PTable 4
Table 5
For the LCA of the system being analyzed, we assumed in analogy with the economic analysis a life time of 15 years and 7,300 working hours per year at full capacity.
The exergoenvironmental model for an energy conversion system consists of
environmental impact balances
written for the
k
th component and auxiliary equations based on the P and F rules [
10
]. The environmental impact balances can be written as
or
where
To simplify the discussion, we assume in this paper that the value of
To account for
pollutant formation
within the
k
th component, a new variable was recently introduced
where only pollutant streams which will finally be emitted to the environment are taken into account: CO, CO 2 , CH 4 , N 2 O, NO x , and SO x [ 10 ].
The environmental impact of exergy destruction
To identify the most important components from the viewpoint of formation of environmental impacts, the sum of environmental impacts
The detailed exergoenvironmental model for the LNG-based cogeneration system (Figure
1
) will be presented in a future publication. In this paper, some data obtained from the conventional exergoenvironmental analysis are given in Table
6
. Here, the cooler is considered together with the cooling tower (
Exergoenvironmental variables for the LNG-based cogeneration systems Component (Pts/h) (Pts/h) (Pts/h) (Pts/h) CM I 1.254 90.718 - 91.972 8.443 CL 0.090 Dissipative component CM II 1.054 84.085 - 85.139 8.443 CC 1.200 1,128.000 1,345.320 2,474.520 3.501 EX I 4.175 180.241 - 184.416 8.218 HE I 19.732 114.450 - 134.182 8.218 CM III 1.307 185.565 - 186.871 8.880 EX II 1.953 283.449 - 285.402 9.678 HE II 6.828 31.053 - 37.881 1.643 P 1.454 1.913 - 3.367 0.114 EX III 1.043 2.650 - 3.693 0.416Table 6
Advanced exergy-based analyses
The real potential for improving the system from a thermodynamic, economic, and environmental impact point of view can be estimated when the following are split into avoidable/unavoidable parts [ 17 , 21 – 23 ]:
· exergy destruction within each (important) system component,
· investment cost and environmental impact associated with such component, and
· cost of exergy destruction and environmental impact associated with the exergy destruction for each (important) system component.
The
unavoidable
exergy destruction cannot be further reduced due to technological limitations such as availability and cost of materials and manufacturing methods. The difference between total and unavoidable exergy destruction for a component is the
avoidable
exergy destruction. Only this value and not the total exergy destruction should be considered during the improvement procedure.
The unavoidable investment cost (
The value of the unavoidable exergy destruction within the
k
th component is calculated using the ratio
The values of unavoidable capital investment cost and component-related environmental impact can be calculated using similar equations:
The approaches for estimating the values of
Selected data obtained from the advanced exergy-based analyses for the LNG regasification system are given in Table
7
. In this paper, we assumed that components of the open gas-turbine subsystem cannot be improved because this subsystem represents an already commercially available unit.
Selected data obtained from the advanced exergy-based analyses Component (MW) (MW) ($/MJ) ($/h) ($/h) ($/h) ($/h) ($/h) (Pts/h) (Pts/h) (Pts/h) (Pts/h) (Pts/h) HE I 0.0451 1.492 (39%) 2.342 (61%) 0.231 7.66 (48%) 8.38 (52%) 269 422 430 (61%) 0.3290 10.879 (55%) 8.835 (45%) 44.140 70.309 79.144 (58%) CM III 0.0593 3.037 (52%) 2.762 (48%) 0.098 5.03 (31%) 11.20 (69%) 1,574 1,433 1,444 (48%) 0.0063 0.323 (25%) 0.984 (75%) 97.087 88.478 89.462 (48%) EX II 0.0511 3.722 (46%) 4.405 (54%) 0.114 8.29 (40%) 12.20 (60%) 1,901 2,232 2,244 (54%) 0.0059 0.433 (23%) 1.520 (77%) 129.677 153.772 155.292 (54%) HE II 0.0973 1.404 (27%) 3.891 (73%) 0.469 6.77 (49%) 6.99 (51%) 244 676 623 (73%) 0.0740 1.071 (16%) 5.757 (84%) 8.304 22.748 28.505 (75%) P 0.0874 2.498 (44%) 3.125 (56%) 0.082 2.33 (33%) 3.35 (67%) 342 441 444 (56%) 0.0155 0.444 (30%) 1.010 (70%) 0.842 1.071 2.081 (62%) EX III 0.0913 0.865 (49%) 0.905 (51%) 0.126 1.20 (45%) 1.45 (55%) 211 221 222 (51%) 0.0240 0.228 (22%) 0.815 (78%) 1.298 1.351 2.166 (59%)Table 7