Revision of Fuzzified Fine-Kinney Method, an Adaptive Method for Natural Disaster Risk Management
Abstract
Natural disasters are rather unpredictable and can interrupt human life, cause economic damage and even take lives. Even though they are mostly unpredictable, there are methods for assessing the risks of natural disasters, one of which is the Fine-Kinney, which was originally used for assessing industrial accident risks. Even though the method has been applied to natural disasters, the results are not very rational and precise because of the dissimilarity between both phenomena. Here we adapt the Fine-Kinney method by fuzzification to produce fast and reliable results in the building environment for natural disasters, even in situations where there is limited data. Both standard and fuzzy Fine-Kinney methods are applied to the MustafakemalpaÅa district in Bursa, Turkey, as a case study. The results of this case study are compared with the risk maps provided by the local government, to prove the accuracy and reliability of the method. While both methods produced similar and reliable results when compared to the risk maps, the Fuzzy Fine-Kinney results were more realistic because of the nature of fuzzy logic.
Â
Introduction
Turkey is vulnerable to multiple natural disasters because of its geological location. There are three major faults in Turkey, the Northern Anatolian Fault, the Western Anatolian Fault, and the Eastern Anatolian Fault. Because these faults are seismically very active and affect quite a large area, making 42% of Turkey a first-degree earthquake zone and 24% second-degree (TürkoÄlu 2001). Turkey is also surrounded by the Mediterranean Sea, Black Sea, and Marmara Sea while hosting lots of streams and basins and having high rainfall in some regions, and therefore being vulnerable to floods. Turkey is also vulnerable to landslides, avalanches, and forest fires. Even though the vulnerability to these natural disasters except earthquakes is more area-specific, their impacts generally overlap with earthquake zones making a considerable amount of Turkey liable to multiple hazards.
Â
Governments prepare risk maps (AFAD 2021), uniform non-governmental organizations (AFAD, T.C. İç Ä°Åleri BakanlıÄı Afet Ve Acil Durum Yönetimi BaÅkanlıÄı), and manage disasters through policies, funds, and insurance (DASK, DoÄal Afet Sigortaları Kurumu). They also set regulations as a precaution (Resmi Gazete 2007 as cited in DEPREM BÃLGELERÄ°NDE YAPILACAK BÄ°NALAR HAKKINDA YÃNETMELÄ°K ). Municipalities apply every policy determined by governments and carry out local activities (Nilüfer Ä°lçe Afet ve Acil Durum Yönetim Merkezi) to prevent disaster losses.
Â
For some countries, even though they have plans and precautions for natural disaster situations, these may not be sufficient to prevent disaster losses. The purpose of the present research is to modify a risk-assessment method called âFine-Kinneyâ which is used for industrial accidents. The main goal of the modification is to make the method applicable, easy to use, and reliable in natural disaster risk assessment for architects and civil engineers. The Fine-Kinney method is a risk assessment tool that needs very basic data to evaluate the risk level. By taking Fine-Kinney as a base and keeping its advantages, this method will be favorable not only for regions that have insufficient or no data on natural disasters but also for local and rural buildings, which may be constructed in the future.
Â
In this research, the default version of Fine-Kinney is reviewed through each parameter in turn. It turns out that the frequency parameter of the default Fine-Kinney prevents results from being accurate when the method is applied to natural disasters. To solve this problem, the frequency parameter is adapted for natural disasters, taking a buildingâs industrial lifespan as a baseline for creating a new frequency parameter with new multipliers. To evaluate the methodâs reliability and accuracy in natural disaster environments, an adapted version of Fine-Kinney was tested, along with its âfuzzyâ version, which is created in MATLAB, a proprietary multi-paradigm programming language and numeric computing environment developed by MathWorks.
Â
For the test, we assess the vulnerability against multiple disasters (avalanches, rockfall, landslide, earthquake, flood) in Karaköy Village in the MustafakemalpaÅa District (Bursa, Turkey). To evaluate frequency, severity, and probability parameters and to see the clarity of the results, we used risk maps and disaster records provided by the Disaster and Emergency Management Presidency (Aka. AFAD, a governmental disaster management agency operating under the Turkish Ministry of Interior). After comparison, it is shown that both methods produce results similar to the risk maps, but because the fuzzy results are more soft-edged compared to the standard Fine-Kinney, the Fuzzy Fine-Kinney results can be considered more applicable.
Â
Literature Review
Researchers have used several methods to assess risks and vulnerability in different situations, including natural disasters (Du & Lin 2012). There are methods based on risk uncertainty, which include probability and statistics (Deng et al. 2001), the fuzzy mathematical method, which was introduced to natural disaster risk analysis by Huang et al. (2018), the gray system method, which is useful for minor data and poor information, used in meteorological disaster risk analysis by Gong & Forrest (2014), and the comentropy method, which is a way of describing âuncertaintyâ for information sources, was adapted to soil erosion and natural disasters by Ai (1987).
Â
The literature also includes methods based on risk disadvantage. Qualitative risk analysis is a method where experience and theoretical knowledge are used. This method was first used for disaster risk and vulnerability by Eldeen (1980). GIS (geographic information system) is a series of computer-spatial analysis tools that can analyze information to create map data, and these methods were used in the risk analysis of geological disasters by Zhu et al. (2002). Modeling is another effective method for quantifying disaster risk (Peduzzi et al. 2009). Analysis methods are based on risk future, and they consider future hazard effects too. Risk characterization is a method that presents disaster risk results in the form of risk mapping or risk curves or risk index construction (Ma 2015). Ensemble forecast technology is based on weather forecasting and was used to forecast water-based disasters by Deng et al. (2006). Scenario analysis is a method that was first used in the military, and it tries to predict the future by finding and analyzing possible scenarios. Ranger et al. (2010) evaluated future flood risk for Mumbai with this method.
Â
Some of these methodologies have been improved with the help of fuzzy logic systems (PamuÄar et al. 2016), while some research has relied solely on fuzzy logic to assess risk (Karimi & Hüllermeier 2007).
Â
Few studies adapted the Fine-Kinney risk assessment method for natural disasters (Derse 2021; IÅık et al. 2022), which was originally a method for assessing industrial accidents. Some research has applied fuzzy logic on Fine-Kinney for dam risks (Daneshvar Rouyendegh & Gür 2020), which include several natural disasters.
Â
When these methods are implemented in an environment at the scale of a building, settlement, or region for a natural disaster, however, the frequency parameter starts to cause inaccuracy in results. For example, in Daneshvar  Rouyendegh & Gürâs (2020) method, the lowest multiplier of the frequency parameter is 0.5, corresponding to âvery sparseâ and is defined as âonce in a yearâ. Defining the lowest multiplier as âonce in a yearâ can cause problems because earthquakes occur at multiple magnitudes and severities. Even though bigger and more destructive earthquakes usually happen less than once a year in a region, âbig and destructiveâ or âmajorâ is a very broad definition of an earthquake. All earthquakes at a Richter scale value of 5 or higher can be considered major. But if two earthquakes with a Richter scale of 5 and 8 respectively are multiplied with the same frequency multiplier, their risk scores can come out close and this can provide a false sense of security. Derse (2021) found that the least frequent multiplier is defined as âvery rareâ and âyearlyâ. However, because evaluations are not limited to a region, the quantity and frequency of natural disaster is greatly increased.  Derse (2021) showed that the size of the measured area can vastly change the reliability of the frequency scale. For example, while there have been only 34 earthquakes with a magnitude higher than 6 in the last 600 years in the Marmara Region (AFAD 2021), an average of 128 earthquakes occur around the world each year with a magnitude higher than 6. Â
Â
For these reasons and the lack of research on the adaptation of the Fuzzy Fine-Kinney method to a pure building-oriented environment for natural disasters in a building, settlement, or region scale, the need for a new method was established.
Â
Method
Fine-Kinney is a quantitative risk assessment method that is derived from a safety system (Department of Defense Standard Practıce) whose purpose is to minimize and eliminate hazards in the work field. This method was developed by Wiruth and Kinney (1976). In this method, each hazard is associated with three parameters (likelihood, exposure, and possible consequences), and the âRisk Scoreâ is calculated by multiplying these three parameters (Kokangül et al. 2017) (Kinney & Wiruth 1976).
Â
Equation of risk score in Fine-Kinney
âRisk Score = Possibility x Frequency x Severityâ
According to the risk score, the risk is evaluated at five levels. These are acceptable risk, possible risk, substantial risk, high risk, and very high risk. Acceptable risk demands no action, possible risk needs to be taken into account and must be corrected in the long term, substantial risk needs correction in the mid-term, high risk needs to be corrected as soon as possible, and very high risk demands the stoppage of the process until the correction is made (Oturakçı 2017).
Â
Probability: In the original study by Kinney and Wiruth (1976), the probability scale includes ten divisions, and âmight well be expectedâ which is used for events that happened before and can reoccur in the future, taken as a reference point and given the value of 10. âOnly remotely possibleâ is given the value of 1 and âvirtually impossibleâ is given the value of 0.1. The scale is completed with intermediate values given depending on experience, as displayed in Table 1.
Â
Frequency: Kinney and Wiruth (1976) used a scale of ten for frequency, and the reference points are 1 to 10. In the scale, risks are rated by their occurrence frequency. The value â10â is given to events that happened on an hourly basis and are considered âcontinuousâ. The reference point â1â is given to events that happen a few times per year and are considered ârareâ. Intermediate values are given according to experience (Table 2).
 Â
Severity: Severity is evaluated based on casualties and the damage they cause in dollars ($). The scale (Table 3) sets the loss of life and property against a scale of 100. The endpoints are âcatastropheâ with a value of â100â and ânoticeableâ with a value of â1â.
Â
Risk Score: When these three parameters are multiplied, the risk score is determined (Table 4).
Â
Problems with Fine-Kinney: When the Fine-Kinney method is applied to natural disasters without any changes, several errors can be expected. The probability parameter is rather qualitative and can be evaluated with common knowledge when it comes to natural disasters. Severity requires only a minor change: economic damage depends on the scale of the environmental impact of the disaster, but not every disaster loss is calculated as âtangible damageâ in developing or underdeveloped countries. Environmental impact is a scale that is far easier to measure than cost and can be made in the field. The parameter frequency is where a major error occurs because natural disasters are unpredictable, and their frequency is very different from industrial accidents. For example, if we take a destructive earthquake as an example, which happens once every few years or more often, its frequency multiplier will be 0.5. These earthquakes can generate a disaster and are quite possible, which makes their severity and possibility score 40 and 10 respectively. This makes a total risk score of 120 (40 x 0.5 x 6 = 120) which means they are a substantial risk and will be very inaccurate. Destructive earthquakes can easily be high risk and can go as far as a very high risk depending on conditions. Depending on the result of these calculations, a revision of the frequency scale becomes mandatory. In the frequency scale, a buildingâs rough lifespan, assumed to be 50 years, is taken as a reference point, and given the value of â1,â which means a building will definitely face a disaster with a frequency value of â1â. Another reference point set for value â10â is âmore than once in a yearâ to evaluate frequent hazards like earthquakes. Therefore, intermediate values are given to generate a revised scale (Tables 5, 6).
Â
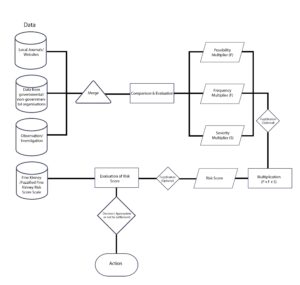
Fuzzy Fine-Kinney: To prevent uncertainties in the evaluation of parameters, frequency, possibility, and severity multipliers are converted to fuzzy numbers and a new set of rules has been set. As shown in Figure 1, frequency, severity, and possibility are set as input, while risk is set as output. Here, we use the Mamdani inference process method and is coded in MATLAB, a proprietary multi-paradigm programming language and numeric computing environment developed by MathWorks, Fuzzy Logic Designer (Gul & Celik 2018).
Â
Figure 1. Flowchart of the method.
Â
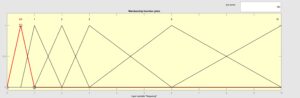
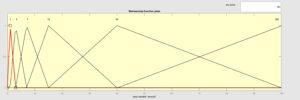
The membership functions of probability, frequency, and severity are given in Tables 7, 8, and 9 respectively. When determining this membership function, adjacent values of each value have been used. For example, in the fuzzification process of âOnce in 25 yearsâ, âOnce in 50 yearsâ and âOnce in a decadeâ values are added, and the membership function is set as (1,2,3). Fuzzification values are given in Tables 7â10.

Â
Figure 2. Fuzzy fine-kinney design.
Â
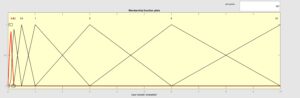
Figure 3. Fuzzy diagram of Probability.
Â
Figure 4. Fuzzy diagram of frequency.
Â
Figure 5. Fuzzy diagram of severity.
Â
Every memberâs membership function is a domain starting with the value of the member below and ending with the value of the member above (Figs. 2â5; Tables 7â10). The first memberâs domain starts with its value and the last memberâs domain ends with its own because they have no other member below and above respectively.
Â
In this study, both Adapted Fuzzy Fine Kinney and Adapted Fine Kinney methods are applied to Karaköy Village in MustafakemalpaÅa/Bursa district. Bursa is one of the most developed cities in Turkey. Bursa is very important for Turkey both economically and historically, being one of the biggest industrial cities of Turkey and the first capital of the Ottoman Empire. These assets make Bursa suitable for the case study.
Â
Results for both methods are evaluated individually and comparatively, to see if they are reliable for natural disaster risk assessment. The reasons behind choosing Karaköy Village for this case study were the exposure of Karaköy to multiple natural disasters and the existence of casualty and date data of five disasters provided by AFAD, a national organization in Turkey that carries out the necessary studies for the effective management of disaster and emergency processes while ensuring coordination between relevant institutions and organizations and to producing policies in this field. Locations of MustafakemalpaÅa, Karaköy and Bursa are shown in Figure 6.
Â
Â
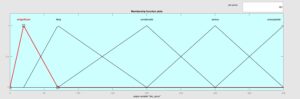
Figure 6. Fuzzy diagram of risk score
Â
Â
To make the analysis more specific and pinpoint the results, Karaköy quarter in MustafakemalpaÅa was selected. The reason for choosing this quarter is because Karaköy has been exposed to several landslides in recent years and it caused disturbed daily life and damaged many buildings in the region, which makes these landslides a disaster. Its geolocation makes Karaköy vulnerable to earthquakes which makes it a multihazard area. Even though the region is not vulnerable to all of them, all five disasters (avalanche, rockfall, landslide, earthquake, and flood) risk scores will be evaluated for authentication of the method. After risk scores are calculated they will be compared to risk maps produced by AFAD.
Â
Avalanche: There isnât any snow mass to cause an avalanche at any time of year near the Karaköy. That makes the probability of an avalanche disaster next to impossible which is equal to a multiplier of â0.1â. There are no records of avalanches in Karaköy which makes frequency âmore than once in a centuryâ with a multiplier of â0.5â. Because there is no significant snow mass, even if an avalanche occurs, it will hardly cause any damage. And that makes the severity âbarely miss, no environmental impactâ with a score of â1â.
Â
Flood: As with avalanches, no flood disasters happened at Karaköy in recent history. So, we can use the same multipliers we used for avalanches.
Â
Rockfall: As seen in Table 11, there is only one rockfall event recorded in M. KemalpaÅa which was not in Karaköy. And this means the same multipliers as avalanches can be used again. In both rockfall and flood situations, possibility and severity can be changed depending on conditions. However, if there is no drastic change in either parameter, as the multipliers for other parameters are at a minimum, the Risk Score will still be very low.
Â
Landslide: Even though it was stated only once in AFADâs records, according to local journals (Milliyet 2015, Ensonhaber 2015, and Dostmedya n.d 2015 ), Karaköy seems to be exposed to landslides quite often because of groundwater under the soil and it disturbs local peopleâs daily life while damaging several buildings. This turns these landslides into disasters. Groundwater under the soil means that landslides in Karaköy can be considered âQuite possible.â This makes the possibility multiplier â6â. Local journals state that Karaköy was exposed to landslides in winter multiple times. This makes the frequency âmore than once in a yearâ with a multiplier of â10â.  Disturbing daily life and damaging buildings to the extent that making them âunusableâ can be considered as âconsiderable environmental impactâ and that makes the severity multiplier â15â.
Â
Earthquake: When it comes to earthquakes, they have a wide variation in frequency, possibility, and severity, and they cannot be specified for districts because of their very wide effect range. Considering these facts, only significant earthquakes in Marmaraâs history (>Magnitude 6) have been evaluated. Recorded seismic activities which have a magnitude greater than 6 in Anatoliaâs history since the 15th century are shown in Table 13. There were 34 major earthquakes in Marmaraâs 600-year history, which can be considered as âquite possibleâ with a multiplier of â6â. If we divide 34 earthquakes by 600 years, the outcome is 17.6 which is closest to the term âonce in 25 yearsâ. This makes the frequency multiplier â2â. Earthquakes bigger than Magnitude 6 often result in disasters in Turkey. That makes severity âdisasterâ with a multiplier of â40â.
Â
Results
The results from MustafakemalpaÅaâs risk analysis show that both methods produce quite reliable and accurate results when compared with risk maps (Tables 14, 15).
Â
Discussion
According to the results of both methods, MustafakemalpaÅa is vulnerable to earthquakes and landslides but with virtually no risk against rockfall, flood, and avalanche. When results are superimposed on risk maps, both results seem to be very accurate. However, the difference between the two methods can be seen in their maximum and minimum values. With the standard Fine-Kinney method, landslides and earthquakes possess such a high threat that stoppage of other actions is recommended. The Fuzzy Fine-Kinney method identifies these disasters as high risk, so they still need immediate precautions but daily life does not need to be suspended. For avalanches, rockfalls, and floods, according to the standard Fine-Kinney, they possess practically no threat and therefore require no precaution. However, when parameters are fuzzified, these disasters are identified as not associated with substantial threat but should be considered nonetheless.
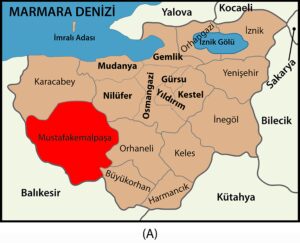
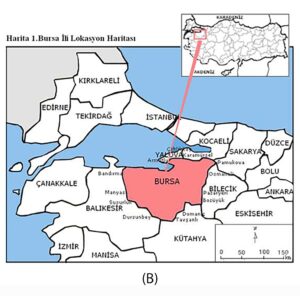

Figure 7. Locations: A) MustafakemalpaÅa (Turkiyebilgi n.d.). B) Bursa (Pekel S 2010). C) Karaköy (highlighted with red, reteived from Turkiyebiligi).
Â
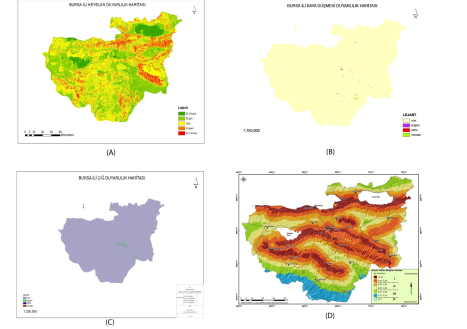
Figure 8. Risk maps. A) Bursa Landslide Risk Map (AFAD n.d.), Green-Low Risk, Red-High Risk. B) Bursa Rockfall Risk Map (AFAD n.d.), Yellow-Low Risk, Green-High Risk. C) Bursa Avalanche Risk Map (AFAD n.d.), Purple-Low Risk, Red-High Risk. D) Bursa Earthquake Risk Map (AFAD n.d.), Blue-Low Risk, Brown-High Risk (Afet Haritaları.2023).
Â
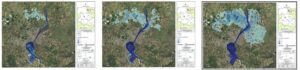
Figure 9. MustafakemalpaÅa Flood Risk Map (AFAD n.d.), Light Blue-Low Risk, Dark Blue-High Risk
Â
Â
The standard Fine-Kinney has sharper edges than the Fuzzy Fine-Kinney when it comes to very low and very high risks (Figs. 7, 8; Table 16). However, âtaking precautions without disturbing daily lifeâ and âit should be on consideration even though the risk is very lowâ can be considered more rational and safe than âsuspending daily life to take measuresâ and âno need to take any precautionâ in disaster situations.
It is important to note that, when using these methods, extreme results should be evaluated by architects and civil engineers. For example, in a region that is exposed to earthquakes, if the risk score is very high, this does not mean that there should not be any settling at all in the region. The very high-risk score should be interpreted as âIf there are any existing buildings which are at very high risk, precautions should be taken in that manner, and if there will be a new settlement in the area, the earthquake must be one of the biggest considerations in the design process.â. This highlights the need to recall that this method is only an evaluation tool for the assessment of the risks of natural disasters, and with the results of the method, civil engineersâ/architectsâ knowledge, scientific facts, and local regulations must be taken into consideration too. For example, in a tropical climate, even if the fuzzy risk score is 30 for an avalanche, which is the result of minimum parameters, even though the method recommends considering the disaster, taking precautions for an avalanche in a zone where there is no snow will be a waste of both money and time.
 Conclusion
We aimed to produce a fast and reliable natural disaster risk-assessment method for underdeveloped and developing countries that could produce rather precise results even with limited data. For this reason, the severity parameterâs economic loss aspect has been replaced with the environmental damage scale. Another problem was the drastic gap between the periods of recurrence of industrial accidents and natural disasters. To adapt the frequency parameter to natural disasters, âonce in 50 yearsâ has been taken as a reference point because a buildingâs life span is considered as roughly 50 years. Another decision was to fuzzify the parameters, which allowed us to set our inputs not as definitive numbers but as a range and compensate for the unpredictability and diversity of natural disasters.
Â
The new method made results less sharp but more accurate. While landslides and earthquakes are âvery high riskâ in Standard Fine-Kinney they become âhigh riskâ in Fuzzy Fine-Kinney which means their risk score decreased, while avalanche, flood, and rockfalls risk scores increased and they became âpossible risksâ. This means in the Standard Fine-Kinney avalanche, rockfall, and flood risks were so insignificant that they will probably be ignored, and earthquakes and landslides had such a risk score that they required stoppage of current activity. In the Fuzzy Fine-Kinney model, on the other hand, avalanches, rockfalls and floods can be ignored, and earthquakes and landslides are still high risks but there is no need to stop any events. When the two methodsâ results are compared with the risk maps of the region, they both produce accurate results, but the Fuzzy Fine-Kinney results are more rational and reliable.
Â
Conflict of Interest
The authors declare that they have no competing interests. The view expressed in this short paper does not necessarily reflect those of their institutions
Â
Tables
Â
Table 1. Fine-Kinney Probability Scale.
Probability | Multiplier |
                      *Might well be expected | 10 |
Quite possible | 6 |
                      Unusual but possible | 3 |
*Only remotely possible | 1 |
Conceivable but very unlikely | 0.5 |
Practically impossible | 0.2 |
*Virtually impossible | 0.1 |
Â
Â
Â
Table 2. Fine-Kinney Frequency Scale.
Probability | Multiplier |
*Hourly (Continuous) | 10 |
Frequent (Daily) | 6 |
Occasional (Weekly) | 3 |
Unusual (Monthly)Â Â Â Â Â | 2 |
*Rare (a few per year) | 1 |
Very rare (yearly) | 0,5 |
Â
Â
Â
Table 3. Fine-Kinney Severity Scale.
Severity | Multiplier |
*Catastrophe (many fatalities or >$107 damage) | 100 |
Disaster (few fatalities, or >$106 damage) | 40 |
Very serious (fatality, or >$105 damage) | 15 |
Serious (serious injury, or>$104 damage) | 7 |
Important (disability, or >$103 damage) | 3 |
*Noticeable (minor first aid accident, or >$100 damage) | 1 |
Table 4. Fine-Kinney Risk Score Scale.
Risk Score | State of Risk |
R<20             | Risk; perhaps acceptable  |
20<R<70 | Possible risk; attention indicated |
70<R<200Â Â Â Â | Substantial risk; correction needed |
200<R<400Â Â Â Â Â Â Â Â | High risk; immediate correction required |
R>400 | Very high risk; discontinuing operation |
Â
Â
Â
Table 5. Revised Fine-Kinney Severity Scale.
Severity | Multiplier |
Catastrophe (many fatalities, or complete environmental destruction) | 100 |
Disaster (few fatalities, or critical environmental impact) | 40 |
Very serious (fatality, or considerable environmental impact) | 15 |
Serious (serious injury, or wide environmental impact) | 7 |
Important (disability, or environmental impact) | 3 |
Noticeable (minor accident, or very small/no environmental impact) | 1 |
Â
Â
Â
Table 6. Revised Fine-Kinney Frequency Scale.
Frequency | Multiplier |
*More than once a year | 10 |
Once a year | 6 |
Once in a decade | 3 |
Once in 25 years | 2 |
*Once in 50 years | 1 |
Once in a century | 0,5 |
Â
Table 7. Fuzzy Fine-Kinney Probability Scale.
Probability | Multiplier | Fuzzy Membership Function |
*Might well be expected | 10 | (6, 10, 10) Â |
Quite possible | 6 | (3, 6, 10) |
Unusual but possible  | 3 | (1, 3, 6) |
*Only remotely possible | 1 | (0.5, 1, 3) Â |
Conceivable but very unlikely | 0,5 | (0.2, 0.5, 1) Â |
Practically impossible | 0,2 | (0.1, 0.2, 0.5) Â |
*Virtually impossible | 0,1 | (0, 0.1, 0.2) |
Â
Â
Â
Table 8. Fuzzy Fine-Kinney Frequency Scale.
Frequency | Multiplier | Fuzzy Membership Function |
*More than once in a year | 10 | (6, 10, 10) Â |
Once in a year | 6 | (6, 10, 10) Â |
Once in a decade | 3 | (2, 3, 6) Â |
Once in 25 years | 2 | (1, 2, 3) Â |
*Once in 50 years | 1 | (0.5, 1, 2) Â |
Once in a century | 0,5 | (0, 0.5, 1) |
Â
Â
Â
Table 9. Fuzzy Fine-Kinney Severity Scale.
Severity | Multiplier | Fuzzy Membership Function |
Catastrophe    | 100 | (40, 100, 100)  |
Disaster | 40 | (15, 40, 100) Â |
Very serious   | 15 | (7, 15 , 40)  |
Serious | 7 | (3, 7, 15) |
Important | 3 | (1, 3, 7) |
Noticeable | 1 | (0,1, 3) |
Â
Â
Â
Table 10. Fuzzy Fine-Kinney Risk Score Scale.
Risk Score | State of Risk | Fuzzy Membership Function |
R<20 | Risk; perhaps acceptable       | (0,20,70) |
20<R<70 | Possible risk; attention indicated | (20,70,200) |
70<R<200 | Substantial risk; correction needed | Â Â Â Â Â Â Â Â Â Â Â (70,200,300) |
200<R<400Â Â Â Â | High risk; immediate correction required | Â Â Â Â Â Â Â Â Â Â Â (200, 300, 400) |
R>400 | Very high risk; consider discontinuing operation | (300, 400, 400) |
Â
Â
Table 11. AFADâs rockfall event records for Bursa (AFAD, 2021).
District | Report Date | Disaster Type | Buildings Affected | Year |
Gürsu | 10.09.2009 | Rockfall | 4 | 2009 |
Osmangazi | 10.09.1997 | RF+ Landslide | - | 1997 |
Osmangazi | 3.02.1995 | Rockfall | 20 | 1995 |
Osmangazi | 19.07.2017 | RF+ Landslide | 1 | 2017 |
Ä°znik | 6.06.2000 | RF+ Landslide | 3 | 2000 |
Orhaneli | 5.09.1990 | Rockfall | 3 | 1990 |
Ä°znik | 29.07.1987 | RF+ Landslide | - | 1987 |
Osmangazi | 21.11.1980 | Rockfall | 7 | 1980 |
Kestel | 15.12.2003 | Rockfall | - | 2003 |
M. KemalpaÅa | 16.06.2020 | Rockfall | 1 | 2020 |
Ä°znik | 17.06.2020 | Rockfall | 4 | 2020 |
Yıldırım | 24.04.2012 | Rockfall | - | 2012 |
Kestel | 28.08.2020 | Rockfall | - | 2020 |
Â
Â
Table 12. AFADâs Landslide records for M. KemalpaÅa (AFAD, 2021).
District | Village/Quarter | Report Date | Disaster Type | Buildings Affected | Year |
M. KemalpaÅa | KeltaÅ | 30.11.1968 | Landslide | 5 | 1968 |
M. KemalpaÅa | KeltaÅ | 6.12.1984 | Landslide | 6 | 1984 |
M. KemalpaÅa | Yukarıbali | 27.04.1983 | Landslide | - | 1983 |
M. KemalpaÅa | Güvem | 12.06.2015 | Landslide | 1 | 2015 |
M. KemalpaÅa | Karaköy | 1.06.2016 | Landslide | 29 | 2016 |
Â
Â
Table 13. AFADâs record for major earthquakes in the Marmara region (AFAD, 2021).
Date | Time | Latitude(0) | Longitude (0) | Magnitude | Fault Length (km) |
15.03.1419 | 00:00 | 40.40 | 29.30 | 7.2 | Â |
10.09.1509 | 22:00 | 40.90 | 28.70 | 7.2 | 74 |
10.05.1556 | 00:00 | 40.30 | 27.80 | 7.2 | 66 |
25.05.1719 | 12:00 | 40.70 | 29.80 | 7.4 | 102 |
06.03.1737 | 07:30 | 40.10 | 27.30 | 7 | 49 |
02.09.1754 | 03:30 | 40.80 | 29.20 | 6.8 | 36 |
22.05.1766 | 05:00 | 40.80 | 29.00 | 7.1 | 58 |
05.08.1766 | 05:30 | 40.50 | 26.60 | 7.4 | 90 |
07.02.1809 | 00:00 | 40.00 | 27.00 | 6.1 | Â |
08.02.1826 | 20:30 | 39.80 | 26.40 | 6.2 | Â |
06.10.1841 | 02:30 | 40.85 | 29.50 | 6.1 | Â |
19.04.1850 | 23:30 | 40.10 | 28.30 | 6.1 | Â |
28.02.1855 | 02:30 | 40.10 | 28.60 | 7.1 | 59 |
11.04.1855 | 19:40 | 40.20 | 28.90 | 6.3 | Â |
21.08.1859 | 11:30 | 40.30 | 26.30 | 6.8 | 34 |
22.08.1860 | 10:09 | 40.50 | 26.00 | 6.1 | Â |
09.02.1893 | 17:16 | 40.50 | 26.20 | 6.9 | 41 |
10.07.1894 | 12:24 | 40.70 | 29.60 | 7.3 | 80 |
9.08.1912 | 01:28 | 40.70 | 27.20 | 7.3 | 84 |
10.08.1912 | 09:23 | 40.80 | 27.50 | 6.2 | Â |
13.09.1912 | 23:31 | 40.70 | 27.00 | 6.8 | 37 |
4.01.1935 | 14:41 | 40.50 | 27.60 | 6.4 | Â |
4.01.1935 | 16:20 | 40.55 | 27.75 | 6.3 | Â |
20.07.1943 | 15:32 | 40.68 | 30.48 | 6.4 | Â |
6.10.1944 | 02:34 | 39.70 | 26.50 | 6.8 | Â |
18.03.1953 | 19:06 | 40.00 | 27.40 | 7.1 | 55 |
20.02.1956 | 20:31 | 39.84 | 30.41 | 6.2 | Â |
26.05.1957 | 06:33 | 40.60 | 31.00 | 7.2 | 66 |
18.09.1963 | 16:58 | 40.70 | 28.95 | 6.4 | Â |
6.10.1964 | 14:31 | 40.10 | 28.20 | 6.8 | 35 |
22.07.1967 | 16:57 | 40.70 | 30.70 | 7.2 | 71 |
27.03.1975 | 05:15 | 40.45 | 26.20 | 6.5 | Â |
5.07.1983 | 12:01 | 40.28 | 27.76 | 6.1 | Â |
17.08.1999 | 00:01 | 40.70 | 30.00 | 7.4 | 98 |
Â
Â
Â
Table 14. Fine Kinney Risk Scores.
Disaster | Possibility | Frequency | Severity | Risk Score | Evaluation |
Avalanche | 0.1 | 0.5 | 1 | 0.05 | Acceptable risk  |
Flood  | 0.1 | 0.5 | 1 | 0.05 | Acceptable risk  |
Rockfall | 0.1 | 0.5 | 1 | 0.05 | Acceptable risk  |
Landslide | 6 | 10 | 15 | 900 | Very high risk |
Earthquake | 6 | 2 | 40 | 480 | Very high risk |
Â
Â
Â
Table 15. Fuzzy Fine Kinney Risk Scores.
Disaster | Possibility | Frequency | Severity | Risk Score | Evaluation |
Avalanche | 0.1 | 0.5 | 1 | 30 | Possible risk |
Flood  | 0.1 | 0.5 | 1 | 30 | Possible risk |
Rockfall | 0.1 | 0.5 | 1 | 30 | Possible risk |
Landslide | 6 | 10 | 15 | 368 | Â high risk |
Earthquake | 6 | 2 | 40 | 368 | high risk |
Â
Â
Table 16. Comparison among Risk Maps and Risk Scores of Fuzzy and Standard Fine-Kinney.
                                  Disaster | Fine-Kinney | Fuzzy Fine-Kinney | Risk Map |
Avalanche | Acceptable | Possible Risk | No Risk |
Flood | Acceptable | Possible Risk | No Risk (Karaköy) |
Rockfall | Acceptable | Possible Risk | No Risk |
Landslide | Very High Risk | High Risk | High risk  |
Earthquake | Very High Risk | High Risk | High risk  |
Â
Â
Â
Â
Â
Â
Â
Â
References
AFAD Bursa Ä°l Afet ve Acil Durum MüdürlüÄü Ä°l Afet Risk Azaltma Planı (IRAP) (2021) Retrieved March 2, 2023, from https://bursa.afad.gov.tr/kurumlar/bursa.afad/Bursa-IRAP.pdf
 Afet Haritaları. (âRisk Mapâ in English) (n.d.). Retrieved February 5, 2023, from https://www.afad.gov.tr/afet-haritalari
Ai NS (1987). Comentropy in erosional drainage-system. Journal of Soil and Water Conservation. 1(2): 1â7.
 Bursa. (n.d.) Retrieved February 10, 2023 from http://turkiyebilgi.byethost8.com/mahalle_yerlesim/marmara/bursa/bursa.htm?i=1
 Daneshvar Rouyendegh B & Gür L (2020). Bulanık FineâKinney Yöntemiyle risk DeÄerlendirmesi Uygulaması. Journal of Industrial Engineering (Turkish Chamber of Mechanical Engineers). 31(1): 75â86.
 Deng G, Chen, HL, Zhou YS (2006). Application of ensemble forecast technique to rainstorm risk analysis. Ziran Zaihai Xuebao/ Journal of Natural Disasters. 15(1): 115â122.
 Deng G, Wang AS, Li SK, Zhou YS (2001). Risk theory and method and its initial application in grain yield. Journal of Natural Resources. 16(3): 221â226. https://doi.org/10.11849/zrzyxb.2001.03.005
 Deprem Bölgelerinde Yapilacak Binalar Hakkinda Yönetmelik. (2007, March 6) Resmi Gazete, 1-159.
 Derse O (2021). A new approach to the Fine Kinney method with AHP-based ELECTRE I and math model on risk assessment for natural disasters. Journal of Geography. 42: 155â164. https://doi.org/10.26650/JGEOG2021â875427
 Du X, Lin X (2012). Conceptual model on regional natural disaster risk assessment. Procedia Engineering. 45: 96â100. https://doi.org/10.1016/j.proeng.2012.08.127
 Eldeen MT (1980). Predisaster physical planning: Integration of disaster risk analysis into physical planning: A case study in Tunisia. Disasters. 4(2): 211â222.
https://doi.org/10.1111/j.1467â7717.1980.tb00274.x
 Gong Z & Forrest JYL (2014). Special issue on meteorological disaster risk analysis and assessment: on basis of grey systems theory. Natural Hazards. 71(2): 995â1000. https://doi.org/10.1007/s11069â013â0864ây
 Gul M, Celik E (2018). Fuzzy rule-based FineâKinney risk assessment approach for rail transportation systems. Human and Ecological Risk Assessment: An International Journal. 24(7): 1786-1812.
 Heyelan bir köyü yok ediyor. (2015, April 13). ensonhaber. https://www.ensonhaber.com/emlak/heyelan-bir-koyu-yok-ediyor-2015-04-13
Huang CF, Liu XL, Zhou GX, Li XJ (1998). Agricultural natural disaster risk assessment method according to the historic disaster data. Journal of Natural Disasters. 7(2): 1â9.
Â
IRIS (2011). How Often Do Earthquakes Occur? Education and Outreach Series No. 3 https://www.iris.edu/hq/inclass/fact-sheet/how_often_do_earthquakes_occur
 IÅık E, Aydın B, Yunus LE, Mehmet CA (2022). Determination of rockfall risk using FineâKinney methodology for Bitlis downtown area, eastern Türkiye. Disaster Science and Engineering. 8(2): 1â17. https://dergipark.org.tr/en/pub/dse/issue/74703/1129764
 Karaköyâde heyelan korkusu. (n.d.) (2015). Dostmedya. https://www.dostmedya.com/karakoyde-heyelan-korkusu
 Karimi I , Hüllermeier E (2007). Risk assessment system of natural hazards: A new approach based on fuzzy probability. Fuzzy Sets and Systems. 158(9): 987â999. https://doi.org/10.1016/j.fss.2006.12.013
  Kinney GF,Wiruth AD (1976). Practical risk analysis for safety management. Naval Weapons Center China Lake CA. https://apps.dtic.mil/sti/pdfs/ADA027189.pdf
 Kokangül A, Polat U, DaÄsuyu C (2017). A new approximation for risk assessment using the AHP and Fine Kinney methodologies. Safety Science. 91:24â32. https://doi.org/10.1016/j.ssci.2016.07.015
Â
Ma BC (2015). Definition and expression methods for natural disaster risk. Journal of Catastrophology. 30(3): 16â20.
Â
MIL-STD-882E, Department of Defense Standard Practice: System safety (2012, May 11). EverySpec. http://everyspec.com/MIL-STD/MIL-STD-0800-0899/MIL-STD-882E_41682/#:~:text=-MAY-2012)-,MIL-STD-882E%2C%20DEPARTMENT%20OF%20DEFENSE%20STANDARD%20PRACTICE%3A,those%20hazards%20cannot%20be%20eliminated. Retrieved February 10, 2023Â
Â
Nilüfer İlçe Afet ve Acil Durum Yönetim Merkezi. (n.d.). Retrieved February 5, 2023, from https://www.nilufer.bel.tr/kategoriler/tesisler/idari-binalar/nilufer-ilce-afet-ve-acil-durum-yonetim-merkeziN12BR
 Oturakçı M, DaÄsuyu C (2017). Risk DeÄerlendirmesinde Bulanık FineâKinney Yöntemi ve Uygulaması. Karaelmas Journal of Occupational Health and Safety. 17â25. https://web.archive.org/web/20200310022619id_/https://dergipark.org.tr/tr/download/articleâfile/395102
(Ãzel Haber) Heyelan bir köyü yok ediyor. (2015, April 13). Milliyet. https://www.milliyet.com.tr/yerel-haberler/bursa/ozel-haber-heyelan-bir-koyu-yok-ediyor-10725663
Â
PamuÄar DS, BožaniÄ D, Komazec N (2017). Risk assessment of natural disasters using fuzzy logic system of type 2. Management: Journal of Sustainable Business and Management Solutions in Emerging Economies. 21(80): 23â34.https://doi.org/10.7595/management.fon.2016.0016
 Peduzzi P, Dao H, Herold C, Mouton F (2009). Assessing global exposure and vulnerability towards natural hazards: the Disaster Risk Index. Natural Hazards and Earth System Sciences. 9(4): 1149â1159. https://doi.org/10.5194/nhessâ9â1149â2009
 Pekel S (2010). Bursa Metropol Ä°lçelerindeki Köy YerleÅmelerinin KasabalaÅma Süreci. Dissertation, Sakarya University.
 Ranger N, Hallegatte S, Bhattacharya S, Bachu M, Priya S, Dhore K, Rafique F, Mathur P, Naville N, Henriet F, Herweijer C, Pohit S, CorfeeâMorlot J (2010). An assessment of the potential impact of climate change on flood risk in Mumbai. Climatic Change. 104(1): 139â167. https://doi.org/10.1007/s10584â010â9979â2
 TürkoÄlu N (2001). Türkiyeânin yüzölçümü ve nüfusunun deprem bölgelerine daÄılıÅı. Ankara Ãniversitesi Türkiye CoÄrafyası AraÅtırma ve Uygulama Merkezi Dergisi. 8:133â148. http://tucaum.ankara.edu.tr/wpâcontent/uploads/sites/280/2015/08/tucaum8_7.pdf Â
 Zhu L, Yin K, Zhang L, Li M (2002). Risk Analysis System Of GeoâHazards By Using GIS Technique. Journal Of Engıneering Geology. 10(4): 428â433.Â
Â
Â
Â