Cave Geomechanical Index (CGI). Classification and Contribution to the Conservation of Natural Caves in the Iron Mines
- Iuri Viana Brandi 1
- Marcelo Barbosa 1
- Airton Barata 1
- Rafael De Paula 1
- Tomas Correa 1
- Hernani Lima 2
- Robert Osborne 3
Abstract
Cave geotechnical studies have been the key to meeting the requirements of Brazilian environmental legislation for the conservation of speleological heritage in mining areas. This paper presents a methodology that classifies iron caves according to their susceptibility to structural instability called the Cave Geomechanical Index (CGI). This index combines four variables: (1) Rock Mass Rating (RMR), Bieniawskiâ s geomechanical variable, which classifies the quality of the rock mass hosting the cave; (2) Hydraulic Radius (HR), an engineering variable that allows the dimension of the span to be evaluated; (3) Ceiling Shape (CS), a speleological variable that indicates whether the ceiling geometry of the cave spans is favorable or unfavorable for block formation, and (4) Ceiling Thickness (CT), a geotechnical variable that represents the depth between the ceiling of the cave and the surface of the ground regarding auto-support issues. The CGI was developed, applied and calibrated over four years, by monitoring 63 spans from 27 caves adjacent to active iron ore mines in Carajás, Pará state, Brazil, that had been authorized to be eliminated. This geomechanical classification system proved to be easy to implement and its results showed that 76% of the spans with breakdown occurrences in the caves were classified as high or very high susceptibility to structural instability, while 94% of the spans classified as low susceptibility did not show any signs of physical damage. The CGI is discussed with the focus on improving stability studies, predictability of cave breakdown mechanisms and geotechnical risk analysis of iron caves near mining operations.Introduction
In Brazil, natural underground caves are protected by federal environmental legislation and several technical-scientific studies are required in the environmental licensing processes that regulate the preservation of Brazilian speleological heritage. Caves abound in iron formation terrains so in recent years researchers have intensified a balance between iron mining production and issues of cave protection.
Â
Most of the iron caves in Brazil are found in two large ferruginous geosystems: the Iron Quadrangle region of Minas Gerais State, southeastern Brazil, and the Carajás ridge, of Pará State, in northern Brazil (Valentim & Olivito 2011). Currently, the National Speleological Database of the federal environmental agency, Chico Mendes Institute of Biodiversity (ICMBio), has about 4,300 iron caves registered, most of which are located in the Carajás ridge of Pará State. This is due to a greater effort of cave prospecting in areas where iron ore extraction is higher, demonstrating the strong link between the evolution of speleological knowledge and the iron ore mining industry.
Â
Federal Decree 6.640/08 required that caves must be classified according to 11 physical, biological, ecological, and/or historical-cultural attributes, to establish their level of significance (importance for the speleological ecosystem). About these attributes, scientific studies are carried out to advance the knowledge on each of the themes allowing the correlation and the precise classification of the significance. In the archaeological context, extremely important in the recovery of the ancient history of past populations, all sites are duly rescued for Brazilian museums.
Â
The mentioned Decree also regulates the different ways to license cave impacts, depending on their level of significance, or requiring studies that guarantee that any anthropic actions will not compromise the physical integrity of the caves (Brasil 2008).
Â
During these often long-term studies within the licensing issues, another regulation, CONAMA 347, still requires that a buffer zone of 250 m should be protected around each cave (MMA 2004). In the context of mineral industry, this regulation directly interferes with mining operations, blocking large areas with the substantial amount of mineral reserves, which may lead to the stopping of mines and/or making the mine design more complex increasing production costs.
Â
Therefore, it is important and urgent for the mining companies to understand the geomechanical mechanisms for the structural stability of caves in mining regions, which will allow greater security for the operations and leading confidence for the environmental agencies that may speed up the licensing of the areas.
Â
This paper introduces the Cave Geomechanical Index (CGI), a novel system for classifying the susceptibility of iron cave spans to structural instability. This index was based, conceptually, on the Bieniawski (1989) rock mass geomechanical quality rating (RMR) system, but is focused exclusively on natural iron caves, considering other essential variables for stability analysis.
Â
A simplified development flow of the main activities for the development of CGI is shown in Fig. 1.
 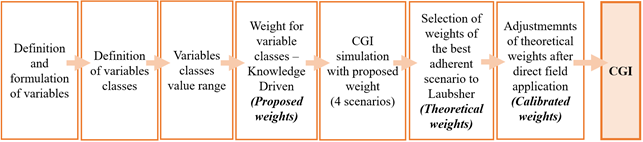
Figure 1. Simplified development flow of the main activities of the Cave Geomechanical Index (CGI).
Â
The CGI was applied to 63 spans of 27 strategically selected caves, being the most representative in speleological terms and the closest to the mining areas. They occurred near the N4 and N5 mines in Carajás ridge which were used for development, adjustments and calibrations of the index between 2015 and 2018.
Â
Iron Caves
Iron caves are poorly studied when compared with caves in carbonate rocks or other types of terrain. Generally, iron caves are shallow with thin ceilings (20 m average), with their development coincident with the slope of the overlying land surface. The spans of iron caves are small (20 m length à 10 m width average), and irregular in shape, with structural control and discontinuities observed on their walls and ceilings (Piló & Auler 2009; Piló et al. 2015). White & White (1969) and White (2012) reported that due to the natural evolution of caves and the breakdown along discontinuities, it is common to observe fragments and blocks of rocky material on the cave floors.
Â
The genesis of iron caves is attributed to four main processes of generation of empty spaces in rock masses: erosion, leaching, dissolution, and biogenesis (Simmons 1963; Vann 1963; Moss 1965; Â Morris 1985; Pinheiro & Maurity 1988; Buchmann et al. 2009; Calux 2013; Dutra 2013). Studies of these processes are keys to understanding the geotechnical issues and stability analysis of this type of cave.
Â
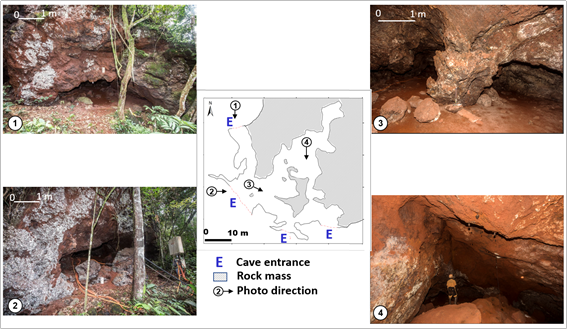
As an example, Fig. 2 shows the topographic map and photos of cave N4E_0026, one of the studied caves.
Â
Figure 2. Photos of cave N4E_0026 (one of the studied caves).
Â
Geotechnics Applied to Speleology
The vast majority of cave stability studies reported in the literature have been undertaken in carbonate terrains (Waltham 2002; Parise & Trisciuzzi 2007; Hatzor et al. 2010; Szunyogh 2010; Gutiérrez et al. 2014; Parise et al. 2015; Jordá-Bordehore et al. 2016, 2017; Andriani & Parise 2017; Fiore et al. 2018). Carter and Miller (1995) observed that in carbonate rocks there is some relationship between ceiling width and cave stability. Criteria based on RMR (Bieniawski 1989) have also been used in the geotechnical mapping of these areas (Siegel & McCrackin 2001).
Some ideas about structural instability from carbonate caves however can be transferred to the iron caves environment, leading to recent studies aiming to predict irreversible negative impacts on speleological heritage on mining sites (Sánchez 2007; Brandi 2015a, b; Araújo et al. 2016; Renó 2016; Valentim 2016; Dutra 2017; Lacerda 2017; Santos Junior 2017; Novas et al. 2017, Brandi 2019a).
Â
Also regarding the ferriferous cave environment, Renó (2016) developed a cave zoning system to support geotechnical studies. Using this approach, the geotechnical analysis of the spans of some iron caves was undertaken based on traditional geomechanical classification systems adapted to caves. In line with this research, the works of Araújo et al.(2016) and Valentim & Olivito (2016) corroborated the evolution of the geotechnical theme applied to speleology in iron caves from, respectively, the survey of geomechanical parameters with a 3D laser scanner, and the proposed classification of a cave through the method of geomechanical classification of rock masses adapted to caves. Dutra (2017) evaluated the geotechnical susceptibility of two iron caves in the Serra do Gandarela region by mapping parameters as geomechanical classification of the rock mass, structural discontinuities, ceiling thickness, water input points (drips, speleothems, basins), sediment cones, root incidence and characterizing the rainfall and water infiltration into the caves.
Â
Study Area
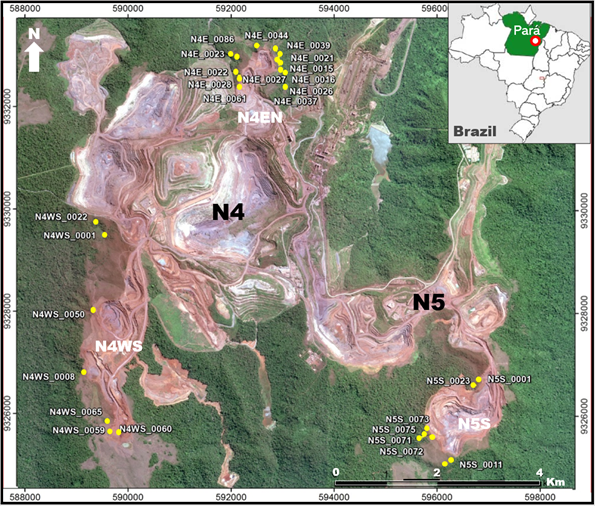
The study area is located at the N4 and N5 iron mines in Carajás ridge southeastern of Pará State. The selection of the caves took into account their physical representativeness of the Mineral Province of Carajás as horizontal projection (from 5 to 200 m) and volume (from 5 to 1000 m³), and their proximity to active mining areas (Mines N4EN, N4WS and N5S). Twenty seven caves were selected which have been monitored over 4 years between 2015 and 2018 (Fig. 3).
Â
Figure 3. Study area at the iron mines N4EN, N4WS and N5S in the Carajás ridge, Pará State. Note the location of the 27 caves (yellow bullets) selected for this study and their proximity to the mine operations (Worldview image (2019); UTM coordinates).
Â
Table 1 shows the level of significance, lithology and morphometric data of the 27 caves of this study.
Â
Table 1. Level of significance, lithology and speleometry data of the 27 caves of the study (BIFÂ =Â Banded Iron Formation, Canga = Ferruginous Crust).
Cave | Level of Significance | Lithology | Plan Lenght (m) | Vertical Range (m) | Area (m²) | Volume (m³) |
N4E_0015 | High | BIF and Canga | 65 | 6 | 253 | 547 |
N4E_0016 | High | BIF | 30 | 3.2 | 113 | 114 |
N4E_0021 | High | BIF | 41 | 6.6 | 164 | 330 |
N4E_0022 | Maximum | BIF and Canga | 175 | 12.4 | 1082 | 750 |
N4E_0023 | Maximum | BIF and Canga | 65 | 5.6 | 274 | 222 |
N4E_0026 | High | BIF and Canga | 162 | 18 | 451 | 695 |
N4E_0027 | High | BIF and Canga | 14 | 3.5 | 24 | 29 |
N4E_0028 | High | BIF | 25 | 2.5 | 81 | 113 |
N4E_0037 | High | BIF and Canga | 11.2 | 1.2 | 19 | 18 |
N4E_0039 | High | BIF | 30.6 | 3.6 | 69 | 67 |
N4E_0044 | High | BIF and Canga | 23.1 | 1.1 | 48 | 31 |
N4E_0061 | High | BIF and Canga | 35 | 1 | 112 | 134 |
N4E_0086 | High | BIF and Canga | 15.5 | 1.7 | 32 | 37 |
N4WS_0001 | High | BIF | 13 | 4.4 | 64 | 68 |
N4WS_0008 | High | BIF and Canga | 79 | 9.2 | 445 | 876 |
N4WS_0022 | High | BIF | 10.5 | 2.9 | 31 | 91 |
N4WS_0050/51 | High | BIF and Canga | 20.5 | 4.8 | 178 | 207 |
N4WS_0059 | High | BIF and Canga | 16 | 3.2 | 52 | 67 |
N4WS_0060 | High | BIF | 12.5 | 1.7 | 15 | 8 |
N4WS_0065 | High | BIF | 13.5 | 1.8 | 15 | 12 |
N5S_0001 | High | BIF and Canga | 16 | 3 | 31 | 40 |
N5S_0011 | High | BIF and Canga | 104 | 11 | 471 | 898 |
N5S_0023 | High | BIF | 26.5 | 2.9 | 32 | 19 |
N5S_0071 | High | BIF and Canga | 8.3 | 1.6 | 17 | 19 |
N5S_0072 | High | BIF and Canga | 25 | 2 | 71 | 82 |
N5S_0073 | High | BIF, Mafic and Canga | 20 | 0.6 | 43 | 28 |
N5S_0075 | High | BIF and Canga | 32 | 3 | 76 | 59 |
Â
Geology
The geology of the area is characterized by iron deposits distributed along a structure known as the syncline or Carajás fold, which is grouped into sets called Serra Norte, Serra Sul, Serra Leste, and São Félix. More specifically, the caves considered in this study are developed in iron lithologies of the Carajás Formation, which is part of a Carajás Domainâs greenstone belt.
Â
The stratigraphic unit includes Precambrian banded iron formation (BIF) of oxide facies with jaspilites (Lateritic Cover and Carajás Fm) interdigitated by moderately to severely deformed metabasalt and acid metavolcanic packages (Parauapebas Fm), metavolcanic sedimentary rocks into green to amphibolite sub-schist facies (Igarapé Pojuca Fm), and domain of metasedimentary rocks (Ãguas Claras Fm), complementing with the Proterozoic granites (Pojuca, Igarapé Gelado and Central), (Justo & Lopes 2014) (Fig. 4).
Â
Â
Â
Figure 4. Regional geology of the mineral province of Carajás with the approximate location of study caves (adapted from Dardenne and Schobbenhaus, (2001)).
Â
The high iron content of Carajás Formation lithologies enables the formation of ferruginous crust commonly called âcangaâ. This Cenozoic deposit occurs in a residual form when formed in situ by the leaching of jaspilite chert bands or other minerals/constituents of other rich ferruginous rocks; or settles in detrital form when the source rock (rich in iron) is disaggregated, transported, and subsequently cemented. These deposits are up to 20 m thick and regularly hard, and provide excellent support for underground cave spans.
Â
Cave Geomechanical Index (CGI)
The development of indexes that evaluate the geohazard impacts are not new for carbonate karst environments. Van Beynen & Townsend (2005) initially proposed the "Karst Disturbance Index", later revised by North et al. (2009). Beynen et al. (2012) created a more widely index called "Karst Sustainability Index" the standardizing metric of sustainable development practices in karst settings that takes into account 25 indicators related to the environment, economy, and society. A high-level review was also provided in Gutiérrez et al. (2014) reviewing the main natural and human-induced hazards and their indexes characteristic of carbonate karst environments, focusing on sinkholes, floods and slope movements. It was quite relevant this latter work highlighting 17 main causes of degradation and a classification for their effects, raising 3 of them related to engineering and mining operations.
Â
The differences and peculiarities between caves in carbonate karst and ferruginous karst environments do not allow the direct use of all the results and tools produced for the carbonate environments, although many of the studies in limestone caves, especially those dealing with structural stability, have been used and cited for the present study.
 The Cave Geomechanical Index (CGI) is a geomechanical classification system specifically for iron ore caves near mining areas that are required to have their physical integrity preserved accordingly to current Brazilian legislation.
Â
Definition of formula and variables
The CGI development model was inspired by Bieniawskiâs (1989) geomechanical classification methodology, with the sum of weighted variable classes according to ranges or interval of analysis and whose result indicated the geomechanical quality of the evaluated material. The variables selected for the CGI and its classes cover several disciplines and were based on the experience and knowledge of the authors in geostructural mapping and monitoring since 2014 in caves located near active mining areas in Carajás, Pará State and in the Iron Quadrangle region, Minas Gerais State, both in Brazil, as well as based on the scientific literature. Three recent articles are representative of this gain of experience in monitoring iron caves in near mine operations: Barbosa (2018), Barbosa et al. (2019) and Brandi (2019b). Â
Â
Four variables were considered: (1) Rock Mass Rating (RMR), from Bieniawski (1989), a geomechanical variable that classifies the quality of the rock mass in which each cave is hosted; (2) Hydraulic Radius (HR), an engineering variable that considers the ratio between the area and the perimeter of a typical section of a span; (3) Ceiling Shape (CS), a variable that indicates whether the cave ceiling geometry is favorable or unfavorable to form blocks; and (4) Ceiling Thickness (CT), a geotechnical variable that characterizes the depth of the cave span ceiling  concerning the ground surface.
Â
The system is governed by an equation that considers the sum of weighted variable classes which leads to a classification of the geomechanical quality of the cavesâ spams, measuring their susceptibility to structural instability.
Â
The variables RMR, HR and CT (quantitative), and CS (qualitative), induce different effects on the classification of the CGI, depending on the combination of these variables in its equation. Each one contributes to different impacts on the results and so on its classification. The higher the RMR and CT values, each of them contributes to a better classification of the GGI, taking the classification to very low susceptibility to structural instability. About HR, the opposite is true, the higher its value, it will contribute to a worse classification of the CGI, leading to very high susceptibility to structural instability. Regarding CS, the CGI classification gets worse or improve according to the type of ceiling shape, more or less unstable.
The CGI formula is demonstrated in Equation 1:
Â
CGI= α RMR + β HR + γ CS + δ CT                Equation 1
Where:
α RMR = Weight assigned to Rock Mass Rating (Bieniawski, 1989)
β HR = Weight assigned to the Hydraulic Radius (Laubscher, 1990)
γ CS = Weight assigned to Ceiling Shape
δ CT = Weight assigned to Ceiling Thickness
Â
The sum of the weights of the 4 variables was defined as the maximum value 100 (one hundred), which represents the best scenario of the very low susceptibility to structural instability, whereas, on the other hand, the worst scenario is the minimum value 0 (zero), indicating very high susceptibility to structural instability. Table 2 shows the five CGI classes and their respective levels of susceptibility to structural instability of the spans.
Â
Table 2. Five CGI classes and their respective levels of susceptibility to structural instability of the spans
Susceptibility to Structural Instability of Cave Span | CGI |
Very Low | CGI > 80 |
Low | 60 < CGI < 80 |
Moderate | 40 < CGI < 60 |
High | 20 < CGI < 40 |
Very High | CGI < 20 |
Â
Variable classes
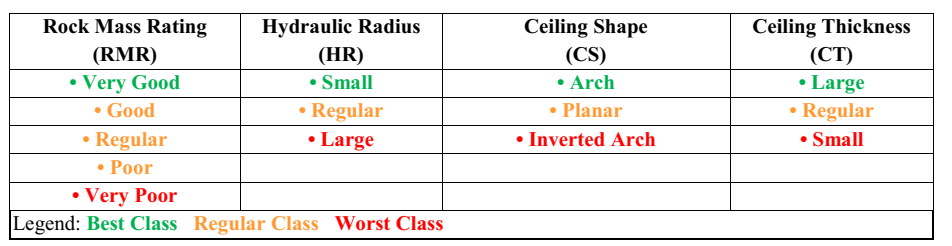
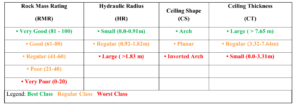
Based on the acquired knowledge, mainly in the field observation of the caves immediately after the detonations, it was possible to recognize and propose the best and worst classes for each variable according to Table 3, which will be described in this chapter, always exemplifying its relations with cave N4E_0026, one of the 27 studied caves.
Â
Table 3. CGI variable classes
Rock Mass Rating (RMR)
Since the 1940s, several authors have designed geomechanical indexes to predict the behavior of rock masses, particularly when exposed to anthropic actions such as mining and tunneling (Edelbro 2006).
Â
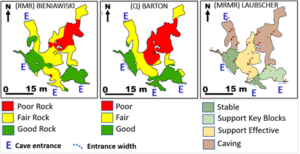
For the composition of the CGI, 3 traditional systems were considered for their approaches to mass quality and application in underground environments, as is the case of the shallow iron caves of the study area. Bartonâs Q (1974), Bieniawskiâs RMR (1989) and Laubscherâs MRMR Systems (1990) were tested. The tests were performed in the 27 study caves, making a correlation with the geostructural field mapping. The results were very similar, but the Bieniawski RMR System was perceived as the most adherent (De Paula et al. 2018), and the one that provided better geomechanical contact details to compose the CGI.
Fig. 5 shows an example of the mapping result in the 3 systems for cave N4E_0026.
Â
Figure 5. Geomechanical classification maps of cave N4E_0026, following Bieniawski RMR (1989), Barton Q Systems (1974) and Laubscher (1990).
Â
Bieniawski proposed the RMR system in 1973, and since then it has been refined until its last revision in 1989. It is based on the analysis of six parameters (uniaxial compressive strength of intact rock, rock quality designation, joint or discontinuity spacing, joint condition, groundwater condition and joint orientation) related to the rock mass. Each parameter is given a weight and the sum of the weights is the result of the classification system. Before being applied, the rock mass must be divided into structural sectors with similar characteristics, and the classification applies to each of these sectors.
Â
After obtaining the weight values for the parameters related to the geomechanical quality of the rock mass and the discontinuities, Bieniawski suggested performing a correction related to the orientation of the discontinuities according to their influence on the structure stability. The result of this geomechanical quality classification system of the rock mass was divided into five classes with specific intervals and was used for the composition of the CGI, as follows: Very Good (100 to 81), Good (80 to 61), Regular (60 to 41), Poor (40 to 21), and Very Poor (20 to 0), (Table 4).
Â
Table 4. Rock mass rating (RMR) from Bieniawski (1989) used in the CGI.
Sum | 100 - 81 | 80 - 61 | 60 - 41 | 40 - 21 | < 20 |
Class number | I | II | III | IV | V |
Description | Very Good | Good | Regular | Poor | Very Poor |
Â
Â
Â
Hydraulic radius (HR)
Several researchers have proposed indexes/parameters about horizontal sections when assessing the stability of underground spaces. Two main concepts were: ââSpan Widthââ, developed by Barton et al. (1974) and Hutchinson & Diederichs (1996), and ââHydraulic Radiusââ, developed by Laubscher (1990).
Â
Span width
Milne (1997) reports that the span width support condition has been employed for decades and one of the earliest records goes back to Terzaghi (1949). This method is mainly used in tunnel designs and can be effectively related to stability since the width of the opening defines the distance between the main supporting elements of a tunnel, which are the sidewalls.
Â
Hydraulic radius
Hydraulic radius has been used in the assessment of the stability of underground structures since 1977 and was first applied by D. H. Laubscher (Milne 1997). Milne points out that Hydraulic radius was initially used in fluid dynamics to compare the flow in square section tubes with flow in circular section tubes. The results explained why a parameter initially applied in hydraulics is related to the stability of underground excavations.
Â
The Hydraulic radius is obtained by the ratio between the area and the perimeter of the analyzed section. This ratio can also express the distance between the center of the underground space and the supporting structures, as well as when dealing with irregularly shaped excavations, and when the structure length is up to three times the width since this parameter considers all faces of the excavation as capable of providing effective support (Milne 1997).
Â
According to Laubscher (1990), the relationship between the hydraulic radius and the geomechanical classification index (Mining Rock Mass Rating â MRMR) was proposed for the analysis of self-portable of spans in underground mines. Based on data from 11 mines in four countries, an abacus was generated, classifying points as stable, transitional or unstable. Jordá-Bordehore (2017) evaluated the stability of 137 wide-spanned natural caves based on the empirical approach, based on Bartonâs Q system (1974), and span width, proposing a stability curve.
Â
The delimitation of the "effective span" is based on large areas (> 4 m2) with high ceilings (> 1,5 m) trying to reach the entire cave, however, some parts of the cave may not be considered due to small areas end the low height of their ceilings.
Â
For the CGI composition, this geometric variable will be included according to 3 classes (Small, Regular and Large), which will represent their respective sizes established through statistical study in the metric unit.
Â
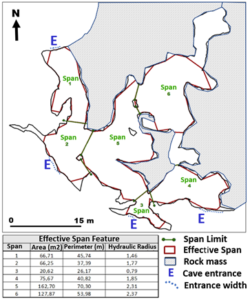
A map was prepared for each of the 27 studied caves with the division of spans considered in the calculation of the respective hydraulic radius. As an example, a span map of cave N4E_0026 is shown in Fig. 6.
Â
 Â
Â
Figure 6. Hydraulic radius (HR) map of cave N4E_0026. Note that each cave span is identified with a sequential number.
Â
Ceiling Shape (CS)
Peck et al. (2013) stated that the shape of the ceiling is a key factor in assessing the stability of underground excavation, along with the geological characteristics and general condition of the ground. Peck et al. (2013) compared the performance of straight (flat) and arched (arch) shapes in shallow excavations, concluding that areas of instability are usually associated with flat geometries and that stable ceiling shapes are similar to the post-rupture configuration -i.e. arches. Parise and Lollino (2011) evaluated the geological failure mechanisms in an abandoned calcarenite mine and recorded the results of the collapse, noting that the failure points have arched shapes. Diederichs & Kaiser (1999) suggested that discontinuities and intersections reduce the rock's ability to form a stable arch, extending the unstable zone. Similarly, Fiore et al. (2018) evaluated the collapse susceptibility of underground calcarenite mines in Italy and recognized that ceiling geometry was an important factor, being the inverted arch the worst scenario.
Â
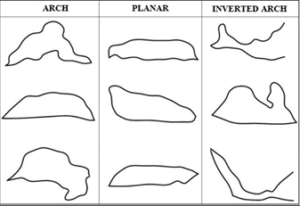
To determine the ceiling shape for the CGI, each of the 63 spans of the 27 study caves was analyzed in their ceiling shapes in 3D laser sections, confirmed by field surveys and speleometric map profiles. Three classes were considered (Arch, Planar and Inverted Arch) (Fig. 7).
Â
Figure 7. Type sections of the 3 classes of the Ceiling Shape variable, extracted from the 3D laser sections of the study caves.
Â
Ceiling thickness (CT)
Several researchers have suggested that, in the case of shallow excavations, the closer to the surface, the less stability these structures present (Carter 2014). Yardimci et al. (2016) reported an attempt to evaluate stability using the Crown Pillar method. This method establishes a relationship between geomechanical classification systems, such as RMR (Bieniawski 1989) and Q (Barton et al. 1974), and the geometry of underground spaces, considering their ceiling thickness. Carter & Miller (1995) proposed acceptable risk exposure guidelines, dividing underground mine sections into quality classes. This is a practical method that relies on back-analysis of historical failure cases. Carter (2014) developed an equation that correlates geometric factors and ceiling thickness to calculate the scaled span (Cs) factor. Thus, small ceiling thicknesses generate high Cs values, which implies instability. Parise & Lollino (2011) relate ceiling thickness to the stability of underground spaces. Fiore et al. (2018) studied shallow structures stating that ceiling thickness is fundamental for the evaluation of underground space stability.
Â
To determine the ceiling thickness for the CGI, laser scanning was used to acquire topographic data with LIDAR technology producing 3D maps (inside and outside the caves). From the point cloud, a cave ceiling elevation model was generated and subtracted from the digital terrain elevation model to obtain the ceiling thickness values.
Â
Through the point-to-point statistical analysis, it was possible to calculate the average value for ceiling thickness of each span. Fig. 8 shows the ceiling thickness map for cave N4E_0026 in a 3D model.
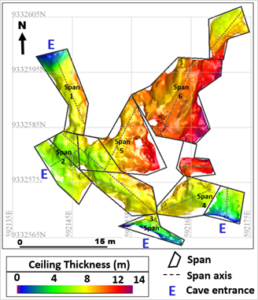
Figure 8. Ceiling thickness map for cave N4E_0026 in a 3D model.
Â
Value ranges of variable classes (statistical study)
The class value ranges of the 4 CGI variables were obtained as follows. Among the 3 quantitative variables, RMR used the Bieniawski (1989) values, and HR and CT used a statistical study developed in the MiniTab software from geostructural mappings data collected in the 63 spans of the 27 study caves (Pareto distribution diagram with cumulative relative frequency). The qualitative variable (CS) was obtained from the experience of mapping the most common ceiling shapes in the region. The qualification of the classes (best, regular, worst) is based on the experience of the technical project team since 2015 (expert opinions).
 Table 5 shows the range results for each of the 4 CGI classes.
Â
Table 5. Class value ranges for the 4 CGI variables.
Â
Table 6 shows the result of the mapping of the CGI variables in the 63 spans of the 27 study caves.
Table 6. Data collected from the 4 CGI variables for the 63 spans of the 27 study caves.
Cave | Horizontal Projection | Span | RMR | Hydraulic Radius | Ceiling Shape | Ceiling Thickness | Â |
| Â | |||||||
N4E_0015 | 65 | 1 | 50 | 1.78 | Inverted Arch | 6.62 | Â |
2 | 12 | 2.85 | Arch | 4.59 | Â | ||
N4E_0016 | 30 | 1 | 61 | 1.95 | Planar | 7.76 | Â |
2 | 62 | 1.08 | Planar | 10.51 | Â | ||
N4E_0021 | 41 | 1 | 66 | 1.52 | Planar | 6.22 | Â |
2 | 39 | 2.44 | Planar | 8.32 | Â | ||
N4E_0022 | 175 | 1 | 57 | 1.33 | Planar | 6.4 | Â |
2 | 50 | 2.52 | Planar | 6.16 | Â | ||
3 | 61 | 1.04 | Arch | 4.68 | Â | ||
4 | 37 | 2.35 | Inverted Arch | 7.97 | Â | ||
5 | 34 | 1.11 | Arch | 8.40 | Â | ||
6 | 48 | 2.42 | Inverted Arch | 5.64 | Â | ||
N4E_0023 | 65 | 1 | 44 | 2.38 | Inverted Arch | 9.71 | Â |
2 | 39 | 1.82 | Arch | 10.39 | Â | ||
N4E_0026 | 162 | 1 | 29 | 1.46 | Arch | 7.11 | Â |
2 | 42 | 1.77 | Planar | 6.54 | Â | ||
3 | 64 | 0.79 | Arch | 5.20 | Â | ||
4 | 36 | 1.85 | Planar | 6.31 | Â | ||
5 | 32 | 2.31 | Arch | 8.89 | Â | ||
6 | 25 | 2.37 | Inverted Arch | 10.67 | Â | ||
N4E 0027 | 14 | 1 | 66 | 0.90 | Planar | 4.82 | Â |
N4E 0028 | 25 | 1 | 44 | 1.54 | Inverted Arch | 3.00 | Â |
N4E 0037 | 11,2 | 1 | 78 | 0.79 | Arch | 2.70 | Â |
N4E_0039 | 30,6 | 1 | 58 | 0,62 | Arch | 4.73 | Â |
2 | 68 | 0.96 | Inverted Arch | 3.51 | Â | ||
3 | 68 | 1.40 | Arch | 3.79 | Â | ||
N4E_0044 | 23,1 | 1 | 68 | 1.26 | Inverted Arch | 2.05 | Â |
2 | 52 | 0.76 | Planar | 2.96 | Â | ||
N4E 0061 | 35 | 1 | 21 | 1.87 | Arch | 3.50 | Â |
N4E 0086 | 15,5 | 1 | 22 | 1.12 | Arch | 3.74 | Â |
N4WS 0001 | 13 | 1 | 66 | 1.65 | Inverted Arch | 6.77 | Â |
N4WS_0008 | 79 | 1 | 65 | 1.35 | Planar | 7.64 | Â |
2 | 30 | 2.60 | Arch | 8.56 | Â | ||
3 | 41 | 0.97 | Planar | 11.07 | Â | ||
4 | 30 | 2.44 | Arch | 7.64 | Â | ||
5 | 28 | 1.64 | Planar | 8.77 | Â | ||
N4WS_0022 | 10,5 | 1 | 73 | 0.66 | Planar | 2.00 | Â |
N4WS_0050/51Hydra | 20,5 | 1 | 75 | 0.92 | Planar | 2.96 | Â |
2 | 68 | 1.96 | Inverted Arch | 4.26 | Â | ||
3 | 64 | 1.09 | Planar | 5.49 | Â | ||
4 | 83 | 0.73 | Planar | 6.66 | Â | ||
5 | 64 | 0.38 | Inverted Arch | 6.93 | Â | ||
N4WS_0059 | 16 | 1 | 65 | 0.95 | Planar | 1.77 | Â |
N4WS_0060 | 12,5 | 1 | 53 | 0.81 | Planar | 1.54 | Â |
N4WS_0065 | 13,5 | 1 | 51 | 0.78 | Arch | 5.48 | Â |
N5S_0001 | 16 | 1 | 61 | 0.87 | Planar | 3.40 | Â |
2 | 71 | 0.43 | Arch | 4.33 | Â | ||
3 | 55 | 0.6 | Arch | 3.31 | Â | ||
N5S_0011 | 104 | Â | 75 | 1.15 | Planar | 2.03 | Â |
2 | 75 | 3.27 | Arch | 4.21 | Â | ||
3 | 60 | 1.2 | Arch | 7.28 | Â | ||
4 | 42 | 1.3 | Planar | 7.02 | Â | ||
5 | 59 | 0.91 | Planar | 8.17 | Â | ||
6 | 58 | 1.74 | Planar | 8.89 | Â | ||
7 | 42 | 0.86 | Planar | 9.36 | Â | ||
8 | 63 | 0.91 | Planar | 2.47 | Â | ||
N5S_0023 | 26,5 | 1 | 69 | 0.42 | Arch | 3.18 | Â |
2 | 64 | 0.5 | Planar | 3.50 | Â | ||
N5S_0071 | 8,3 | 1 | 53 | 0.92 | Arch | 0.96 | Â |
N5S_0072 | 25 | 1 | 39 | 1.69 | Inverted Arch | 2.54 | Â |
N5S_0073 | 20 | 1 | 39 | 1.28 | Planar | 2.11 | Â |
N5S_0075 | 32 | 1 | 40 | 1.45 | Planar | 3.91 | Â |
2 | 55 | 1.1 | Planar | 4.24 | Â |
Â
Weighting of Variables
Proposed weights â Knowledge Driven approach
The weights of each variable were proposed based on the experience of the team of geologists and geotechnicians who followed the geostructural mapping and monitoring project since 2015 (expert opinions), including the caves that could be monitored until their collapses. This situation is the most favorable as it allows technicians to make the closest correlations to reality between the approach of the controlled mine until the total cave collapse. This makes the proposed weight scenarios much more assertive. To choose the best distribution of the proposed weights for each CGI variable, four possible scenarios were thought out in order to allow simulations with the CGI formula and thereby check the resulting susceptibility classifications that came closest to the real situation based on field experience.
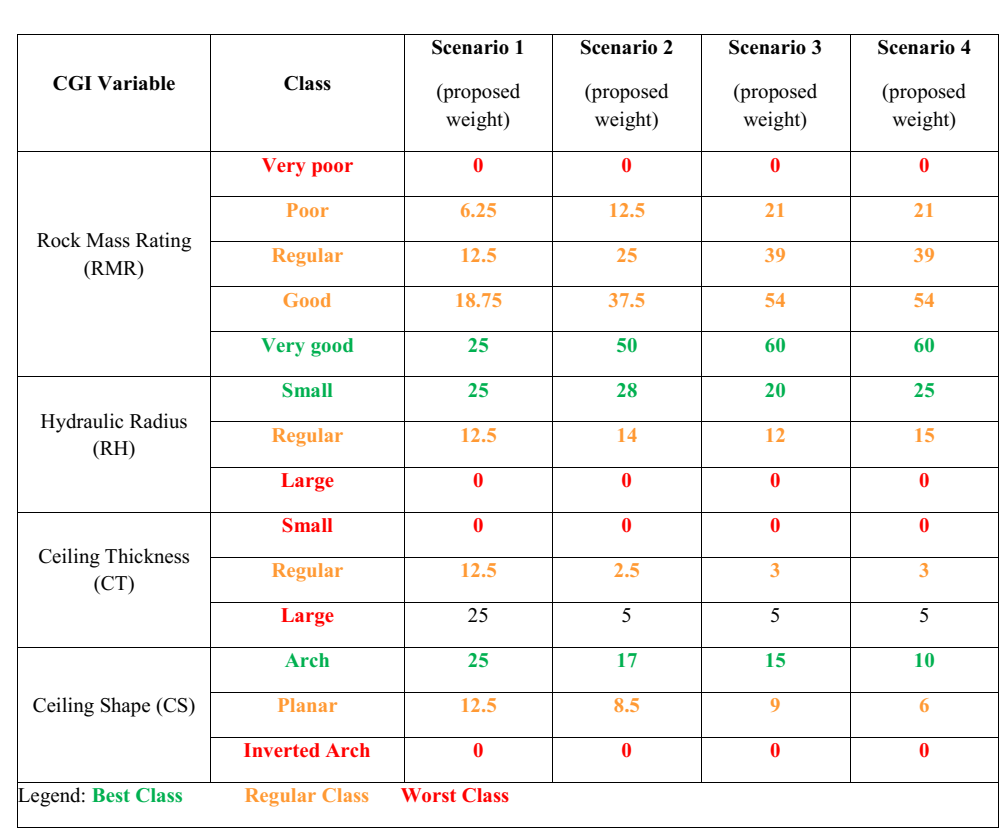
 Table 7 shows the four scenarios with the distribution of proposed weights for all classes of CGI variables for simulation.
Â
Table 7. Four scenarios with the proposed weights for simulation.

Â
An analysis of Table 7 showed that, excluding Scenario 1 of same weights for all best classes of variables, it is noted that the variable Rock Mass Rating (RMR) has a higher weight value over the other variables since it is the only one that reveals the geomechanical quality of the rock mass of the span, including the structural and hydrological features. The other CGI variables are equally important, but with lower weight values.
Â
Theoretical Weights, Â Better Adherence to Laubscherâs Stability/Instability Diagram
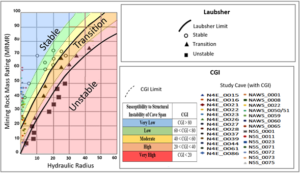
The CGI system was simulated with the proposed weights of the four scenarios for the 63 spans of the 27 study caves and the results were inserted in Laubscherâs stability/instability diagram (Laubscher 1990). This diagram is a world-renowned geomechanical tool divided into three curves of stability classifications: unstable, transition and stable, which empirically assess the stability of underground areas. This fact sought to associate the CGI with mature tools widely applied and cited in the literature.
Â
All CGI classification results inserted into the Laubscherâs diagram allowed to infer other curves resulting in five curves of instability, creating a combined diagram called âLaubscher adapted with CGIâ, with CGI ratings of spans of very high susceptibility to structural instability were within the unstable Laubscherâs zone; the spans with very high to high susceptibility CGI ratings were within the Laubscherâs transition zone, and finally the moderate, low, and very low CGI ratings of the spans were within the stable Laubscherâs zone (Fig. 9).
Â
 Figure 9. Laubscherâs stability/instability diagram adapted with CGI. Note the five curves of susceptibility to instability inferred to CGI ratings.
Â
This check of the proposed weights adherence through the Laubscherâs adapted diagram is part of the CGI development flow for the definition of the theoretical weights to be effectively used. Of the four simulated scenarios, scenario 4 was the most adherent to the adapted diagram, resulting in that of the 63 spans classified with the CGI, 29 spans, or 46%, were in the zone of the same classification when inserted into Laubscherâs diagram (Table 8).
Â
Table 8. The number of spans classified with the CGI (proposed weights) by scenarios, and their adherence to the Laubscherâs adapted diagram. Note that scenario 4 is the most adherent.
Adherence to Laubscherâs Diagram (total 63 spans) | Scenario 1 | Scenario 2 | Scenario 3 | Scenario 4 |
No. of adherent spans | 17 | 24 | 26 | 29 |
% of adherent spans | 27% | 38% | 41% | 46% |
Â
With the best adherence verified for scenario 4, these proposed weights were considered theoretical weights that will be used in the continuation of the development of the CGI. The 46% adherence between the CGI and the adapted Laubscher was considered extremely satisfactory because both have the same stability classification function and use the Bieniawski (1989) RMR index, but include other different specific and peculiar variables and, therefore, higher adherence should not be expected.
Â
Finally, Table 9 summarizes how the theoretical weights were after the analysis, aiming the next step of field application in the mapping of the 27 study caves, performing the last process in the CGI development flow to define the calibrated weights, those that will compose the official formulation of the index.
Â
Table 9. Theoretical weight values for the classes of the four CGI variables.
Calibrated Weights , Adjustment after Direct Field Application
Adjustment after direct field application is the last process of the CGI development flow when it goes for direct field application in cave mapping and span classification. The goal is to check whether the theoretical weights defined up to this stage are consistent with field reality or need to be adjusted.
Â
Mapping performed in the 63 spans of the 27 study caves showed that there was consistency in the CGI ratings for most caves, however, it was observed that in 26 spans of 17 caves, the CGI should have been stricter because structural fragility was observed, but did not reflect the index rating, that is, the ratings were better than they should be.
Â
Due to the need to increase the rigor of the CGI rating, several reductions in the weights of all classes were tested until the new classification results were more compatible with the reality of field mapping.
Â
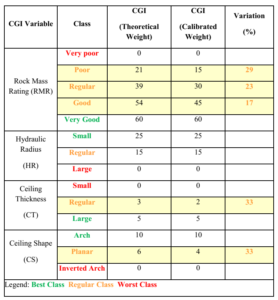
Table 10 presents the best alternative implemented for the calibrated weights, with a small reduction (between 15 to 30%) in the values of the RMR, Ceiling Thickness and Ceiling Shape variable values. The Hydraulic Radius variable did not change its weights because the tested reductions did not contribute to improvements in the final CGI rating and, therefore, this variable was not changed.
Â
Table 10. Reduction in the theoretical weight class values for the RMR, Ceiling Thickness and Ceiling Shape variables, defining the CGI calibrated weight (yellow highlighted lines). These new values are better adjusted with the mapping in the study caves.
Â
After defining the calibrated weights, all 27 caves were again mapped in the field and classified by the CGI System demonstrating greater assertiveness between the classification results and the reality. Table 11 lists the 17 caves whose initial span CGI susceptibility ratings had not been adequate, confirming the increase in the CGI rigor level, taking all ratings to a worse level than previously rated, including two really critical spans from the point of view of structural fragility mapped out from a high to very high susceptibility to structural instability rating.
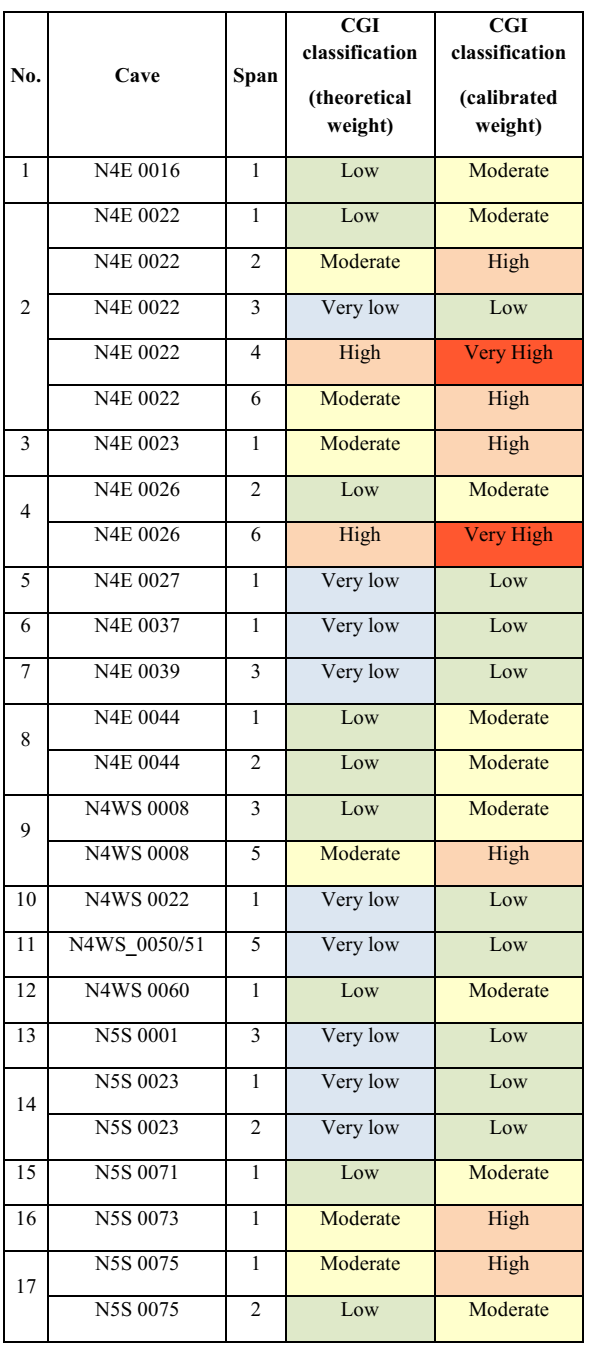
Table 11. List of the 26 spans of the 17 caves classified with theoretical weights that were not consistent with reality, and the classification with the new calibrated weights that produced a more rigorous and closer to reality result.
Â
In summary, using the calibrated definitive weights, of the 27 caves in the study, 63% increased the index sensitivity, and of the 63 spans, 41% increased their susceptibility to structural instability, better aligned with the reality observed in the field mapping (Fig. 10).
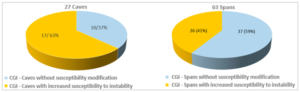
Â
Figure 10. Comparative graphs after the remap of the 27 study caves using the calibrated weights. Note that from the 27 caves, 63% had increased the rigor level, and in the 63 spans, 41% increased their susceptibility level to structural instability, more consistent with field reality.
Â
Results
Example of Application of the CGI in a Cave
Table 12 shows the CGI weights table for the class ranges of the 4 variables that are collected in the cave.
Â
Table 12. Class ranges of the 4 CGI variables with their respective weights
CGI Variable | Class | Class range | Weight |
Rock Mass Rating (RMR) | Very Poor | 0 - 20 | 0 |
Poor | 21 - 40 | 15 | |
Regular | 41 - 60 | 30 | |
Good | 61 - 80 | 45 | |
Very Good | 81 - 100 | 60 | |
Hydraulic Radius (HR) | Large | 1.83 - 3.0 m | 0 |
Regular | 0.92 - 1.82 m | 15 | |
Small | 0.00 - 0.91 m | 25 | |
Ceiling Shape (CS) | Â Inverted Arch | Â | 0 |
Planar | Â | 4 | |
Arch | Â | 10 | |
Ceiling Thickness (CT) | Small | 0.00 - 3.31m | 0 |
Regular | 3.32 - 7.64 m | 2 | |
Large | 7.65 - 10 m | 5 |
Â
A digital spreadsheet was prepared to work on tablets or cell phones, facilitating data input and automating the CGI calculations and classification during fieldwork. The study cave in this example is N4E_0022 which has 6 spans. Table 13 shows part of the spreadsheet, with the numbers in blue being the values of the classes of the 4 variables filled in during cave mapping. The respective CGI weights are automatically inserted with the numbers in red. At the end, the sum of the weights leads to the CGI classification that indicates the level of susceptibility to structural instability of the span as shown in Table 2.
Â
Table 13. Example of part of the CGI digital spreadsheet for the 6 spans of Cave N4E_0022. Note the values mapped in the field of the 4 variables (numbers in blue) and their respective weights and automatic CGI classification (numbers in red).
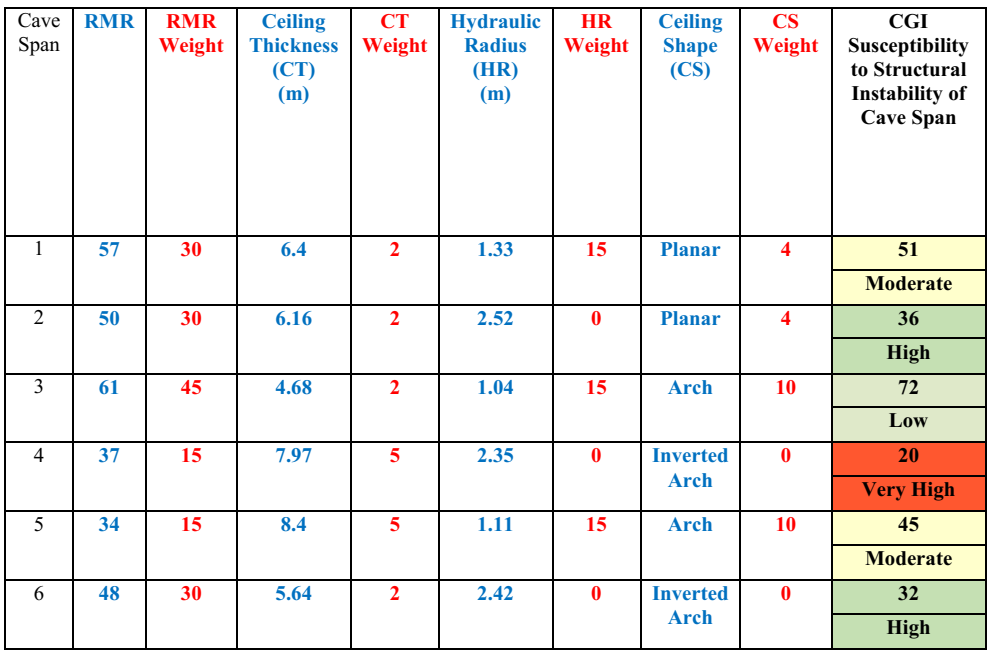
Finally, the map of the classified cave (N4E_0022) has its spans coloured with the standardized colours of Table 1 according to the CGI classification (Figure 11).
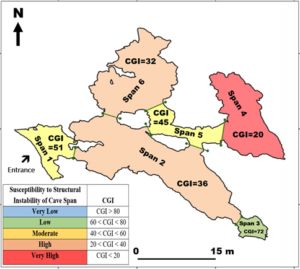
Figure 11. CGI map of the study cave N4E_0022.
Â
Accuracy rate
To measure the accuracy rate of the index, all 27 study caves with their 63 spans were classified with the CGI and had continuous field monitoring throughout the research between 2015 and 2018 during the mining operations. The field monitoring of the caves was performed by geostructural monitoring according to the cave breakdown mechanisms as described by Barbosa et al., 2019, from the first signs of damage until the total collapse when it occurred. It was planned to maintain the frequency of measurements always after mine blasting.
Â
During the mine advancement operations towards the caves, the breakdown mechanisms were recognized and quantified as physical damage. The first results are shown in Fig. 12:
- 8 caves (30%) showed no physical damage and remained stable and under monitoring;
- 11 caves (40%) had direct collapse, that is, showed no physical damage or any compromise of stability until the collapse, when operations were either very close to or above the cave;
- Â 8 caves (30%) showed physical damage, 2 of them remained stable and under monitoring and six collapsed over time with the mining approach.
Â
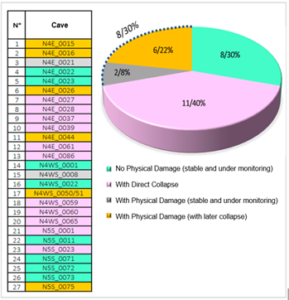
Figure 12. List of the 27 study caves and their physical damage status. Note that only 8 caves registered physical damage (2 remaining stable and 6 collapsed over time)
Â
In the analysis of the graph in Fig. 12, it is noteworthy that 11 caves (40%) collapsed without the occasional physical damage common during mine advancement, but only when blasting operations were on top of the cave, which confirms that iron caves are generally very resistant. If this amount is added to the 30% of caves that did not show any physical damage, 70% of the caves were found to be highly resistant and stable, although they had mining operations in their surroundings.
Â
To estimate the accuracy rate of the CGI, it was observed that the 11 caves with direct collapse had 16 spans and did not show any physical damage until collapse. Of this total, only 1 span had been classified as highly susceptibility to structural instability, but 15 were correctly rated as having moderate to very low susceptibility, that is, the accuracy of the index was 94%, indicating just during mapping, the low possibility of physical damage occurring in those respective spans (Fig. 13).
Â
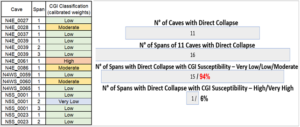
Figure 13. List of the 16 spans of the 11 caves that had direct collapse without showing physical damage, and the pyramid graph highlighting the accuracy rate of the CGI of 94%, where the spans were correctly classified with a Very Low / Low / Moderate susceptibility to structural instability.
Â
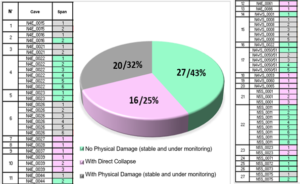
On the other hand, considering the total of 63 study spans, the results were as follows (Fig. 14):
- 27 spans (43%) showed no physical damage and remained stable during monitoring;
- 16 spans (25%) had direct collapse;
- 20 spans (32%) showed physical damage.
Â
Figure 14. List of the 63 spans and their physical damage status.
Â
To estimate the accuracy rate, the only 8 caves with physical damage have a total of 26 spans, which only 20 were effectively damaged. The amount of the physical damage reached 68 records, that is, it was 68 times that this damage occurred repeatedly inside the spans. Of this total, 76% occurred in spans correctly rated with CGI from high to very high susceptibility to structural instability, attesting to the reliability of the index (Fig. 15).
Â
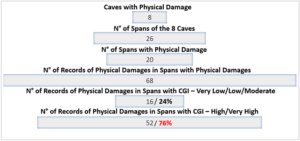
Figure 15. Graph showing that of the 68 records of physical damage monitored in 20 spans, 76% occurred in spans correctly rated with a CGI of high to very high susceptibility to structural instability.
Â
Finally, Fig. 16 shows the CGI maps with the 8 unique caves indicating physical damage from the total 27 caves in this study. The maps detail the limits of the spans and the locations where each physical damage occurred.
Â
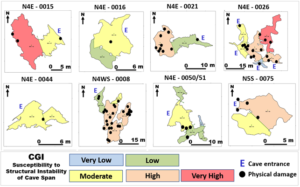
Figure 16. CGI maps of the only 8 caves that showed physical damage and their locations.
Â
Â
Conclusions
The Cave Geomechanical Index (CGI) is a classification system developed for application to stability assessment of iron caves. This index combines variables from geomechanics, engineering, speleology and geotechnics.
Â
The CGI was tested by classifying 63 spans of 27 caves near mining operations in Carajás. All test caves were systematically monitored over 4 years, between 2015 and 2018, from the first signs of damage until their total collapse.
Â
The accuracy rate of the CGI was 76% when comparing the locations of physical damage inside the spans, with their respective CGI classifications from high to very high susceptibility to structural instability. On the other hand, the accuracy rate rises to 94% for spans that were classified as moderate to very low susceptibility to structural instability and really did not show any physical damage.
Â
It is noteworthy that 11 caves (40%) collapsed without physical damage during the approach of the mining, and only failed when mining operations were on top of the cave, which confirms that iron caves are generally very resistant. If this amount is added to the 30% of caves that did not show any physical damage, 70% of the caves were found to be highly resistant and stable, although they had mining operations in their surroundings.
Â
Due to its pioneering application, focused only on iron caves, the CGI needs further trials and testing. It is possible that its variables and weights might be modified in the future. However, the first results are encouraging and motivate the authors to continue the evolution of the CGI and are already contemplating the application of the CGI to karst environments.
Â
Finally, the CGI outcomes open a path for safer mining operations close to the caves and can support mine engineering, and the use of appropriate explosive charges, allowing the sustainability of mining and compliance with legislation in the speleological preservation.
Â
Â
Acknowledgments
The authors would like to thank Vale S.A. for encouraging speleological studies allowing to make the results available and the Federal University of Ouro Preto (UFOP) for their academic and scientific support.