Ecole Normale Supérieure de l’Enseignement Technique de Sarh, Sarh, TD
Centre d’Excellence Africain en Technologie de l’Information et de la Communication, The University of Yaounde I, Yaoundé, CM
Mechanical Engineering Department, Covenant University, Ota, NG
Department of Physics, Faculty of Science, University of Ngaoundéré, Ngaoundere, CM
Department of Physics, Faculty of Science, The University of Yaounde I, Yaoundé, CM
Abstract
This paper presents an economic analysis of the electricity produced by different types of wind turbines selected for Chad. Thus, the data considered for the analysis in this study are the average monthly wind speeds at selected locations, as well as the altitude value. Statistical analysis was performed using the Weibull distribution. The same energy factor allowed determining the Weibull parameters. The results obtained show that the average annual wind speed varies from 1 m/s in Am-Timan to 4.2 m/s in N'Djamena, at a height of 10 m from the ground. Weibull statistical parameters (
k
and
c
) were determined at 10, 30, 50, and 70 m. These were obtained by extrapolation using a power law based on Weibull parameters. Three models of wind turbines available on the market were used in this study: Bonus 300 kW/33, Bonus 1 MW/54, and Vestas 2 MW/V80. The performance of these wind turbines was evaluated using the calculation of the capacity factor and the annual energy produced by each type of wind turbine at 12 sites. The PVC (present value) method was used to perform an economic analysis. The lowest cost of wind power generation was obtained with the Vestas 2 MW/V80 model, with a cost per kilowatt-hour (kWh) of approximately $143.08/kWh/year in Moundou and 132343$89/kWh/year in Am-Timan. Therefore, it is recommended the use of a Vestas 2 MW/80 wind turbine in Chad.
Introduction
The possibility of exploiting renewable energies for electricity generation has been considered by different researchers across the globe because of the negative effects of fossil fuels on the environment. Among the many clean sources of energy is wind energy which has developed very rapidly over the past 2 decades. Great technological progress has been made to reduce the cost of producing wind-generated electricity [
1
]. The turbine is free of fossil fuel energy and, hence, does not cause an environmental pollution when generating electricity [
2
]. Similarly, it can produce wind power near load centers, eliminating transmission loss in rural and urban landscape lines [
3
]. In developing countries, it is important to study and carefully understand the energy model to ensure a good standard of living and to alleviate poverty [
4
,
5
].
Speed, direction, continuity, and availability are the characteristics of the wind that can be developed to determine the wind energy potential of a site [
6
,
7
]. In many countries around the world, studies and assessments of wind characteristics and the potential of wind energy are being conducted. Countries like Hong Kong Islands have its wind analysis discussed by Lu et al. [
8
]. Youm et al. presented wind energy potential in Senegal and the analysis of wind data using the Weibull probability distribution [
9
]. Mostafaeipour et al. [
10
] evaluated wind energy resources for selected sites in Iran. Shaahid et al. [
11
] studied the economic feasibility of the development of wind power plants in coastal areas of Saudi Arabia. Dursic et al. [
12
] evaluated the wind energy source in the southern Banat region as a surbie. Statistical analyses focused on the measurement of wind parameters such as mean wind speed, power density, direction, and Weibull distribution parameters. A mathematical method of the sum of the least squares is used to analyze the vertical profile of the wind speed. Alami Els [
13
] in the Gulf of Tunis in Tunisia during their study on the potential of wind resources considered the hourly data of the wind speed and wind direction every 10 min to assess the wind potential. Worked on the evaluation of wind energy and electricity generation in the Gulf of Tunis, Tunisia. Four different methods were used to determine the Weibull parameters [
14
]. Worked on the energy balance of the first wind farm of Sidi Daoud in Tunisia. Thus, based on wind speed data measured over a 5-year period. The wind potential of the Sidi Daoud site is analyzed statistically using the Weibull and Rayleigh parameters [
15
]. Sidi Daoud [
15
,
16
], El-Kefregion [
17
], and Tunisia [
18
,
19
] in the literature have assessed the potential for wind power and electricity production in 2011 in BorjCedria [
20
]. For the long-term prediction of electrical energy consumption, they have made a study on the approach based on gene expression. To identify the most important independent variables affecting electricity demand, a sensitivity analysis was performed [
21
]. Conducted an optimization study based on NSGA-II and MOPSO for sizing a hybrid PV/wind/battery energy storage system. To determine the optimal number of PV panels and wind farm system, the optimized hybrid system was examined in MATLAB [
22
]. Worked on short-term electricity price forecasting using the hybrid backtracking algorithm and the ANFIS approach. Thus, a hybrid machine learning algorithm and a search algorithm in the learning process of the ANFIS approach have been developed to predict the price of electricity more precisely [
23
]. Conducted a study on solving the problem of sending non-convex economic load via an artificial algorithm for cooperative research. Thus, they used a method that is to interfere and work with feasible solutions throughout the optimization [
24
]. As an indication, in 2009, the population of Chad was estimated at 11,039,873 inhabitants, at a growth rate of 6% per year. As a result, current statistics estimate this population at 15,177,557. In Chad, making electricity available everywhere has always been an important socio-economic issue. However, despite the considerable efforts made by the public authorities, the population still encounters many difficulties in accessing electricity. In other words, Chad is one of the poorest-supplied countries in the Economic and Monetary Community of Central Africa (CEMAC) sub-region [
25
]: less than 5% of the population has access to electricity, mainly in the urban areas (2017), 80% of the country's consumption is in N'Djamena, load shedding is common, because the grid does not provide enough electricity; there is still no national interconnection of the network; domestic wood accounts for 90% of primary energy consumption. Since no study has been conducted to estimate the cost of a wind turbine in Chad, this work is on the determination of Weibull parameters in evaluating wind characteristics in Chad. Also, economic analysis of wind power generation considering three turbines models for the selected locations is carried out using present value cost (PVC) method.
Methodology
Presentation of Chad
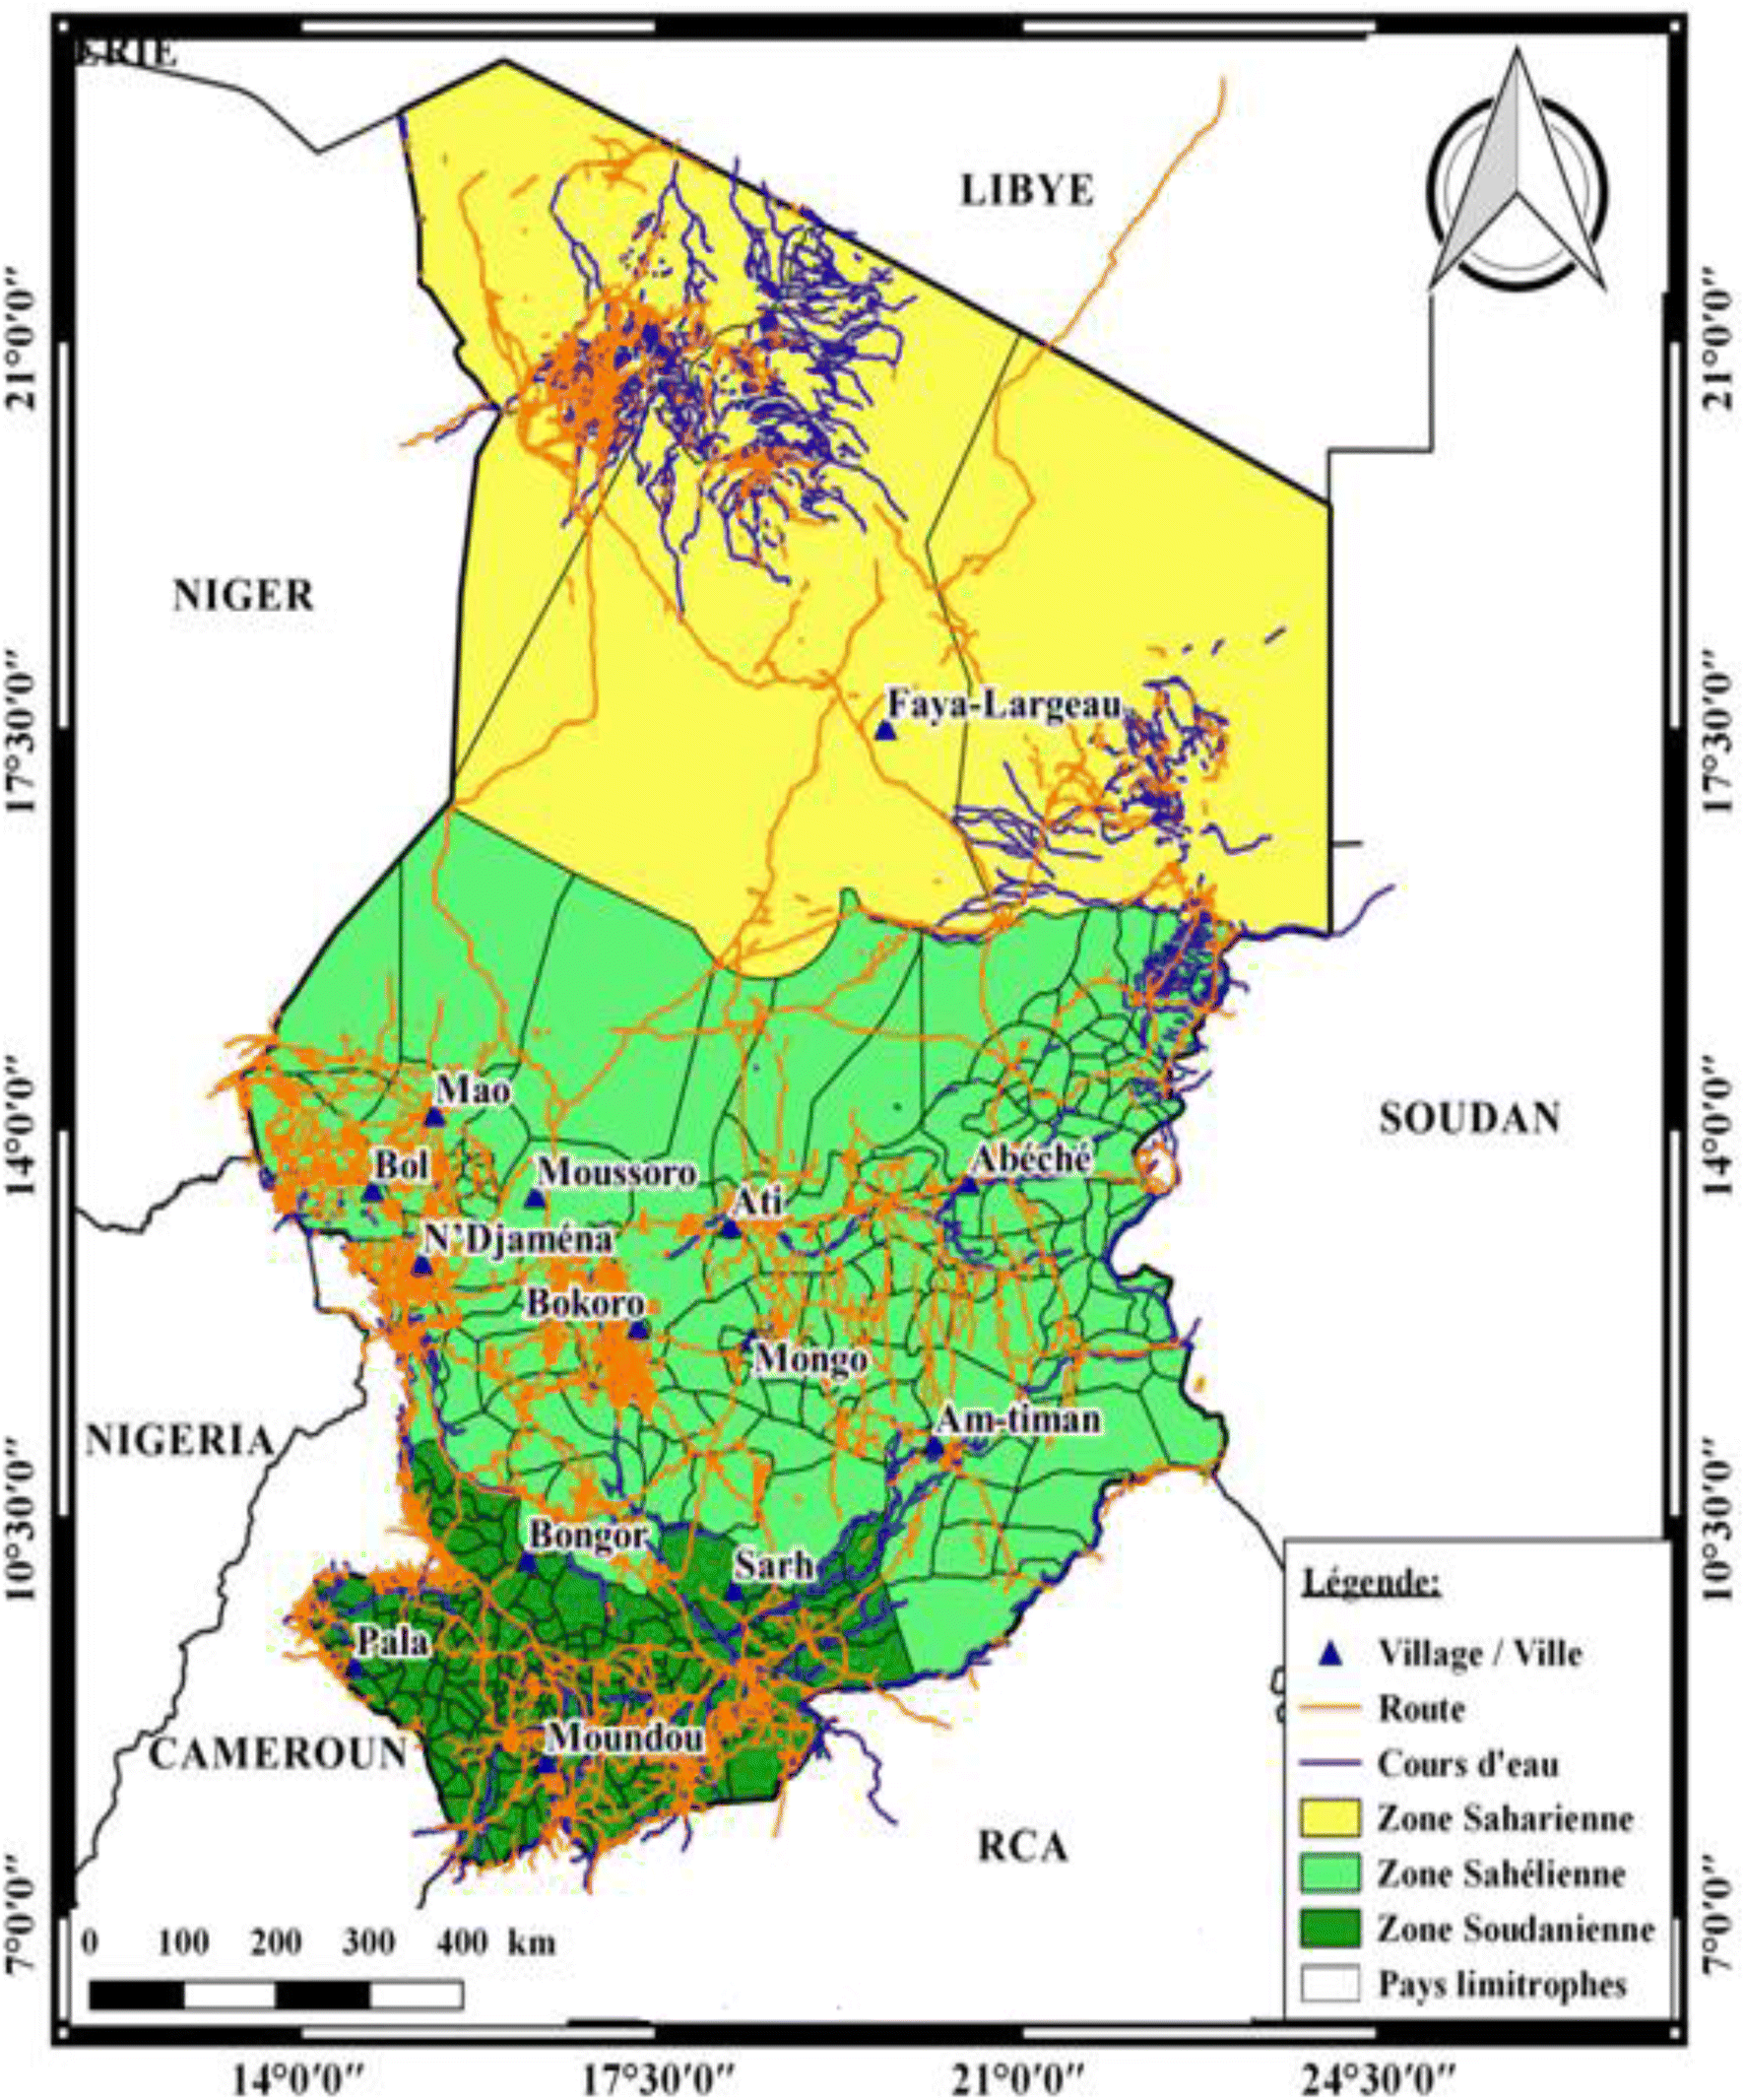
A landlocked country in Central Africa, Chad is located between 7° and 24° north latitude and 13° and 24° east longitude (Fig.
1
). It is bordered, in the North with Libya, in the East with Sudan, in the South with the Central African Republic, and in the West with Cameroon, Niger and Nigeria (countries with which it shares Lake Chad). The nearest port, Douala, is 1700 km from N'Djamena, the capital. The Chadian population is estimated at 11.5 million inhabitants in 2011 (i.e., 27.2% of the population of the CEMAC zone). It is relatively young, and a large majority live in rural areas. Although on a downtrend, population growth is 2.6% on average each year.
Fig. 1
Map of Chad
Wind characteristic of the selected locations
The wind data used were obtained from the National Office of Meteorology (ONM). These are monthly wind speed data measured for 12 sites. Geographic coordinates are shown in Table
1
.
Table 1
Geographical coordinates of stations used in the study
Zones
Station
Longitude (°E)
Latitude (°N)
Elevation (m)
Period of measurement (year)
Height of the mast (m)
Saharan zone
Faya-Largeau
19.7
17.55
233
18
10
Abeche
20.51
13.51
545
26
10
Bokoro
17.3
12.23
300
18
10
N’Djamena
15.2
12.8
294
20
10
Sahelian zone
Mongo
18.41
12.11
430
30
10
Ati
18.19
13.13
334
19
10
Mao
15.32
14.12
356
9
10
Bol
14.72
13.45
291
9
10
Am-Timan
20.17
11.2
432
28
10
Moundou
16.4
8.37
420
20
10
Sudanese zone
Pala
14.55
9.22
420
30
10
Sarh
18.23
9.9
364
20
10
Statistical analysis of wind data
To estimate the variations of the wind speed, we used the Weibull probability function which is represented by the following equation [
26
,
27
]:
f(v)=kc·vc(k-1)·exp-vck,(k>0,v>0,c>1), 0,v > 0,c > 1),$$\end{document}]]>
where
v
is the wind speed (m/s),
c
is the scale parameter (m/s), and
k
is the shape parameter (dimensionless).
Extrapolation of wind speed at different heights
Wind speed is generally measured at 10 m height, while the installation height of wind turbines is always higher than this height. Moreover, the wind speed increases with the altitude because of the existence of the atmospheric boundary layer, it is necessary to extrapolate the measured wind speed up to the hub height of the wind turbine. The most commonly used method for this purpose is the power law [
28
]. It is expressed by the following relation [
29
]:
vz2=vz10z2z10mm=0.37-0.088lnv101-0.088lnz1010.
The Weibull parameters at the measured height are related to the parameters at the height of the wind turbine by the following expressions:
ch=c0hh0nkh=k01-0.088lnh010/1-0.088lnh10,
where
c0
and
k0
are the scale factor and the shape parameter, respectively, at the measured height
h0
, and
h
is the height of the concentrator.
Estimation of electrical energy supplied by wind turbines
The performance of the wind turbines is estimated with the capacity factor (
Cf
) which represents the fraction of the average power supplied by the wind turbine (
Pe, moy
) compared to the nominal power of the wind turbine (
PeR
). The average power (
Pe, Avg
) and the capacity factor of wind turbines are calculated using the following equations [
30
,
31
]:
Pe=0(v<vc)PeRvk-vckvRk-vck(vc≤v≤vR)PeR(vR≤v≤vF)0(vF<v)Pe,ave=PeRe-vcck-e-vrckvrck-vcck-e-vfck,
and the capacity factor
Cf
of a wind turbine is given by:
Cf=Pe,avePeR,
where
Vc
,
Vr
, and
Vf
, are the zero flow wind speed, the nominal wind speed, and the shutdown speed of the wind turbine, respectively.
Annual cumulative energy production (AEP) is then estimated using equation [
30
]:
Eout=Pe,avg×8760.
The availability of the wind power resource for generating electricity is taken as
A
= 75% and the total energy output over the WT lifetime is computed as:
EWT=8760×A×n×Pr×Cf.
Economic analysis of wind energy
According to [
32
,
33
], the main parameters governing the cost of producing wind energy are as follows:
Investment costs (including ancillary fees for foundations, network connection, etc.);
Operating and maintenance costs;
Electricity generation/average wind speed;
The life of the turbine;
The discount rate.
These factors may vary from country to country and region to region. However, of all the parameters listed, the price of the wind turbine and other capital costs are the most important. According to [
32
,
33
], the specific cost of a wind turbine varies considerably from one manufacturer to another as shown in Table
2
. The choice of the ideal wind turbine is, therefore, essential to ensure economic viability, while the production of electricity is highly dependent on wind conditions. Several methods discussed in [
34
] have been used in the literature for calculating the cost of wind energy. The PVC method is adopted in this study, because (1) it considers the dynamic development of relevant economic factors and (2) the different cost and income variables, which are taken into account regardless of whether the money has been or will be paid or received in the past or in the future, by deducting the accumulated cost of interest (discounting) of all payment flows at a common reference time [
34
]. The present value of costs (PVC) is determined using relationship [
35
]:
PVC=1+Com×1+ir-i×1-1+i1+rn-S×1+i1+rn,
where
r
represents the interest rate,
i
the rate of inflation,
t
the life of the wind turbine, and
S
the additional costs and includes the costs of operation, maintenance, and repair.
Table 2
Variation in the cost of wind turbines with rated power [
34
]
WT size (kW)
Specific cost per kW
Average specific per kW
< 20
2200–3000
2600
20–200
1250–2300
1775
>$$\end{document}]]> 200
700–1600
1150
To estimate PVC, the following quantities and assumptions are retained [
35
,
36
]:
r=i0-i1+i.
In Table
2
, it is found that the cost per kW decreases with the increase in the size of the wind turbine. For the machine size above 200 kW, the average cost of a wind turbine is in the order of $ 1150/kW.
The cost of energy (COE) in kW produced is determined by the following expression [
37
]:
COE$/kWh=PVC/EWT.
Results and discussion
Estimation of wind resources
Average wind speed
The monthly wind speed for 12 selected sites at 10 m altitude is presented in Table
3
. It is noted that the least wind speed of 1 m/s is observed in Am-Timan in August, September, and October, while the highest of 4.2 m/s is recorded in N'Djamena in March.
Table 3
Values of the wind speed at 10 m altitude
v (m/s)
Jan
Feb
Mar
Apr
May
Jun
Jul
Aug
Sep
Oct
Nov
Dec
Aver
Abeche
2.7
2.8
3.1
3
2.7
2.4
2.6
2.1
2
2.6
2.9
2.8
2.642
Am-Timan
1.5
1.6
1.4
1.5
1.7
1.5
1.3
1
1
1
1.2
1.4
1.342
Bokoro
1.7
1.9
1.9
1.7
1.7
1.7
1.6
1.3
1.2
1.2
1.5
1.6
1.583
Mongo
2.2
2.7
3.1
3.1
3.1
2.9
2.5
2.1
1.8
2.3
2.5
2.2
2.542
N’Djamena
3.6
4
4.2
3.2
3.2
3.6
3.2
2.5
2.4
2.4
3.3
3.4
3.25
Faya
4
3.8
3.7
3.3
2.9
2.7
2.3
2.2
3
3.4
3.9
3.8
3.25
Moundou
3.1
3.3
3.1
3.3
2.9
2.8
2.7
2.3
2.1
2
2.1
2.6
2.692
Pala
2.6
2.9
2.9
2.8
2.7
2.4
2.1
1.7
1.7
1.9
2
2.3
2.333
Sarh
1.9
2.2
2.4
3.2
2.3
2
1.7
1.4
1.4
1.4
1.4
1.6
1.908
Bol
2.2
2.2
2.2
2
1.9
2
2.2
1.8
1.5
1.8
2.2
2.2
2.017
Mao
2.4
2.5
2.6
2.2
2.1
2.1
2.1
1.8
1.8
2.1
2.4
2.5
2.217
Ati
1.7
1.9
2
1.8
1.8
1.8
1.8
1.4
1.4
1.5
1.7
1.8
1.717
Weibull k parameters at 10 m altitude
Table
4
presents the Weibull
k
parameter at 10 m altitude. From Table
4
, it can be seen that the least value of the form parameter (
k
) of the Weibull distribution of 1.062 is recorded at Am-Timan, while the highest value of 4.907 is observed at Mao in September.
Table 4
Form parameter values
k
at 10 m altitude
k (m/s)
Jan
Feb
Mar
Apr
May
Jun
Jul
Aug
Sep
Oct
Nov
Dec
Abeche
3.051
3.513
3.187
3.547
3.051
3.083
3.118
2.789
2.786
3.292
3.76
3.59
Am-Ti
1.094
1.062
4.544
4.431
1.527
2.13
2.454
3.563
3.183
2.441
1.201
1.175
Bokoro
3.84
3.403
4.086
4.294
3.84
3.944
3.476
3.272
3.755
3.498
3.911
3.803
Mongo
3.811
3.482
3.833
3.541
3.078
3.091
2.931
2.873
2.658
3.364
3.632
3.262
N’Djamena
4.621
4.202
4.47
3.926
4.31
4.683
4.368
4.081
4.093
3.528
4.407
4.097
Faya-Larg
3.783
3.679
3.012
3.92
3.628
3.774
3.634
3.554
3.563
4.04
4.19
4.181
Moundou
3.613
3.242
3.256
2.876
3.028
3.144
3.306
2.705
3.058
2.397
3.235
3.355
Pala
3.193
3.539
3.143
3.205
3.482
3.277
3.983
3.559
3.108
3.646
2.64
2.263
Sarh
1.194
1.232
1.307
1.621
3.396
3.73
3.741
3.144
3.144
2.924
1.678
1.294
Bol
4.868
4.521
4.654
4.12
4.258
4.428
4.587
4.162
3.911
4.605
4.458
4.163
Mao
4.308
4.433
4.765
4.587
4.907
4.364
4.507
4.863
5.149
4.739
4.093
4.75
Ati
2.871
2.808
2.883
2.621
2.697
2.697
2.867
3.144
3.144
2.616
2.177
2.779
Weibull c parameters at 10 m altitude
Table
5
presents the monthly values of the scale parameter of the Weibull distribution. Thus, the least value of 1.11 m/s is recorded at Am-Timan and the highest value of 4.604 m/s is observed in N'Djamena.
Table 5
Parameter values
c
at 10 m altitude
c (m/s)
Jan
Feb
Mar
Apr
May
Jun
Jul
Aug
Sept
Oct
Nov
Dec
Abeche
3.021
3.111
3.461
3.332
3.021
2.684
2.906
2.358
2.246
2.898
3.21
3.107
Am-Timan
1.551
1.638
1.533
1.645
1.887
1.693
1.466
1.11
1.117
1.128
1.276
1.48
Bokoro
1.88
2.115
2.093
1.868
1.88
1.877
1.779
1.45
1.328
1.334
1.657
1.77
Faya-Larg
4.426
4.212
4.142
3.645
3.217
2.988
2.551
2.443
3.331
3.749
4.291
4.181
Mongo
2.434
3.001
3.428
3.443
3.467
3.243
2.802
2.356
2.025
2.561
2.773
2.454
N'Djamena
3.938
4.4
4.604
3.534
3.515
3.935
3.512
2.755
2.644
2.666
3.62
3.746
Moundou
3.439
3.682
3.458
3.702
3.246
3.128
3.009
2.586
2.349
2.256
2.343
2.896
Pala
2.903
3.221
3.24
3.126
3.001
2.676
2.317
1.888
1.9
2.107
2.25
2.596
Sarh
2.017
2.353
2.601
3.573
2.56
2.215
1.882
1.564
1.564
1.569
1.567
1.731
Bol
2.4
2.41
2.406
2.203
2.089
2.193
2.408
1.981
1.657
1.97
2.412
2.421
Mao
2.636
2.742
2.839
2.408
2.289
2.305
2.301
1.963
1.957
2.294
2.644
2.731
Ati
1.907
2.133
2.243
2.026
2.024
2.024
2.019
1.564
1.564
1.688
1.919
2.022
Extrapolation of data at different altitudes
Wind data from the ONM were used to determine monthly variations of statistical parameters at 10 m in height. These quantities are then extrapolated to 30, 50 and 70 m in height.
Extrapolation of wind speed to 30.50, and 67 m altitude
The average wind speed at 30 m altitude is presented in Table
6
. From Table
6
, it can be seen that the minimum speed of 1.502 m/s is recorded at Am-Timan in the months of August, September, and October, while the maximum speed of 5.490 m/s is recorded in the month of March in N'Djamena.
Table 6
Mean wind speed at 30 m altitude
Month
Abec
Am-T
Bok
Fay
Mon
Mou
N’Dja
Pala
Sarh
Bol
Mao
Ati
Jan
3.683
2.166
2.425
5.253
3.061
4.173
4.776
3.56
2.681
3.061
3.311
2.425
Feb
3.806
2.296
2.681
5.015
3.683
4.415
5.253
3.929
3.061
3.061
3.436
2.681
Mar
4.173
2.035
2.681
4.896
4.173
4.173
5.49
3.929
3.311
3.061
3.56
2.808
Apr
4.051
2.166
2.425
4.415
4.173
4.415
4.294
3.806
4.294
2.808
3.061
2.554
May
3.683
2.425
2.425
3.929
4.173
3.929
4.294
3.683
3.186
2.681
2.935
2.554
Jun
3.311
2.166
2.425
3.683
3.929
3.806
4.776
3.311
2.808
2.808
2.935
2.554
Jul
3.56
1.903
2.296
3.186
3.436
3.683
4.294
2.935
2.425
3.061
2.935
2.554
Aug
2.935
1.502
1.903
3.061
2.935
3.186
3.436
2.425
2.035
2.554
2.554
2.035
Sept
2.808
1.502
1.77
4.051
2.554
2.935
3.311
2.425
2.035
2.166
2.554
2.035
Oct
3.56
1.502
1.77
4.536
3.186
2.808
3.311
2.681
2.035
2.554
2.935
2.166
Nov
3.929
1.77
2.166
5.134
3.436
2.935
4.415
2.808
2.035
3.061
3.311
2.425
Dec
3.806
2.035
2.296
5.015
3.061
3.56
4.536
3.186
2.296
3.061
3.436
2.554
Aver
3.609
1.955
2.272
4.348
3.483
3.668
4.349
3.223
2.6835
2.828
3.08
2.445
Extrapolation of the wind speed to 50 m altitude
Table
7
presents the average wind speed at altitude of 50 m. From Table
7
, it can be seen that the minimum average wind speed of 1.814 m/s is recorded in Am-Timan in August, September, and October, while the maximum speed of 6.217 m/s is recorded in N'Djamena in March.
Table 7
Mean wind speed at 50 m altitude
Mois
Abec
Am-T
Bok
Fay
Mon
Mou
N’Dja
Pala
Sarh
Bol
Mao
Ati
Jan
4.255
2.569
2.86
5.962
3.569
4.791
5.447
4.119
3.147
3.569
3.846
2.86
Feb
4.39
2.715
3.147
5.705
4.255
5.055
5.962
4.524
3.569
3.569
3.983
3.147
Mar
4.791
2.421
3.147
5.576
4.791
4.791
6.217
4.524
3.846
3.569
4.119
3.289
Apr
4.658
2.569
2.86
5.055
4.791
5.055
4.923
4.39
4.923
3.289
3.569
3.004
May
4.255
2.86
2.86
4.524
4.791
4.524
4.923
4.255
3.708
3.147
3.429
3.004
Jun
3.846
2.569
2.86
4.255
4.524
4.39
5.447
3.846
3.289
3.289
3.429
3.004
Jul
4.119
2.272
2.715
3.708
3.983
4.255
4.923
3.429
2.86
3.569
3.429
3.004
Aug
3.429
1.814
2.272
3.569
3.429
3.708
3.983
2.86
2.421
3.004
3.004
2.421
Sept
3.289
1.814
2.121
4.658
3.004
3.429
3.846
2.86
2.421
2.569
3.004
2.421
Oct
4.119
1.814
2.121
5.186
3.708
3.289
3.846
3.147
2.421
3.004
3.429
2.569
Nov
4.524
2.121
2.569
5.834
3.983
3.429
5.055
3.289
2.421
3.569
3.846
2.86
Dec
4.39
2.421
2.715
5.705
3.569
4.119
5.186
3.708
2.715
3.569
3.983
3.004
Aver
4.172
2.33
2.687
4.978
4.033
4.236
4.98
3.746
3.145
3.31
3.589
2.882
Table
8
shows the extrapolation of the wind speed to 67 m altitude. Minimum speed of 2.021 m/s is recorded in the months of August, September, and October in Am-Timan. The maximum speed of 6.677 m/s is recorded in the month of March in N'Djamena. It can be deduced that the wind speed increases with altitude.
Table 8
Mean wind speed at 67 m altitude
Mois
Abec
Am-T
Bok
Fay
Mon
Mou
N’Dja
Pala
Sarh
Bol
Mao
Ati
Jan
4.622
2.833
3.144
6.411
3.897
5.185
5.873
4.479
3.449
3.897
4.19
3.144
Feb
4.764
2.99
3.449
6.143
4.622
5.462
6.411
4.905
3.897
3.897
4.335
3.449
Mar
5.185
2.675
3.449
6.008
5.185
5.185
6.677
4.905
4.19
3.897
4.479
3.6
Apr
5.046
2.833
3.144
5.462
5.185
5.462
5.324
4.764
5.324
3.6
3.897
3.298
May
4.622
3.144
3.144
4.905
5.185
4.905
5.324
4.622
4.044
3.449
3.749
3.298
Jun
4.19
2.833
3.144
4.622
4.905
4.764
5.873
4.19
3.6
3.6
3.749
3.298
Jul
4.479
2.515
2.99
4.044
4.335
4.622
5.324
3.749
3.144
3.897
3.749
3.298
Aug
3.749
2.021
2.515
3.897
3.749
4.044
4.335
3.144
2.675
3.298
3.298
2.675
Sept
3.6
2.021
2.353
5.046
3.298
3.749
4.19
3.144
2.675
2.833
3.298
2.675
Oct
4.479
2.021
2.353
5.6
4.044
3.6
4.19
3.449
2.675
3.298
3.749
2.833
Nov
4.905
2.353
2.833
6.277
4.335
3.749
5.462
3.6
2.675
3.897
4.19
3.144
Dec
4.764
2.675
2.99
6.143
3.897
4.479
5.6
4.044
2.99
3.897
4.335
3.298
Aver
4.534
2.576
2.959
5.38
4.386
4.601
5.382
4.083
3.445
3.622
3.918
3.167
Extrapolation of the Weibull k and c parameters
Table
9
presents the extrapolation of the shape parameter at 30 m altitude. From Table
9
, it can be seen that the least l value of 1.072 is recorded in February in Am-Timan, while the highest value of 5.199 is recorded in Mao in the month of September.
Table 9
Extrapolation of the parameter
k
to 30 m
Mois
Abec
Am-T
Bok
Fay
Mon
Mou
N’Dja
Pala
Sarh
Bol
Mao
Ati
Jan
3.081
1.105
3.878
3.82
3.848
3.648
4.666
3.224
1.206
4.916
4.35
2.899
Feb
3.547
1.072
3.436
3.715
3.516
3.274
4.243
3.574
1.244
4.565
4.476
2.835
Mar
3.218
4.588
4.126
3.041
3.871
3.288
4.514
3.174
1.32
4.7
4.812
2.911
Apr
3.582
4.474
4.336
3.958
3.576
2.904
3.964
3.236
1.637
4.16
4.632
2.647
May
3.081
1.542
3.878
3.664
3.108
3.058
4.352
3.516
3.429
4.3
4.955
2.723
Jun
3.113
2.151
3.983
3.811
3.121
3.175
4.729
3.309
3.767
4.471
4.407
2.723
Jul
3.149
2.478
3.51
3.67
2.96
3.338
4.411
4.022
3.778
4.632
4.551
2.895
Aug
2.816
3.598
3.304
3.589
2.901
2.731
4.121
3.594
3.175
4.203
4.911
3.175
Sept
2.813
3.214
3.792
3.598
2.684
3.088
4.133
3.138
3.175
3.949
5.199
3.175
Oct
3.324
2.465
3.532
4.08
3.397
2.42
3.563
3.682
2.953
4.65
4.785
2.642
Nov
3.797
1.213
3.949
4.231
3.668
3.267
4.45
2.666
1.694
4.502
4.133
2.198
Dec
3.625
1.187
3.84
4.222
3.294
3.388
4.137
2.285
1.307
4.204
4.796
2.806
Aver
3.262
2.424
3.797
3.783
3.329
3.132
4.274
3.285
2.39
4.438
4.667
2.802
Table
10
presents values of
k
at altitude of 50 m. From Table
10
, it can be seen that at 50 m altitude the minimum
k
value of 1.077 is recorded at Am-Timan in February and the maximum value of 5.223 at Mao is recorded in September.
Table 10
Extrapolation of the parameter
k
to 50 m
Mois
Abec
Am-T
Bok
Fay
Mon
Mou
N’Dja
Pala
Sarh
Bol
Mao
Ati
Jan
3.095
1.11
3.895
3.837
3.866
3.665
4.688
3.239
1.211
4.938
4.37
2.912
Feb
3.564
1.077
3.452
3.732
3.532
3.289
4.262
3.59
1.25
4.586
4.497
2.848
Mar
3.233
4.609
4.145
3.055
3.888
3.303
4.534
3.188
1.326
4.721
4.834
2.925
Apr
3.598
4.495
4.356
3.976
3.592
2.917
3.983
3.251
1.644
4.179
4.653
2.659
May
3.095
1.549
3.895
3.68
3.122
3.072
4.372
3.532
3.445
4.319
4.978
2.736
Jun
3.127
2.161
4.001
3.828
3.136
3.189
4.75
3.324
3.784
4.492
4.427
2.736
Jul
3.163
2.489
3.526
3.686
2.973
3.354
4.431
4.04
3.795
4.653
4.572
2.908
Aug
2.829
3.614
3.319
3.605
2.914
2.744
4.14
3.61
3.189
4.222
4.933
3.189
Sept
2.826
3.229
3.809
3.614
2.696
3.102
4.152
3.153
3.189
3.967
5.223
3.189
Oct
3.339
2.476
3.548
4.098
3.412
2.432
3.579
3.698
2.966
4.671
4.807
2.654
Nov
3.814
1.218
3.967
4.25
3.684
3.282
4.47
2.678
1.702
4.522
4.152
2.208
Dec
3.642
1.192
3.858
4.241
3.309
3.403
4.156
2.296
1.313
4.223
4.818
2.819
Aver
3.277
2.435
3.814
3.8
3.344
3.146
4.293
3.3
2.401
4.458
4.689
2.815
Table
11
presents extrapolated values of parameter
k
at 67 m altitude. The least value of 1.08 is observed in Am-Timan in February, while the highest value of 5.237 is recorded in Mao in September.
Table 11
Extrapolation of the parameter
k
to 67 m
Months
Abec
Am-T
Bok
Fay
Mon
Mou
N’Dja
Pala
Sarh
Bol
Mao
Ati
Jan
3.103
1.113
3.905
3.848
3.876
3.675
4.7
3.247
1.214
4.951
4.381
2.92
Fév
3.573
1.08
3.461
3.742
3.541
3.297
4.274
3.599
1.253
4.598
4.509
2.856
Mar
3.241
4.621
4.156
3.063
3.898
3.312
4.546
3.197
1.329
4.733
4.846
2.932
Apr
3.608
4.507
4.367
3.987
3.601
2.925
3.993
3.26
1.649
4.19
4.665
2.666
May
3.103
1.553
3.905
3.69
3.131
3.08
4.384
3.541
3.454
4.331
4.991
2.743
Jun
3.136
2.166
4.011
3.838
3.144
3.198
4.763
3.333
3.794
4.504
4.438
2.743
Jul
3.171
2.496
3.535
3.696
2.981
3.362
4.442
4.051
3.805
4.665
4.584
2.916
Aug
2.837
3.624
3.328
3.615
2.922
2.751
4.151
3.62
3.198
4.233
4.946
3.198
Sept
2.834
3.237
3.819
3.624
2.703
3.11
4.163
3.161
3.198
3.978
5.237
3.198
Oct
3.348
2.483
3.558
4.109
3.421
2.438
3.588
3.708
2.974
4.684
4.82
2.661
Nov
3.824
1.222
3.978
4.261
3.694
3.29
4.482
2.685
1.707
4.534
4.163
2.214
Dec
3.651
1.195
3.868
4.252
3.318
3.412
4.167
2.302
1.316
4.234
4.831
2.826
Aver
3.286
2.441
3.824
3.81
3.353
3.154
4.304
3.309
2.407
4.47
4.701
2.823
Table
12
presents extrapolated values of the scale parameter
c
at 30 m altitude. From Table
12
, it can be seen that the minimum value of 1.65 m/s is recorded in the month of August in Am-Timan, while the maximum value of 5.964 m/s is recorded in N'Djamena in the month of March.
Table 12
Extrapolation of parameter
c
at 30 m altitude
Months
Abec
Am-T
Bok
Fay
Mon
Mou
N’Dja
Pala
Sarh
Bol
Mao
Ati
Jan
4.076
2.232
2.656
5.756
3.354
4.583
5.179
3.932
2.83
3.311
3.604
2.69
Feb
4.186
2.345
2.954
5.504
4.052
4.874
5.725
4.319
3.253
3.324
3.735
2.977
Mar
4.609
2.209
2.926
5.421
4.569
4.605
5.964
4.342
3.561
3.319
3.854
3.115
Apr
4.454
2.354
2.64
4.83
4.587
4.898
4.697
4.204
4.744
3.065
3.321
2.841
May
4.076
2.665
2.656
4.315
4.616
4.35
4.674
4.052
3.51
2.921
3.173
2.839
Jun
3.663
2.416
2.652
4.036
4.346
4.207
5.176
3.653
3.08
3.052
3.193
2.839
Jul
3.936
2.121
2.527
3.499
3.808
4.062
4.67
3.208
2.658
3.321
3.188
2.833
Aug
3.259
1.65
2.1
3.365
3.256
3.542
3.751
2.666
2.249
2.784
2.761
2.249
Sept
3.119
1.659
1.94
4.452
2.84
3.248
3.614
2.681
2.249
2.37
2.754
2.249
Oct
3.926
1.674
1.948
4.954
3.511
3.131
3.641
2.944
2.256
2.77
3.179
2.41
Nov
4.306
1.871
2.37
5.597
3.773
3.24
4.8
3.124
2.253
3.326
3.614
2.706
Dec
4.181
2.14
2.515
5.467
3.378
3.924
4.951
3.555
2.465
3.337
3.721
2.836
Aver
3.983
2.111
2.49
4.766
3.841
4.055
4.737
3.557
2.926
3.075
3.341
2.715
Table
13
presents extrapolated values of parameter
c
at 50 m altitude. From Table
13
, it can be seen that the minimum value of parameter
c
is 1.984 m/s in the month of August in Am-Timan, while the maximum value of 6.727 m/s is recorded in N'Djamena in the month of March.
Table 13
Extrapolation of parameter
c
to 50 m
Months
Abec
Am-T
Bok
Fay
Mon
Mou
N’Dja
Pala
Sarh
Bol
Mao
Ati
Jan
4.686
2.644
3.119
6.503
3.892
5.237
5.883
4.528
3.313
3.846
4.168
3.157
Feb
4.805
2.771
3.45
6.233
4.659
5.553
6.471
4.951
3.781
3.86
4.312
3.476
Mar
5.266
2.618
3.42
6.144
5.223
5.262
6.727
4.976
4.121
3.854
4.442
3.629
Apr
5.097
2.781
3.101
5.505
5.242
5.579
5.361
4.825
5.412
3.573
3.857
3.325
May
4.686
3.129
3.119
4.945
5.273
4.984
5.336
4.659
4.065
3.414
3.693
3.323
Jun
4.233
2.85
3.114
4.642
4.98
4.828
5.879
4.222
3.59
3.559
3.715
3.323
Jul
4.532
2.519
2.974
4.053
4.393
4.67
5.332
3.731
3.121
3.857
3.709
3.315
Aug
3.788
1.984
2.495
3.905
3.785
4.1
4.329
3.13
2.663
3.262
3.236
2.663
Sept
3.633
1.995
2.314
5.095
3.324
3.776
4.179
3.147
2.663
2.798
3.228
2.663
Oct
4.521
2.012
2.323
5.64
4.066
3.647
4.209
3.439
2.67
3.246
3.7
2.843
Nov
4.936
2.236
2.798
6.333
4.353
3.767
5.473
3.639
2.667
3.862
4.179
3.174
Dec
4.8
2.54
2.961
6.193
3.92
4.519
5.636
4.114
2.905
3.875
4.297
3.32
Aver
4.582
2.506
2.932
5.432
4.426
4.66
5.401
4.113
3.414
3.584
3.878
3.184
The extrapolated values of parameter
c
extrapolated at 67 m altitude are presented in Table
14
. From Table
14
, the minimum value of 2.205 m/s is recorded in Am-Timan in August, while the maximum value of 7.208 m/s is recorded in N'Djamena in March. It is found that the value of
c
increases with altitude, and hence, it can be concluded that the site assessed is windy.
Table 14
Extrapolation of parameter
c
to 67 m
Months
Abec
Am-T
Bok
Fay
Mon
Mou
N’Dja
Pala
Sarh
Bol
Mao
Ati
Jan
5.075
2.913
3.419
6.975
4.239
5.653
6.328
4.909
3.625
4.19
4.53
3.46
Feb
5.201
3.049
3.771
6.693
5.047
5.984
6.941
5.353
4.122
4.205
4.682
3.798
Mar
5.683
2.885
3.739
6.6
5.638
5.679
7.208
5.379
4.48
4.199
4.819
3.961
Apr
5.506
3.059
3.401
5.934
5.659
6.011
5.783
5.221
5.836
3.902
4.202
3.639
May
5.075
3.43
3.419
5.348
5.691
5.388
5.757
5.047
4.421
3.733
4.028
3.636
Jun
4.599
3.134
3.415
5.029
5.384
5.224
6.324
4.588
3.919
3.887
4.052
3.636
Jul
4.914
2.78
3.266
4.408
4.767
5.058
5.753
4.069
3.422
4.202
4.046
3.628
Aug
4.129
2.205
2.754
4.252
4.126
4.459
4.7
3.431
2.933
3.571
3.544
2.933
Sept
3.965
2.216
2.56
5.505
3.637
4.116
4.542
3.449
2.933
3.078
3.535
2.933
Oct
4.902
2.235
2.57
6.074
4.423
3.98
4.573
3.76
2.941
3.555
4.035
3.126
Nov
5.338
2.476
3.078
6.797
4.726
4.107
5.9
3.971
2.938
4.208
4.542
3.478
Dec
5.195
2.802
3.252
6.652
4.268
4.9
6.07
4.473
3.192
4.221
4.666
3.633
Aver
4.965
2.765
3.22
5.856
4.8
5.047
5.823
4.471
3.73
3.912
4.223
3.488
Comparison of the wind energy potential at the three climatic zones assessed
From the comparison of wind characteristics in the three selected climatic zones at 10 m altitude, it can be deduced that:
The minimum wind speed of 1.342 m/s is recorded at Am-Timan, while the maximum speed of 3.25 m/s is recorded at N'Djamena and Faya-Largeau.
As for the power density, the highest power density of 28,609 W/m
2
is recorded at Faya-Largeau and the least power density of 3163 W/m
2
is recorded at Bokoro.
Estimation of electric power generation by wind turbines
Three wind turbines were selected for the estimation of wind power generation: Bonus 300 kW/33, Bonus 1 MW/54, and Vestas 2 MW/V80. Their rated power (Pr) is 300, 1000, and 2000 kW, respectively.
Table
15
shows the characteristic properties of selected wind turbines (Bonus 300 kW/33, Bonus 1 MW/54 and Vestas 2 MW/80).
Table 15
Characteristics of selected wind turbines
Characteristics
Bonus 300 kW/33
AN Bonus 1 MW/54
Vestas 2 MW/80
Rated power Pr (kW)
300
1000
2000
Hub height h (m)
30
50
67
Rotor diameter (m)
33.4
54.2
80
Rated wind speed Vr (m/s)
14
15
16
Cut-in wind speed Vc (m/s)
3
3
4
Cut-off wind speed Vf (m/s)
25
25
25
For the three wind turbines, the one whose power is high is Vestas 2 MW/V80 including Faya-Largeau (327.18 kW) and Bokoro (9.49 kW). The wind turbine with the lowest power is Bonus 300 kW/33, Faya-Largeau (61.53 kW), and Bokoro (1.19 kW).
Annual energy generated by the three turbines for the 12 selected locations in Chad
Table
16
shows the annual energy generated by wind turbines selected for this study. It can be seen from Table
16
that:
Table 16
Calculated annual energy estimate for selected wind turbines for selected sites
Sites
BONUS 300 kW/33
BONUS 1 MW/54
VESTAS 2 MW/V80
Pe,m
Cf (%)
Eout
Pe,m
Cf (%)
Eout
Pe,m
Cf (%)
Eout
Abeche
7.52
2.51
5418
197.43
19.74
142,148
327.18
16.36
235,569
Am-Timan
50.18
16.73
36,132
240.28
24.03
173,003
382.92
19.15
275,703
Bokoro
1.19
0.4
855
10.49
1.05
7554
9.49
0.47
6830
Mongo
36.02
12.01
25,935
172.26
17.23
124,026
283.76
14.19
204,304
N'Djamena
34.18
11.39
24,609
152.89
15.29
110,080
283.31
14.17
203,984
Faya-Larg
61.53
20.51
44,301
266.06
26.61
191,564
488.34
24.42
351,603
Moundou
56.07
18.69
40,373
257.30
25.73
185,257
435.46
21.77
313,533
Pala
31.78
10.59
22,879
154.81
15.48
111,464
247.86
12.39
178,457
Sarh
115.50
38.5
83,159
493.72
49.37
355,477
840.42
42.02
605,101
Bol
1.99
0.66
1435
13.79
1.38
9925
16.84
0.84
12,124
Mao
3.42
1.14
2461
20.03
2.00
14,423
29.39
1.47
21,162
Ati
12.45
4.15
8964
77.93
7.79
56,109
96.59
4.83
69,548
Bonus 300 kW/33 has the lowest capacity factor of 0.4% recorded in Bokoro and the highest capacity factor of 38.5% in Sarh.
Bonus 1 MW/54 has the least capacity factor of 1.05% in Bokoro and the highest capacity factor of 49.37% in Sarh.
2 MW/V80 Bonus has the least capacity factor of 0.47% in Bokoro and highest capacity factor of 42.02% in Sarh.
In addition, Vestas 2 MW/V80 wind turbine produces highest energy output of 601.10 MWh/year and capacity factor of 42.02% in Sarh. According to [
1
], the value of this factor is generally affected by the intermittent nature of the wind, the availability of the machine and the efficiency of the turbine. Capacity factor usually varies from 20 to 70% in practice.
Where
Pe, m
(kW/year) is the annual power produced by the turbine,
Cf
(%) is the capacity factor of the wind turbine, and
Eout
(MWh/year) is the annual production of accumulated energy.
Cost of electrical energy generated by the wind energy
Costs per kilowatt-hour (kWh) of electrical energy generated by the three wind turbines at 12 selected sites. This calculation was performed for the maximum and minimum values of thes specific cost of wind turbines (Tables
17
,
18
,
19
).
Table 17
Cost of electrical energy generated by Bonus 300 kW/33 wind turbine
Locations
Pout
Per
Cf (%)
EWT
CUSS
CXAF
Abeche
7.52
300
2.51
82,391.09
960.59
5801.97
Am-Timan
50.18
300
16.73
549,504.95
215,527.37
1,301,785.29
Bokoro
1.19
300
0.4
13,002.03
73,249.9
442,429.41
Faya
61.53
300
20.51
673,753.5
193.91
1171.2
Mongo
36.02
300
12.01
394,426.67
281.27
1698.88
Moundou
56.07
300
18.69
614,002.64
168.23
1016.13
N’Djamena
34.18
300
11.39
374,250.2
281.79
1702.02
Pala
31.78
300
10.59
347,950.49
742.03
4481.88
Sarh
115.5
300
38.5
1,264,705.29
2083.28
12,583.03
Bol
1.99
300
0.66
21,818.97
6044.97
36,511.62
Mao
3.42
300
1.14
37,432.58
7313.61
44,174.2
Ati
12.45
300
4.15
136,324.22
1635.68
9879.49
Table 18
Cost of electrical energy generated by BONUS 1 MW/54 wind turbine
Locations
Pout
Per
Cf (%)
EWT
CUSS
CXAF
Abeche
197.43
1000
19.74
2,161,858.5
118.22
714.05
Am-Timan
240.28
1000
24.03
2,631,109.8
27,527.15
166,264
Bokoro
10.49
1000
1.05
114,876.45
6226.88
37,610.3
Faya
266.06
1000
26.61
2,913,378.9
130.13
785.98
Mongo
172.26
1000
17.23
1,886,247
174.7
1055.2
Moundou
257.3
1000
25.73
2,817,435
110.45
667.15
N’Djamena
152.89
1000
15.29
1,674,101.7
191.6
1157.24
Pala
154.81
1000
15.48
1,695,191.4
349.21
2109.21
Sarh
493.72
1000
49.37
5,406,234
649.77
3924.59
Bol
13.78
1000
1.38
150,934.8
2081.97
12,575.1
Mao
20.03
1000
2.00
219,361.35
2510.57
15,163.8
Ati
77.93
1000
7.79
853,333.5
539.67
3259.62
Table 19
Cost of electrical energy generated by VESTAS 2 MW/V80 wind turbine
Locations
Pout
Per
Cf (%)
EWT
CUSS
CXAF
Abeche
327.18
2000
16.36
3,582,621
147.39
890.25
Am-Timan
382.92
2000
19.15
4,192,996
132,343.89
799,357.1
Bokoro
9.49
2000
0.47
103,916
56,876.63
343,534.87
Faya
488.34
2000
24.42
5,347,279
159.67
964.4
Mongo
283.75
2000
14.19
3,107,150
234.9
1418.8
Moundou
435.46
2000
21.77
4,768,309
143.08
864.21
N’Djaména
283.31
2000
14.17
3,102,266
224.59
1356.5
Pala
247.86
2000
12.39
2,714,045
619.44
3741.39
Sarh
840.42
2000
42.02
9,202,555
1733.31
10,469.17
Bol
16.84
2000
0.84
1,84,420
4935.24
29,808.88
Mao
29.39
2000
1.47
3,21,821
5896.99
35,617.82
Ati
96.59
2000
4.83
1,057,661
1369.09
8269.3
The results obtained are shown in Table
17
which shows that the lowest value of the cost of wind power varies from $143.08/kWh/year to $132,343.89/kWh/year. This value was obtained for the Vestas 2 MW/V80 wind turbine.
Conclusion
In this study, comprehensive estimation of the electrical energy generated and cost per kilowatt-hour of electrical energy generated by three different types of wind turbines at selected locations in Chad are carried out. The results obtained showed that:
The average annual speed varies from 1 m/s in Am-Timan to 4.2 m/s in N'Djamena at 10 m high. The maximum wind speed occurs in the month of March, while the least speed occurs in the months of August, September, and October.
The wind speed is extrapolated to 30.50 and 67 m altitude. Similarly, Weibull parameters
k
and
c
are also extrapolated to 30.50 and 67 m altitude.
The capacity factor values vary from one wind turbine to another: for the 300 kW/33 Bonus wind turbine, it varies from 0.4 to 38.5%. For Bonus 1 MW/54, the value varies between 1.05 and 49.37% and Vestas 2 MW/V80, it is from 0.47 to 42.02%.
Comparative assessment of electricity generated by the three types of wind turbines was carried out. Result of this study shows that Vestas 2 MW/V80 wind turbine with a hub height of 80 m produced the highest energy.
For the Sarh site, the highest capacity factor, annual power, and energy output are 42.02%, 840.42 kW/year, and 605.10 MWh/year, respectively, recorded. The least capacity factor, annual power, and energy output of 0.47%, 9.49 kW/year, and 6830 MWh, respectively are recorded in Bokoro.
The average least cost per kWh of electricity generated was obtained at Moundou of 143.08$/kWh/year the model Vestas 2 MW/V80, while the highest average cost of $132,343.89/kWh/year recorded in Am-Timan. Based on these values, it can be concluded that for the Am-Timan site, wind power generation, with wind turbines, is not economical.
For the three wind turbines, the one whose power is high is Vestas 2 MW/V80 including Faya-Largeau (327.18 kW) and Bokoro (9.49 kW). The wind turbine with the lowest power is Bonus 300 kW/33, Faya-Largeau (61.53 kW), and Bokoro (1.19 kW).
Electrical and mechanical applications not connected to the network (water pumping, recharging of batteries) would be more suitable. On the other hand, the construction of a wind farm in the Moundou region can be considered.
Acknowledgements
We make a point of thanking the persons in charge of the National Meteorology for Chad, as the personnel who deal with the collection and the processing weather data on these sites, to have placed at our disposal the data which were used in our work.
Publisher's Note
Springer Nature remains neutral with regard to jurisdictional claims in published maps and institutional affiliations.
References
Belabes et al. (2015) Evaluation of wind energy potential and estimation of cost using wind energy turbines for electricity generation in north of Algeria (pp. 1245-1255) 10.1016/j.rser.2015.07.043
Stambouli et al. (2012) A review on the renewable energy development in Algeria current perspective, energy scenario and sustainability issues (pp. 4445-4460) 10.1016/j.rser.2012.04.031
Gökçek and Mustafa (2009) Evaluation of electricity generation and energy cost of wind energy conversion systems (WECSs) in Central Turkey (pp. 2731-2739) 10.1016/j.apenergy.2009.03.025
Ohunakin (2010) Energy utilization and renewable energy sources in Nigeria (pp. 171-177) 10.3923/jeasci.2010.171.177
Ucar and Balo (2008) A seasonal analysis of wind turbine characteristics and wind power potential in Manisa, Turkey (pp. 466-479) 10.1080/15435070802498101
Yaniktepe et al. (2013) Investigation of wind characteristics and wind energy potential in Osmaniye, Turkey (pp. 703-711) 10.1016/j.rser.2013.01.005
Gökçek et al. (2007) Investigation of wind characteristics and wind energy potential in Kirklareli, Turkey (pp. 1739-1752) 10.1016/j.renene.2006.11.017
Lu et al. (2002) Investigation on wind power potential on Hong Kong islands: an analysis of wind power and wind turbine characteristics10.1016/S0960-1481(01)00164-1
Youm et al. (2005) Analysis of wind data and wind energy potential along the northern coast of Senegal (pp. 95-108)
Irfan et al. (2010) An evaluation of wind energy potential at KetiBankar, Pakistan (pp. 856-861) 10.1016/j.rser.2009.10.014
Shaahid et al. (2013) Economic feasibility of development of wind power plants in coastal locations in Saudi Arabia: a review (pp. 589-597) 10.1016/j.rser.2012.11.058
Durisic and Mikulovic (2012) Assessment of the wind energy resource in the South Banat region, Serbia (pp. 3014-3023) 10.1016/j.rser.2012.02.026
El Alimi et al. (2012) Modeling and investigation of the wind resource in the Gulf of Tunis, Tunisia (pp. 5466-5478) 10.1016/j.rser.2012.05.004
Maatallah et al. (2013) Wind power assessment and evaluation of electricity generation in the Gulf of Tunis, Tunisia (pp. 1-10) 10.1016/j.scs.2012.06.004
Amara et al. (2008) Energy assessment of the first wind farm section of Sidi Daoud, Tunisia (pp. 2311-2321) 10.1016/j.renene.2007.12.019
Elamouri et al. (2011) Vertical characterization of the wind mode and its effect on the wind farm profitability of Sidi Daoud–Tunisia (pp. 1539-1549) 10.1016/j.enconman.2010.10.014
Mohamed and Jamel (2012) Wind resource estimation and wind park design in El-Kef region, Tunisia (pp. 348-357) 10.1016/j.energy.2012.01.061
Colantoni et al. (2013) New insights for renewable energy hybrid photovoltaic/wind installations in Tunisia through a mathematical model (pp. 398-401) 10.1016/j.enconman.2013.06.023
Dahmouni et al. (2011) Assessment of wind energy potential and optimal electricity generation in Borj-Cedria, Tunisia (pp. 815-820) 10.1016/j.rser.2010.07.020
Kaboli (2016) An expression-driven approach for long-term electric power consumption forecasting (pp. 16-28)
Hlal (2016) NSGA-II and MOPSO based optimization for sizing of hybrid PV/wind/battery energy storage system (pp. 463-478)
Pourdaryaei et al. (2019) Short-term electricity price forecasting via hybrid backtracking search algorithm and ANFIS approach (pp. 77674-77691) 10.1109/ACCESS.2019.2922420
Kaboli and Alqallaf (2019) Solving non-convex economic load dispatch problem via artificial cooperative search algorithm10.1016/j.eswa.2019.02.002
Unknown ()
Ahmed and Hanitsch (2006) Evaluation of wind energy potential and electricity generation on the coast of Mediterranean Sea in Egypt (pp. 1183-1202) 10.1016/j.renene.2005.06.015
Soulouknga et al. (2018) Analysis of wind speed data and wind energy potential in Faya-Largeau, Chad, using Weibull distribution (pp. 1-8) 10.1016/j.renene.2018.01.002
Chellali et al. (2011) A contribution in the actualization of wind map of Algeria (pp. 993-1002) 10.1016/j.rser.2010.11.025
Kaabeche et al. (2011) Techno-economic valuation and optimization of integrated photovoltaic/wind energy conversion system (pp. 2407-2420)
Gökçek and Genc (2009) Evaluation of electricity generation and energy cost of wind energy conversion systems (WECSs) in Central Turkey (pp. 2731-2739) 10.1016/j.apenergy.2009.03.025
Akpinar and Akpinar (2005) An assessment on seasonal analysis of wind energy characteristics and wind turbine characteristics (pp. 1848-1867) 10.1016/j.enconman.2004.08.012
Mortensen et al. (2004) RisØ National Library
Jowder (2009) Wind power analysis and site matching of wind turbine generators in Kingdom of Bahrain (pp. 538-545) 10.1016/j.apenergy.2008.08.006
Lackner et al. (2010) A new method for improved hub height mean wind speed estimates using short-term hub height data (pp. 2340-2347) 10.1016/j.renene.2010.03.031
Shata and Hanitsch (2006) Evaluation of wind energy potential and electricity generation on the coast of Mediterranean Sea in Egypt 31(8) (pp. 1183-1202) 10.1016/j.renene.2005.06.015
Diaf and Notton (2013) Evaluation of electricity generation and energy cost of wind energy conversion systems in Southern Algeria (pp. 379-390) 10.1016/j.rser.2013.03.002
Gass et al. (2013) Assessing the economic wind power potential in Austria (pp. 323-330) 10.1016/j.enpol.2012.10.079