Industrial Engineering Department, Iran University of Science and Technology, Tehran, IR
Abstract
The growing demand for fuels combined with the fact that there are limited fossil fuel resources has led the world to seek renewable energy resources such as biofuels. Micro-algae can be an efficient source of biofuel energy, since it significantly reduces air pollution. In this paper, we develop a micro-algae biofuel supply chain through a two-stage approach. This study aims to commercialize micro-algae as a new source of energy. In the first stage, we utilize the Best-Worst Method (BWM) to determine the best cultivation system, and in the second stage, a bi-objective mathematical model is presented which simultaneously optimizes the economic and environmental objectives. We also propose a robust optimization model to deal with the uncertain nature of the biofuel supply chain. Our analysis on the trade-off between the supply chain’s total cost and unfulfillment demand arrives at interesting managerial insights. Furthermore, to show the effectiveness of the robust optimization model, we compare the performance of the robust and deterministic models, and the results show that the robust model dominates over the deterministic model in all scenarios. Finally, sensitivity analysis on critical parameters is conducted to help decision-makers find the optimal trade-off between investment and its benefits.
Introduction
Energy is one of the main elements of rapid economic and social growth in the world [
21
]. Nowadays, fossil fuels are accounted for the primary source of the world’s energy consumption. However, limited fossil fuel resources have made decision-makers concerned about future sources of energy. According to the World Economic Outlook (WEO) from the International Monetary Fund (IMF), the demand for fossil fuels will have increased in 2030 by 70% from 2005 [
40
]. This trend shows that in the next 50 years, resources of oil, coal, and gas will be diminished. The next problem with fossil fuels is price fluctuation. The US Energy Information Administration has reported that the price variations are a result of fossil fuel consumption, global inflation, and GDP growth [
6
]. Moreover, environmental concerns such as global warming are another problem with non-renewable sources of energy [
34
]. In 2014, approximately 78% of US global warming emissions were energy-related emissions of carbon dioxide. Excessive use of fossil fuels and increasing rates of carbon dioxide emission have encouraged researchers to find alternative energy sources, including solar energy, wind energy, and biofuels.
In contrast to biofuel energy, solar and wind energy generally face substantial practical challenges. For example, although solar electricity is carbon-free and efficient, electricity storage is a significant barrier to its widespread use, whereas another advantage of biomass fuels is their abundance [
24
]. For example, in 2012, over 500 million dry tons of forest and agricultural biomass were produced in the U.S. The benefits of using biofuels have led the European Union to announce biofuels as an essential energy source that will reduce the dependence of humans on fossil fuels.
Biofuel production technologies can be classified into three generations. In the first-generation type, edible crops such as soybeans, sugar beets, corn, and animal fats are utilized to produce biofuels [
3
]. Despite two advantages of this type being high efficiency and the ability to synthesize with petroleum-based fuels, this type competes with food production, since it consumes water and fertilizer as raw materials [
32
]. In the second-generation type, agricultural and forest waste and municipal solid waste are utilized to produce biofuel. Compared to the first type, this type has numerous advantages such as using less agricultural land [
9
]. However, due to the complex structure of lignocellulosic material, this type is not an efficient option for producing biofuel [
23
]. The third-generation type of biofuel production technology relies on the use of microalgae, which resolves all the weaknesses related to the first and second types. Due to micro-algae’s high growth rate and its carbon dioxide fixation ability, this type is the best technology for biofuel production [
22
].
Because of the advantages of using micro-algae, many scholars have studied the opportunities and challenges of biofuel production using this type of technology. One of the primary difficulties in utilizing micro-algae is its high cost for implementation. Therefore, the majority of the relevant literature focuses on the economic aspect of biofuel production supply chains. However, we believe that environmental objectives are as crucial as economic objectives, and therefore, our first contribution to the literature is developing a mathematical model which simultaneously maximizes the net benefit and minimizes the emission of greenhouse gases in biofuel supply chains. Furthermore, to address our concerns about the economic and environmental aspects of such supply chains, we consider different cultivation technologies (differentiated by their cost, efficiency, pollution, and land use) and determine the most desirable one using the Best–Worst Method (BWM). Our second contribution is addressing the uncertain nature of market demand by proposing a robust optimization model. At different stages of biofuel production, carbon dioxide, nitrogen dioxide, and methane are released, and wastewater is produced. Note that reusing the released gases and produced water not only reduces the pollution, but also decreases the total cost. Needless to say, in many cases, the high cost involved in biofuel supply chains makes it difficult for managers to implement such supply chains. Therefore, the third and main contribution of this paper is providing an outlet for managers to deal with the high costs of biofuel supply chains through reusing the material produced in the production process. The proposed mathematical model provides the opportunity to reuse the gases and wastewater released in different stages as raw materials for other stages. To our best knowledge, this article is the first mathematical paper in the literature that considers the opportunity to reuse released gases and wastewater. This feature addresses both the economic and environmental objectives in the process of biofuel production.
The remainder of this paper is organized as follows. The section “Literature” reviews the previous literature. The section “Problem statement” introduces the problem setting and assumptions. The section “Methodology” explains the solving methodology, and in the section “Model formulation”, the deterministic and robust models are proposed. In the section “Results”, the numerical results and sensitivity analysis are presented. Finally, the section “Conclusion” presents the conclusions, limitations, and directions for future research.
Literature
The optimization modeling literature on biofuel supply chains is divided into three themes. The first theme investigates biofuel production using first-generation technology, and the second theme examines producing biofuels via second-generation technology. The last theme discusses how to produce biofuels using third-generation technology, i.e., using micro-algae. In this section, we first compare three cultivation systems, which are the open-pond system, tubular photobioreactor system, and flat-plate photobioreactor system, and then, we review the three themes as mentioned in the literature.
Cultivation systems
Choosing the best cultivation system is a challenging decision which depends on a variety of factors. For example, a comparison of the open-pond and photobioreactor systems shows that each has its own advantages. For example, open-pond systems are less expensive and simpler to implement, while photobioreactor systems are more efficient and environmentally friendly [
27
]. As a result, a number of studies using multi-criteria approaches have evaluated alternative cultivation systems for the production of biofuels. The main criteria for assessing cultivation systems in the literature are expenses, environmental impact, energy efficiency, land use, and system robustness. Ubando et al. [
45
] used the analytic hierarchy process (AHP) to evaluate open-pond, flat-panel photobioreactor, and tubular photobioreactor systems, and showed that considering environmental impact, economic factors, reliability, and social acceptability, open-pond systems dominate over the two photobioreactor systems. However, by increasing the weights of energy consumption criterion, the tubular photobioreactor system was found to dominate. Jorquera et al. [
17
] calculated the net energy ration to analyze the performance of open-pond, horizontal tubular, and flat-plate photobioreactor systems, and showed that using a horizontal tubular photobioreactor system is not feasible due to its high expense. Moreover, the results demonstrated that open-pond systems dominate over the flat-plate photobioreactor system in terms of energy consumption.
First-generation technology
First-generation technology related to biofuel production involves using edible crops, and many studies have been conducted to formulate the biofuel supply chain using the first-generation technology in deterministic situations. Using a particle swarm algorithm, Izquierdo et al. [
15
] minimized the overall cost of a biomass supply chain, including the costs of biomass processing and transportation and the construction of plants. The purpose of the proposed non-linear model is determining the optimal flow from sources of raw materials to producing plants and selecting the best technologies in each stage. To investigate the application of the presented model, the authors considered a case study in Italy. Huang et al. [
14
] presented a mathematical model to minimize the total cost of a biofuel supply chain, investigating the state of California’s approach to assess the economic opportunities from bio-ethanol production. Their results showed that this model is applicable only for regions with a high volume of agricultural waste, and only when the optimal price of a gallon of ethanol being USD 1.10. Kim et al. [
19
] presented centralized and distributed optimization models to determine the optimal conversion technologies, location decisions, volume of raw materials, and transportation capacity, and characterized and analyzed the impact of parameters with the most economic effect on the optimization models. An et al. [
3
] provided a mathematical model to maximize the lignocellulosic supply chain profit considering different time stages, multiple products, production and distribution systems, and facility locations and capacities. Using a case study in Texas, they showed that the price of ethanol is the most critical factor in the lignocellulosic biomass supply chain. Considering both environmental and economic purposes, Corsano et al. [
11
] determined the optimum equipment size, amount of investment, and transportation cost, and discussed the impact of the residual cycle and derivative products from cattle feed.
Some papers have gone beyond economic objectives and considered environmental purposes, as well. In the first paper of its type, Giarola et al. [
12
] designed a biofuel supply chain using corn and stover to produce bio-ethanol, and used multi-period integer linear programming to optimize the economic and environmental performance of this supply chain. A case study in Italy was carried out to explore the applicability of the proposed model, and the results showed that the second-generation technology was more suitable in the aspect of environmental issues, but that first-generation technology was more economical, concluding that a hybrid infrastructure would answer both the economic and ecological objectives. Wang et al. [
47
] presented a bi-objective integer non-linear programming model to optimize hydrocarbon bio-refineries to make the most effectively address the both economic and environmental goals. To measure the financial goals and environmental target values, net present value and global warming were used, respectively. The results of this study indicate that more effort is needed to control and reduce greenhouse gas emissions.
Only a few papers have studied the process of biofuel production using first-generation technology in the presence of uncertainty. Chen and Fan [
9
] developed a bi-programming model to minimize the overall costs. The first-level costs included investment in and initialization of the treatment plant, while the second-level costs involved the costs for raw materials and transportation. They used a case study in California to produce bio-ethanol from waste in the presence of uncertainty. Moreover, Bairamzadeh et al. [
8
] presented a robust multi-objective mathematical optimization model for designing a lignocellulosic supply chain which optimized economic, environmental, and social performance simultaneously. The model determines the optimal strategic and tactical decisions. The strategic decisions consist of selecting biomass sources and determining the location and capacity of facilities, while the primary tactical decisions address the optimal level of stock and amount of production.
Second-generation technology
As discussed in “Introduction”, in second-generation technology, non-edible materials are used as raw material for biofuel production. Wang et al. [
48
] developed a mixed-integer optimization model to determine the optimal location of facilities and their capacities for combined heat and power (CHP) in Great Britain. They considered miscanthus (silvergrass) as a feedstock for this supply chain, and the results showed that the price of CHP had a significant impact on facility location and the cost of electricity. Babazadeh et al. [
7
] presented a hybrid approach combining data envelopment analysis (DEA) and mathematical programming techniques for biodiesel supply chain network design (BSCND) in Iran. Considering environmental and social factors, they used DEA to assess suitable areas for planting raw materials, and then, using the optimal planting locations, they proposed a mathematical model to determine the number, location, and capacity of cultivation facilities, distribution centers, and refineries. Liu et al. [
25
] proposed a bi-objective model to increase profits and minimize carbon dioxide emissions, and the results of this paper indicate that the price of electricity has an important impact on the profitability of a supply chain.
Santibañez-Aguilar et al. [
38
] considered uncertainty factors in the price of supplies and presented a new approach to improving the performance of a biofuel supply chain in uncertain conditions. Their dual-objective model seeks to optimize economic and environmental goals simultaneously. To capture the uncertainty in raw material prices, they generated various scenarios using Monte Carlo simulation, and the results showed that the total profit of a supply chain does not correlate with the cost of raw materials. Mohseni and Pishvaee [
29
] proposed a mixed-integer linear programming model to optimize the economic performance of a biodiesel supply chain, implementing data-driven robust optimization to deal with uncertain parameters.
Third-generation technology
Third-generation technology use algae and micro-algae as a raw material for biofuel production. Although it was shown in “Introduction” that this type is more efficient than the first- and second-generation technologies, only a few studies have considered using third-generation technology to produce biofuels. Ahn et al. [
2
] developed a deterministic mathematical model to determine tactical and strategic decisions such as optimal material flow and the optimal location of refineries, and showed that carbon dioxide supply has a detrimental impact on the total cost of the supply chain. Their results showed that the price of each gallon of biodiesel is about 6% higher than the current price of biodiesel, and they believed that to minimize the costs, investment must be increased. In another study, Gong and You [
13
] proposed an integer non-linear programming model to optimize economic and environmental objectives in a biodiesel supply chain.
Only a few papers have studied the biofuel supply chain in the presence of uncertainty. One of the very first studies was conducted by Ubando et al. [
44
], who considered the fuzzy trapezoidal demand of the product to deal with the uncertain nature a biofuel supply chain. Ubando et al. [
46
] developed a fuzzy mathematical model to optimize the economic and environmental objectives, comparing the performance of two cultivation systems, i.e., a raceway pond and a flat-plate photobioreactor. The results showed that the flat-plate photobioreactor outperformed the raceway pond, since it substantially improved the environmental objective. However, the main problem with the last two papers is that they were developed based on case studies, making it difficult to apply their models for other cases. Mohseni and Pishvaee [
28
] developed a two-stage model for using micro-algae in a biodiesel supply chain. In the first stage, they use the analytical hierarchy process (AHP) method to determine the optimal location of production facilities, and in the second stage, they presented a robust optimization model to minimize the total costs of the supply chain, showing that uncertainty in biomass production has a significant effect on supply chain costs. Uncertainties are the primary reasons for increased greenhouse gas emissions and financial losses. A target-oriented robust optimization approach was presented by Sy et al. [
42
], and they showed that their model was robust against variations in uncertain parameters. Their target-oriented robust model seeks to address both financial and environmental objectives simultaneously. Arabi et al. [
4
] designed a micro-algae supply chain network that minimized costs, including transportation, construction, fixed costs, and operational costs. Due to the uncertainty of some of the parameters and the complexity of solving the model, they used fuzzy programming and the DEA method.
Table 1
Reviewed mathematical models in biofuel supply chains
References
Biofuel generation
Objective function
Uncertainty
Technology
First
Second
Third
Economic
Environmental
[15]
✓
✓
✓
[14]
✓
✓
[19]
✓
✓
✓
[3]
✓
✓
[11]
✓
✓
[12]
✓
✓
✓
[47]
✓
✓
✓
✓
[9]
✓
✓
✓
[8]
✓
✓
✓
✓
[48]
✓
✓
[7]
✓
✓
[29]
✓
✓
✓
[25]
✓
✓
✓
[38]
✓
✓
✓
✓
✓
[2]
✓
✓
[4]
✓
✓
✓
[13]
✓
✓
✓
[28]
✓
✓
✓
✓
[42]
✓
✓
✓
✓
[46]
✓
✓
✓
✓
✓
This paper
✓
✓
✓
✓
✓
Table
1
summaries the preceding papers on the mathematical design of biofuel supply chains. The papers in this table are sorted based on biofuel generation, objective functions, uncertainty, and discussion of production technologies. Table
1
clearly shows the current gap in the literature. In the presence of uncertainty, there are only a few papers that have studied both the economic and environmental objective functions of micro-algae (third-generation) biofuel supply chains; however, none of these papers discusses production technologies. Therefore, in the current paper, we develop a dual-objective robust optimization model for a micro-algae biofuel supply chain, and determine the optimal production and cultivation technologies. Moreover, as discussed in this section, almost all the mathematical papers in the literature sought to find the optimal values for the economic objectives, and some of them state that biofuel energies are not financially feasible. However, none of these papers considers the opportunity of reusing released gases and water produced in different stages of a biofuel supply chain. Therefore, our paper contributes to the literature through considering this opportunity using mathematical modeling.
Problem statement
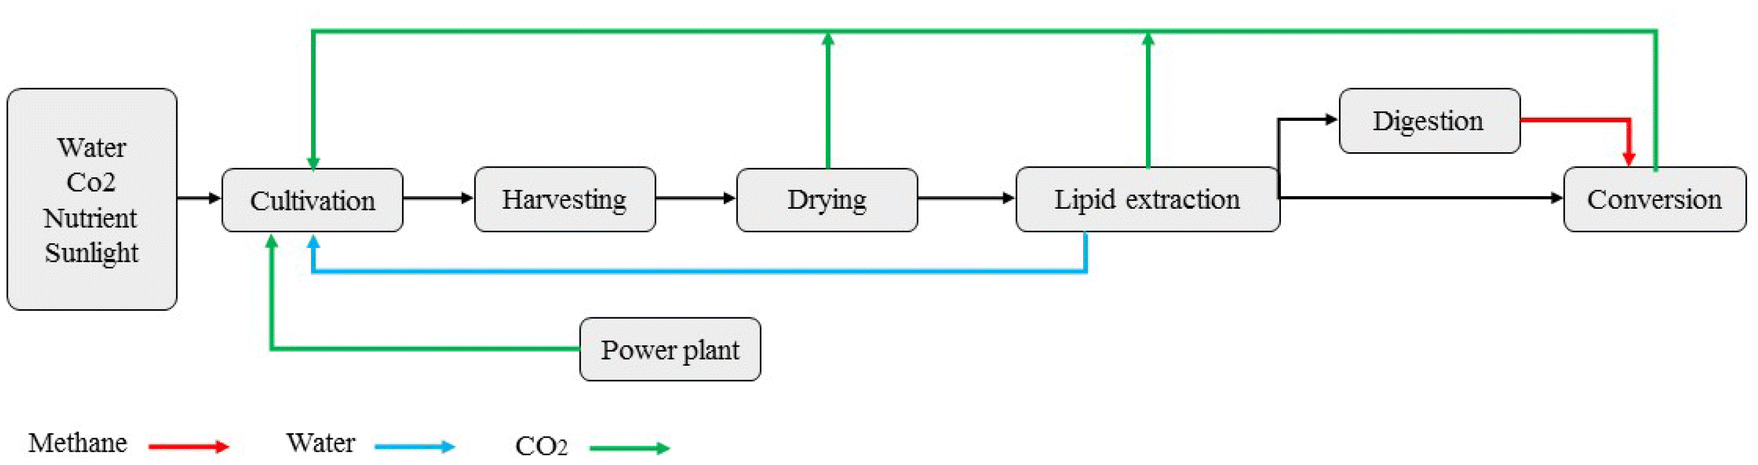
Micro-algae are microscopic algae that found in marine and fresh water systems and they can be used to produce biofuels. They need light, carbon dioxide, and nutrients for their growth and to produce lipids. In this paper, we study the biofuel supply chain, as illustrated in Fig.
1
. The production of biofuel from micro-algae consists of four main stages: (1) cultivation, (2) harvesting, (3) lipid extraction, and (4) conversion. In the following, we discuss these four stages.
Cultivation is the most important and expensive stage in the process of biofuel production. In this stage, micro-algae are cultivated using water, carbon dioxide, nutrients, and sunlight [
5
]. There are three sources which supply the required water in cultivation stage, including (1) fresh water, (2) wastewater, and (3) water recycled from the lipid extraction stage. In contrast with fresh water and wastewater, recycled water is created during the process of biofuel production and can be reused in the cultivation stage for later cycles. In this model, we assume that sources of fresh water are located close to the biofuel production facilities, so that the transportation cost of the water is negligible. On the other hand, using wastewater has two advantages, including (1) it is free, and (2) it includes nitrogen which can be used as a nutrient in the cultivation stage. Determining the sources of water is an important decision that affects the cost of biofuel production [
41
]. Another raw material is carbon dioxide, for which power plants are the main sources. By assuming that the biofuel production facilities are also located close to power plants, therefore, the transportation cost for the carbon dioxide is also negligible. In different stages of biofuel production, including drying, lipid extraction, digestion, and conversion, carbon dioxide is released addition to power plants; released carbon dioxide is another source to supply required carbon dioxide. Finally, the next raw material is nutrient fertilizer. In the process of producing biofuel from micro-algae, a lot of nitrogen is required. This fertilizer can be obtained through local markets and wastewaters [
41
].
Fig. 1
Stages of micro-algae biofuel supply chain
Harvesting is the second stage in the biofuel supply chain. In this stage, large quantities of water are removed, and the micro-algae are prepared for the next stage, which is drying. In the drying stage, the micro-algae are dried, and carbon dioxide is released. In later cycles, this carbon dioxide can be used in the cultivation stage. In the next step, lipid extraction, oils are extracted from the micro-algae. In this stage, carbon dioxide is again released, and clean water is produced. The clean water goes directly to the cultivation stage. Furthermore, in the lipid extraction stage, solid wastes are created, and in the digestion stage, the solid wastes are used to produce methane. The last step is conversion. In this stage, methane is required to produce biofuel from the extracted oil. We assume that the primary sources of methane are from local markets as well as the methane produced in the digestion stage.
As noted previously, there are three main cultivation systems, i.e., open-pond, tubular photobioreactors (closed system), and flat-plate photobioreactors (closed system). Open-pond systems are cost-effective; however, they are less efficient and produce more pollutants, while in contrast, closed systems have higher productivity, less contamination, and more reliability as advantages, but involve more investment and higher operational costs. There is no consensus on the most suitable cultivation system, because each has advantages and disadvantages and can be selected depending on the circumstances [
18
]. Therefore, in the macro-stage, using the BWM approach, we determine the optimal cultivation technology considering following the criteria: cost, efficiency, pollution, and land use.
With the increased demand for biofuel energy sources, planning biofuel supply chains is crucial. The efficient design of such a supply chain substantially reduces the total costs, which can ultimately result in expediting the implementation of biofuel supply chains in the real world. Therefore, in the micro-stage, we develop a mathematical model to optimize both the economical and environmental performance of this type of supply chain. Another important issue addressed in the micro-stage is uncertainty. Uncertainty is an inseparable part of any biofuel supply chain, and without capturing this uncertainty, mathematical models will not be reliable for real-world problems. As discussed in “Literature”, only limited studies have taken uncertainty into account, and therefore, in the micro-stage, we extend the deterministic model to a robust optimization model to provide a more stable structure for the supply chain. To show the advantage of the robust model over the deterministic model, we compare them in terms of solution robustness.
Methodology
Macro-stage
Cultivation is the main stage of concern in the process of biofuel production due to its high expenses. Therefore, identifying the best cultivation system is a crucial decision, since it can significantly reduce the supply chain’s costs. As discussed previously, the three main cultivation systems are open-pond, flat-plate photobioreactor, and tubular photobioreactor. These systems can be utilized depending on the levels of demand and implementation. To find the best cultivation system, we use a multi-criteria decision-making method called the best–worst method (BWM), introduced by Rezaei [
35
]. BWM is a procedure to solve multi-criteria decision-making problems, and compared to other multiple-criteria decision-making (MCDM) techniques, BWM requires fewer data and produces more reliable results [
36
].
In the following, we briefly describe the required to derive the weights of the criteria; (1) determining a set of criteria
{C1,C2,C3,...,Cn}
; (2) identifying the most and the least desirable criteria; (3) determining the preference of the most desirable criteria over all the other criteria using a number between 1 and 9, which results in the following vector
AB=(aB1,aB2,...,aBn)
, where
aBj
shows the preference of the most desirable criteria
B
over criterion
j
(note that
aBB=1
); (4) determining the preference of all criteria over the least desirable criteria by again using a number between 1 and 9, which results in following vector
AW=(a1W,a2W,...,anW)T
(in this vector,
ajW
indicates the preference of the criterion
j
over the worst criterion
W
. It goes without saying that
aWW=1
); (5) finding the optimal weights. For each criterion, the optimal weight is the one where we simultaneously have
wBwj=aBj
and
wjwW=ajW
. According to Rezaei [
35
], solving the following model derives the optimal weights
(w1∗,w2∗,...,wn∗)
:
MinMaxjwBwj-aBj,wjwW-ajW,∑jwj=1,wj≥0∀j.
Micro-stage
The micro-stage seeks to optimize the economic and environmental objectives of the biofuel supply chain and determines all the decisions, from raw material sourcing to distribution of the final products. Therefore, in this stage, the following decisions are made: (1) determining the flow of fresh water, waste water, nutrient fertilizer, carbon dioxide, and methane between suppliers and the production facility; (2) determining the flow of methane, carbon dioxide, and wastewater among different stages within the production facility; (3) determining the need to construct pipelines between suppliers and the production facility; (4) inventory planning; and (5) supplying micro-algae.
Uncertainty is an inseparable part of a biofuel supply chain, and one of the primary sources of uncertainty is variability in demand for the final products. Although stochastic programming is a popular approach to deal with the uncertain nature of any supply chain [
20
], it suffers from weaknesses that make it difficult for practical use in real-world problems. For instance, the probability distribution of the uncertain parameter should be available in stochastic programming; however, in most cases, determining the actual probability distribution requires a great deal amount of money and time. In contrast, scenario-based robust optimization only requires an adequate number of scenarios to model the uncertainty. Scenario-based robust optimization would result in a set of solutions that are less sensitive to realization of the model data from a scenario set [
16
]. According to our best knowledge, this paper is the first study that focuses on the application of scenario-based robust optimization for the design of biofuel supply chains.
The idea of scenario-based robust optimization was first presented by Mulvey et al. [
31
]. Their proposed model tries to consider several scenarios to arrive at the preferred level of risk aversion. This approach incorporates two sets of variables: control variables and design variables. Control variables are adjusted once a specific realization of the data is gained. However, design variables cannot be adjusted once uncertain, and random parameters are observed. Furthermore, there are two sets of constraints, i.e., structural and control constraints, of which the former are usually deterministic parameters; however, the latter involve uncertain parameters. For the purpose of explanation, the general framework of Muley’s robust optimization is described in the following.
Considering the following linear model:
Minη=cTx+dTy,Ax=b,Bx+Cy=e,x,y≥0,
where
x
and
y
represent sets of design and control variables, respectively. Moreover, Eq. (
5
) describes the structural constraints that are free of uncertainty, and Eq. (
6
) denotes the control constraints that are affected by uncertainty. Now, we define a set of scenarios as
Ω
{1, 2, 3,..., S}. The set of
Ω={Bs,Cs,es}
which is associated with coefficient in Eq. (
6
) is defined. Each
s∈Ω
is characterized with a fixed probability of
pS
, where
∑s=1Sps=1
. Next, we propose a control variable
ys
for each scenario
s∈Ω
. As a result, the objective function in Eq. (
4
) would turn into a random variable equal to
ηs=cT+dTys
with the probability
ps
for each
s∈Ω
. To allow infeasibility in the control constraints, we introduce
δs
. Therefore, the robust optimization model can be formulated as:
Min∑s∈Spsηs+λ∑s∈Spsηs-∑s′∈Sps′ηs′2+∑s∈Spsδs,Ax=b,Bsx+Csy=es∀s∈Ω,x≥0,ys≥0∀s∈Ω.
Equation (
8
) is non-linear, and Yu and Li [
50
] proposed a technique to transform Eq. (
8
) into a linear form. Thus, the robust model in (
8
)–(
11
) is reformulated as follows:
Min∑s∈Spsηs+λ∑s∈Spsηs-∑s′∈Sps′ηs′+2θs+∑s∈Spsδs,Ax=b,Bsx+Csy=es∀s∈Ω,ηs-∑s∈Spsηs+θs≥0∀s∈Ω,x≥0,ys,θs≥0∀s∈Ω.
Finally, it is worth mentioning that to solve the proposed bi-objective model, we use the LP-metric method. This method minimizes the sum of the deviations of objectives from their optimal values. In Eq. (
17
),
Wi
is the weight of each objective and
zi∗
is the optimal value of objective function
i
without considering other objective functions. To eliminate the difference in objective scale, the optimal deviation of the ideal value of objective
i
is divided into the optimal value of the objective function
i
(
zi∗
).
Assuming that inequality (
18
) shows all the constraints in the model, the comprehensive method for this type can be defined as follows:
MinZ=∑i=1nWizi∗-zizi∗,gi(x1,x2,...,xn)≤bi∀i∈I,zi=fi(x1,x2,...,xn)∀i∈I,xi≥0∀i∈I.
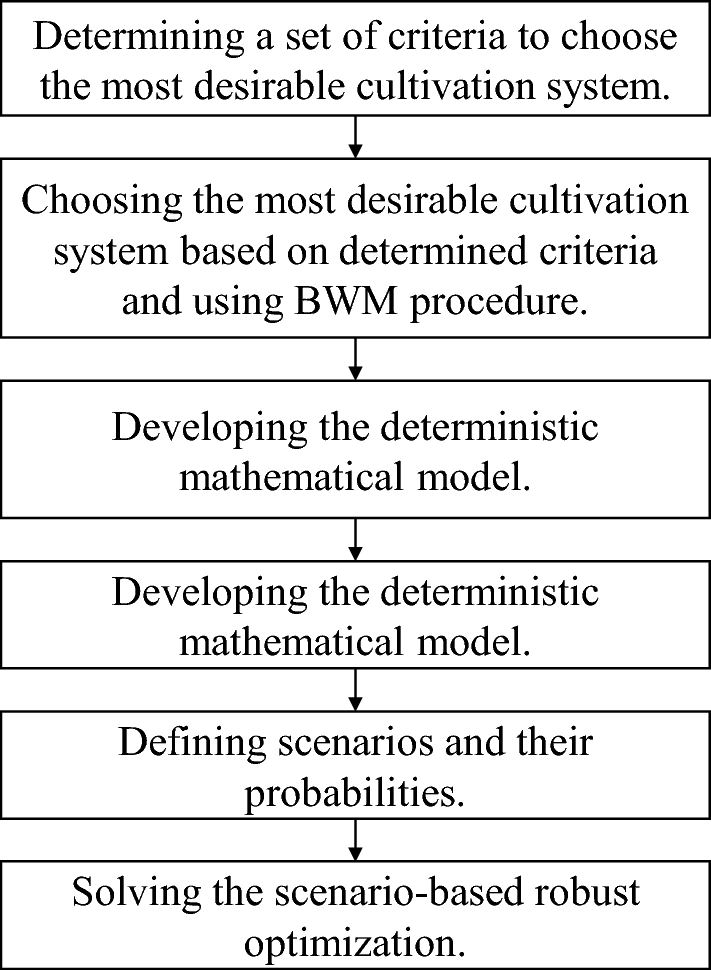
To summarize this section, we provide a schematic flowchart of the problem formulation and the corresponding solution algorithms in Fig.
2
.
Fig. 2
Schematic flowchart of the problem formulation and the corresponding solution algorithms
Model formulation
Deterministic model
Before providing the mathematical model, a verbal description of the model is presented to provide a clearer picture. The first objective function of the model maximizes the net benefit:
Maximization of the net benefit=total revenue-total costs of operation-total costs of purchasing nutrients-total costs of pipeline construction-total inventory costs.
The second objective function minimizes the emission of greenhouse gases:
Minimizes the emission of greenhouse gases=emission of carbon dioxide+emission of nitrous oxide+emission of methane.
The model seeks to optimize the above objective functions, while it satisfies the following constraints;
Subject to=resource availability constraints+demand satisfaction constraint+material flow constraints+logical constraints related to pipeline construction+inventory constraint.
Here, we propose the deterministic and robust models in mathematical language. First, we introduce the required sets, decision variables, and parameters in Tables
2
,
3
, and
4
, respectively.
Table 2
Set of indices
Index
Definition
F
Set of fresh water sources
W
Set of waste water sources
K
Set of nutrient fertilizer markets
V
Set of methane markets
P
Set of power plants
J
Set of final products
M
Set of markets
T
Set of time stages
Table 3
Decision variable
Variable
Definition
xowft
Transported fresh water from source f to cultivation stage in period t
xowwt
Transported waste water from source w to cultivation stage in period t
xwt
Transported water from lipid extraction to cultivation stage in period t
xofkt
Purchased nutrient fertilizer from market k in period t
xct
Transported carbon dioxide from drying to cultivation stage in period t
xc1t
Transported carbon dioxide from lipid extraction to cultivation stage in period t
xc2t
Transported carbon dioxide from conversion to cultivation stage in period t
xcpt
Transported carbon dioxide from power plant p to cultivation stage in period t
xmt
Transported methane from digestion to conversion stage in period t
xomvt
Transported methane from market v to cultivation stage in period t
vjt
Inventory level of product j in period t
xt
Amount of micro-algae in period t
yjmt
Quantity of final product j sent to market m in period t
lf
1 if a pipeline is constructed between source f and cultivation stage, otherwise 0
lp
1 if a pipeline is constructed between power plant p and cultivation stage, otherwise 0
lw
1 if a pipeline is constructed between source w and cultivation stage, otherwise 0
Table 4
Parameters
Parameter
Definition
oht
Unit of operational cost in harvesting stage in period t
odt
Unit of operational cost in drying stage in period t
olt
Unit of operational cost in lipid extraction stage in period t
oet
Unit of operational cost in digestion stage in period t
ovt
Unit of operational cost in conversion stage in period t
powft
Unit of fresh water purchasing cost from source f in period t
pofkt
Unit of nutrient fertilizer purchasing cost from market k in period t
pomvt
Unit of methane purchasing cost from market v in period t
Tf
Unit of pipeline construction cost between the source of fresh water f and the cultivation stage
Tw
Unit of pipeline construction cost between the source of waste water w and the cultivation stage
Tp
Unit of pipeline construction cost between power plant p and the cultivation stage
n
Nutrient required for unit of biomass
α
Water required for unit of biomass
Co2
Carbon dioxide required for unit of biomass
mj
Required methane to produce product j
ni
Amount of nutrient fertilizer obtained from unit of waste water
μj
Amount of product j produced in the conversion stage
Cft
Capacity of sources f in period t
Cwt
Capacity of sources w in period t
Cpt
Capacity of power plant p in period t
η1
Conversion rate of biomass to carbon dioxide at drying stage
η2
Conversion rate of biomass to carbon dioxide at lipid extraction stage
η3
Conversion rate of biomass to carbon dioxide at conversion stage
λ
Conversion rate of biomass to water at lipid extraction stage
θ
Achievable methane from digestion stage
β
Productivity of cultivation stage
β1
Productivity of harvesting stage
β2
Productivity of drying stage
β3
Conversion rate of lipids to oil
β4
Conversion rate of oil to final product
β5
Conversion rate of biomass to solid waste
RCO2
Released carbon dioxide
RN2O
Released Nitrogen
RCH4
Released Methane
djt
Demand for final product j in period t
hjt
Unit of inventory cost of final product j in period t
pjt
Sale price of final product j in period t
The proposed model determines the biofuel supply chain design decisions. The bi-objective mathematical model aims to maximize the economic objective function. The biofuel supply chain costs consist of the operational costs (OC), costs of purchasing nutrients (NC), costs of pipeline construction (PC), and, finally, inventory costs (IC). These cost components can be formulated as follows in Eqs. (
21
), (
22
), (
23
), and (
24
), respectively:
OC=∑t(ohtxtβ+odtxtββ1+oltxtββ1β2+oetxtββ1β2(1-β3)+ovtxtββ1β2β3),NC=∑f∑tpowft·xowft+∑v∑tpomvtxomvt+∑k∑tpofktxofkt,PC=∑flfTf+∑wlwTw+∑plpTp,IC=∑j∑thjtvjt.
Moreover, the presented model aims to minimize the greenhouse gas emissions including carbon dioxide(
CO2
), nitrous oxide (
N2O
), and methane (
CH4
). The released greenhouse gases are formulated in Eqs. (
25
), (
26
), and (
27
), respectively:
CE=∑t(xct+xc1t+xc2t+xcpt)RCo2,NE=∑k∑txofkt+ni∑w∑txowwtRN2OME=∑v∑txomvtRCH4.
Based on the aforementioned components, in this section, we formulate the bi-objective model. Equation (
28
) is the first objective function, which aims to minimize the total cost of the biofuel supply chain minus the total revenue, while Eq. (
29
) minimizes the greenhouse gas emissions:
Min Z=OC+NC+PC+IC-∑j∑t∑mpjt.yjmT,Min Q=CE+NE+ME.
Inequality (
30
) shows that the required nutrient fertilizer can be obtained from two sources, i.e., local markets and produced wastewater. Inequality (
31
) reflects that the water required for cultivation stage can be obtained from three sources, i.e., fresh water sources, wastewater sources, and water attained from the extraction stage. Inequality (
32
) ensures that the carbon dioxide required in the cultivation stage is obtained from the carbon dioxide released during drying, from lipid extraction, from conversion stages, or from power plants:
∑kxofkt+∑wnixowwt≥nxtβ∀t∈T,∑fxowft+∑wxowwt+xwt≥αβxt∀t∈T,xct+xc1t+xc2t+xcpt≥CO2βxt∀t∈T.
Inequality (
33
) guarantees that the micro-algae purchased at time
t
lead to the required final products. Inequality (
34
) ensures that each final product fulfills the demand:
μjβ4xtββ1β2β3≥∑myjmt∀j∈J,t∈T,∑myjmt≥djt∀j∈J,t∈T.
Inequality (
35
)–(
37
) restrict the carbon dioxide released during the drying, lipid extraction, and conversion stages, respectively. Note that the carbon dioxide released at each stage depends on the purchased micro-algae and the productivity of the stages:
xtββ1≥xctη1∀t∈T,xtββ1β2≥xc1tη2∀t∈T,xtββ1β2β3≥xc2tη3∀t∈T.
Inequality (
38
) ensures that in the lipid extraction stage, water is obtained (if the micro-algae are purchased). Inequality (
39
) shows the same case for methane in the digestion stage. Inequality (
40
) illustrates that the methane required for each product must be supplied from two possible sources, i.e., local markets and methane released during the digestion stage. Inequality (
41
) reflects that carbon dioxide provided from a power plant at time period
t
cannot exceed the capacity of that power plant. Similarly, inequality (
42
) shows that water from a wastewater source at time period
t
cannot exceed the capacity of that sources. Inequality (
43
) shows the same case as in inequality (
42
), but for fresh water resources:
xtββ1β2≥xwtλ∀t∈T,xtββ1β2β5≥xmtθ∀t∈T,xmt+∑vxomvt≥∑j∑mmjyjmt∀t∈T,xcpt≤Cptlp∀t∈T,xowwt≤cwtlw∀w∈W,t∈T,xowft≤cftlf∀f∈F,t∈T.
Inequality (
44
) ensures that the total amount of biofuel product
j
sent to all markets during time period
t
plus the stock at the end of time period
t
is not higher than the product
j
produced at time period
t
plus the stock at the end of time period
t-1
. Finally, Inequalities (
45
) and (
46
) enforce the non-negativity and binary restrictions on corresponding decision variables:
μjβ4xtββ1β2β3+vjt-1≥∑myjmt+vjt∀j∈J,t∈T,xowft,xowwt,xwt,xofkt,xct,xc1t,xc2t,xcpt,xmt,xomvt,vjt,xt,yjmt≥0,lp,lw,lf∈{0,1}∀f∈F,w∈W,p∈P.
Robust model
In this paper, we consider fluctuations in demand for the final products,
djts
. Table
5
summarizes the decision variables in the case of demand uncertainty.
Table 5
Decision variable
Variable
Definition
xowfts
Transported fresh water from source f to cultivation stage in period t and under scenario s
xowwts
Transported waste water from source w to cultivation stage in period t and under scenario s
xwts
Transported water from lipid extraction to cultivation stage in period t and under scenario s
xofkts
Purchased nutrient fertilizer from market k in period t and under scenario s
xcts
Transported carbon dioxide from drying stage to cultivation stage in period t and under scenario s
xc1ts
Transported carbon dioxide from lipid extraction stage to cultivation stage in period t and under scenario s
xc2ts
Transported carbon dioxide from conversion stage to cultivation stage in period t and under scenario s
xcpts
Transported carbon dioxide from power plant p to cultivation stage in period t and under scenario s
xmts
Transported methane from digestion stage to conversion stage in period t and under scenario s
xomvts
Transported methane from market v to cultivation stage in period t and under scenario s
vjts
Inventory level of product j in period t and under scenario s
xts
The amount of micro-algae in period t and under scenario s
yjmts
Quantity of final product j sent to market m in period t and under scenario s
lf
1 if a pipeline is constructed between source f and cultivation stage, otherwise 0
lp
1 if a pipeline is constructed between power plant p and cultivation stage, otherwise 0
lw
1 if a pipeline is constructed between source w and cultivation stage, otherwise 0
To make the model less complicated, we propose a new variable (
NBs
), which measures the net benefit of the supply chain for scenario s.
NBs
is defined in Eq. (
47
):
NBs=OCs+NCs+PCs+ICs-∑j∑t∑mpjt.yjmts.
According to Table
5
, we can write the deterministic model as follows. Equation (
48
) shows the first objective function of the robust model, which includes three parts. The first part is the expected value of the net benefit for all scenarios; the second part is the linear form of the standard deviation of the net benefit; and the last part shows the unmet demands for the final product in the market. Equation (
49
) is the second objective function of the robust optimization model, which aims to minimize greenhouse gas emissions:
Min Z=∑spsNBs+Γ∑spsNBs+2Θs-∑s′≠sps′NBs′+ω∑s∑j∑tpsδjts,Min Q=CEs+NEs+MEs.
Inequalities (
50
)–(
53
) are defined as the same as for inequalities (
30
)–(
33
); however, they are repeated for each scenario. Equality (
54
) shows that the demand for each product
j
equals the total produced product
j
plus the unmet demands in period
t
:
∑kxofkts+∑wnixowwts≥nxtsβ∀t∈T,s∈S,∑fxowfts+∑wxowwts+xwt≥αβxts∀t∈T,s∈S,xcts+xc1ts+xc2ts+xcpts≥CO2βxts∀t∈T,s∈S,μjβ4xtsββ1β2β3≥∑mymjts∀j∈J,t∈T,s∈S,∑mymjts+δjts≐djts∀j∈J,t∈T,s∈S.
Inequalities (
55
)–(
64
) are defined as for inequalities (
35
)–(
44
); however, they are repeated for each scenario:
xtsββ1≥xctsη1∀t∈T,s∈S,xtsββ1β2≥xc1tsη2∀t∈T,s∈S,xtsββ1β2β3≥xc2tsη3∀t∈T,s∈S,xtsββ1β2≥xwtsγ∀t∈T,s∈S,xtsββ1β2β5≥xmtsθ∀t∈T,s∈S,xmts+∑vxomvts≥∑j∑mmjymjts∀t∈T,s∈S,xcpts≤Cptlp∀t∈T,s∈S,xowwts≤cwtlw∀w∈W,t∈T,s∈S,xowfts≤cftlf∀f∈F,t∈T,s∈S,μjβ4xtsββ1β2β3+vjt-1s≥∑mymjts+vjts∀j∈J,t∈T,s∈S.
Constraint (
65
) converts the non-linear robust model to a linear robust model [
31
]. Finally, inequalities (
66
)–(
69
) enforce the non-negativity and binary restrictions on the corresponding decision variables:
NBs+Θs-∑s′≠sps′NBs′≥0∀s∈S,xowfts,xowwts,xwts,xmts≥0∀s∈S,t∈T,f∈F,w∈W,xofkts,xcts,xc1ts,xc2ts,xcpts,≥0∀s∈S,t∈T,k∈K,p∈P,xomvts,vjts,xts,yjmts≥0∀s∈S,t∈T,v∈V,j∈J,m∈M,lp,lw,lf∈{0,1}∀f∈F,w∈W,p∈P.
Results
In this section, the results of the macro- and micro-stages are presented. The model was coded in GAMS r40979 (version 24.1.2) software and solved by the commercial solver CPLEX on a personal computer equipped.
Parameters
The proposed model presents tactical planning for a biofuel supply chain on a commercial scale. We consider five periods to deal with the dynamic nature of a biofuel supply chain. Furthermore, we consider three markets (
m∈{1,2,3}
) that are potential targets for the two final products: biodiesel (
j=1
) and glycerin (
j=2
). Table
6
shows the demand for biodiesel and glycerin in each market and for each period. Table
7
shows the operational costs at each stage and time period. Moreover, Table
8
shows the values of key parameters found in the literature.
Biodiesel accounts for 90% of biofuel production (
μ1=0.9
), with the remainder being glycerin (
μ2=0.1
) [
37
]. We assume that there are two sources of wastewater, two sources of fresh water, and two sources of nutrient fertilizer. We also presume that the purchasing expenses for wastewater, fresh water, and nutrient fertilizer from all sources are the same and that they cost $0.04 per kilogram, $0.06 per kilogram, and $0.5 per kilogram, respectively [
41
].
Table 6
Demand for biodiesel (million liters) and glycerin (million tons) for each market and for each time period
Final Product
Market
Period 1
Period 2
Period 3
Period 4
Period 5
Biodiesel
m=1
0.3
1.1
2.3
3
3.2
m=2
0.9
2.0
3.1
3
4.2
m=3
0.8
0.9
1.6
4
4.6
Glycerin
m=1
0.08
0.05
0.25
0.39
0.21
m=2
0.04
0.15
0.27
0.44
0.69
m=3
0.06
0.2
0.18
0.17
0.3
Table 7
Operational cost for different stages and time periods (dollar/ton dry biomass)
Stages
Period 1
Period 2
Period 3
Period 4
Period 5
Harvesting
$31.2
$34.3
$37.8
$41.5
$45.7
Drying
$139.1
$153
$168.3
$185.1
$203.6
Lipid extraction
$42.2
$46.4
$51
$56.1
$61.7
Digestion
$14.5
$15.9
$17.5
$19.2
$21
Conversion
$17.2
$19
$20.8
$23
$25.3
Table 8
Value of key parameters
Parameter
Value
Reference
CO2
1.83 ton/ton biomass
[10]
n
0.08 ton/ton biomass
[28]
α
150 m3/ton biomass
[49]
β3
70%
[1]
β1
15%
[41]
β4
95%
[39]
RCO2
25%
[41]
ni
0.005 ton/m3
[33]
Macro-stage
To determine the best cultivation technology, we propose three alternatives, which are “Open Pond”, “Flat-Plate Photobioreactor”, and “Tubular Photobioreactor”. Moreover, we define four criteria, i.e., cost, efficiency, pollution, and land use (shown in Table
9
). By referring to the literature, we produced Table
9
. Using the proposed BWM model by Rezaei [
35
] and solving the model, we find the best cultivation technology. The results in Table
10
show that “Open Pond” is the best cultivation technology.
Table 9
Three alternatives and four criteria for choosing the best cultivation technology
Cost
Efficiency (%)
Pollution (%)
Land use
Open pond
415
11
33
301
Flat-plate photobioreactor
596
27
15
50
Tubular photobioreactor
495
25
23
14.6
Table 10
Final score of cultivation technology system using BWM
Open pond
Flat-plate photobioreactor
Tubular photobioreactor
Total score
253
303.9
276.19
Micro-stage
In this section, we evaluate the effectiveness of the robust model, with that of the deterministic model, and considering 100 scenarios and the parameters in “Parameters”, we solve the scenario-based robust optimization model.
As shown in Table
11
, the carbon dioxide released in the drying, lipid extraction, and conversion stages plays an important role in providing the cultivation stage with the carbon dioxide required. A simple calculation proves that around 30% of the carbon dioxide required in the cultivation stage is supplied from carbon dioxide released in the drying, lipid extraction, and conversion stages.
Table 11
Sources of carbon dioxide required in cultivation stage for each time period
Sources
Period 1
Period 2
Period 3
Period 4
Period 5
Power plant
540.2
607.1
486.8
634.4
675.8
Drying
186.8
175.6
172.1
215.2
191.3
Lipid extraction
12.1
22
19.8
29.1
22.3
Conversion
8.8
11.7
9.6
8.7
10.6
Table
12
illustrates that the fifth period is the only period for which we are required to buy nutrients from local markets. For the other periods, we can obtain the required nutrient fertilizers from the wastewater, which would decrease the economic objective function. Moreover, Table
13
proves that the supply chain is independent of the local market in supplying the required methane, because we can obtain the methane from the digestion stage. Obviously, being independent of local markets and obtaining the required methane and nutrients from different stages in the supply chain significantly reduce the supply chain’s costs.
Table 12
Sources of required nutrients in cultivation stage for each time period
Sources
Period 1
Period 2
Period 3
Period 4
Period 5
Market-first source
0
0
0
0
25.3
Market-second source
0
0
0
0
0
Waste water-first source
299.5
131.5
125.2
252.5
270.1
Table 13
Sources of required methane in conversion stage for each time period
Sources
Period 1
Period 2
Period 3
Period 4
Period 5
Market-first source
0
0
0
0
0
Digestion
0.21
0.41
0.35
0.46
0.49
In Eq. (
48
),
ω
is the risk-aversion weight for under-fulfillment of the biofuel supply chain’s final products.
ω
seeks to find a trade-off between the solution robustness (which is close to an optimal solution) and the model robustness (which is close to a feasible solution). It is clear that a decision-maker who prefers higher values for
ω
is risk-averse and wishes to avoid a shortage of final biofuel products. However, a risk-taking decision-maker chooses smaller values for
ω
. Therefore, we can find a trade-off between cost and demand fulfillment by changing the value of the risk-aversion weight. The results of our analysis show that with increase in the value of the risk-aversion weight (
ω
), the cost of the biofuel supply chain (which indicates solution robustness) increases, while under-fulfillment of the biofuel supply chain’s final products (which indicates model robustness) decreases. This behavior conveys that at larger risk-aversion weight values, there is a tendency toward an almost feasible solution in all 100 scenarios, at the expense of an increase in total cost. Note that the impacts of the risk-aversion weight on solution robustness and model robustness are consistent with the results provided by Mulvey and Ruszczyński [
30
].
This analysis helps us to determine a proper value for
ω
. Final-product demand under-fulfillment is entirely avoided by choosing a large value for
ω
. For instance, under any scenario, at
ω=20
, the biofuel supply chain ensures zero final-product demand under-fulfillment at an expense of 255 million dollars. On the other hand, a smaller value for
ω
results in a total cost reduction while guaranteeing zero final-product demand under-fulfillment for most of the scenarios. For instance, at
ω=15
, the total cost equal 243 million dollars, while the supply chain is robust in 96 out of 100 scenarios. For the rest of the analysis in this paper, we assume that
ω=15
. However, depending on decision-makers’ purposes and other possible conditions,
ω
can have other values.
Now, we compare the performance of the robust model with that of the deterministic model and discuss their effectiveness. To compare the effectiveness of the deterministic model, we use the expected value approach (EVA) introduced by Maggioni and Wallace [
26
]. In the EVA, a single scenario is developed in which the values of the random parameters (demand for final products) are set as equal to their expected value. The robust optimization approach (ROA) takes all scenarios into account when determining the optimal decision variables, while the EVA utilizes the expected values of uncertain parameter to determine the optimal values of decision variables. We now compare the effectiveness of the ROA and EVA over a range of risk-aversion weights.
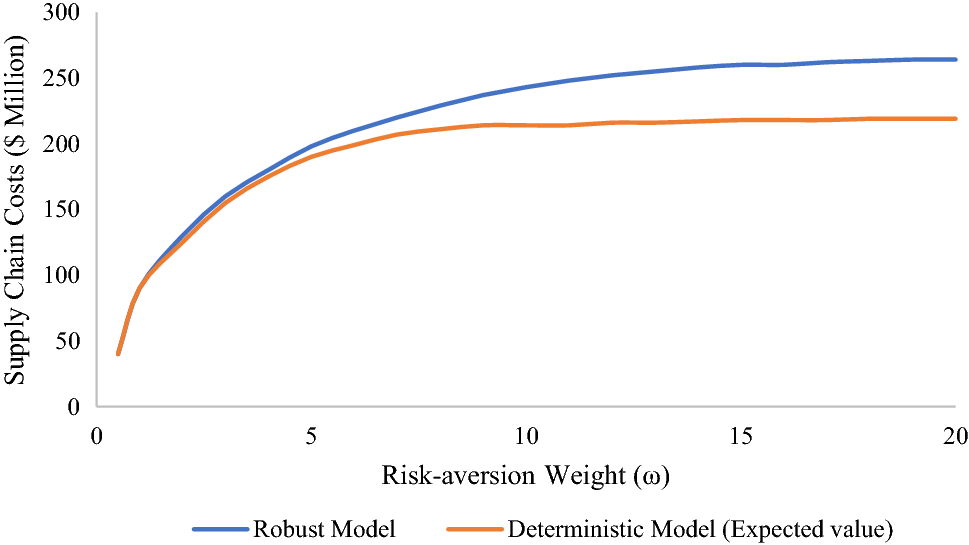
Fig. 3
Cost performance of the proposed robust model versus the expected value approach over a range of risk-aversion weights
Considering 100 scenarios, Fig.
3
shows that by increasing the risk-aversion weight parameter (
ω
), in both the deterministic and robust cases, the total costs increase. More importantly, Fig.
3
demonstrates that the robust optimization approach is considerably better than the expected value approach. To shed light on this, almost in all problems, the robust optimization approach dominates the deterministic model with respect to the mean of the cost in the economic objective function. The intriguing aspect is that the supremacy of the robust model is improved as the risk-aversion weight (
ω
) increases. This means that in the presence of a high level of uncertainty (e.g., due to lack of historical data) or when managers are risk-averse, the robust model matches better with the biofuel supply chain. The reason the robust model performs better is that the deterministic model assigns the same probability to all 100 scenarios, while the robust model devotes a lower probability to outlier scenarios.
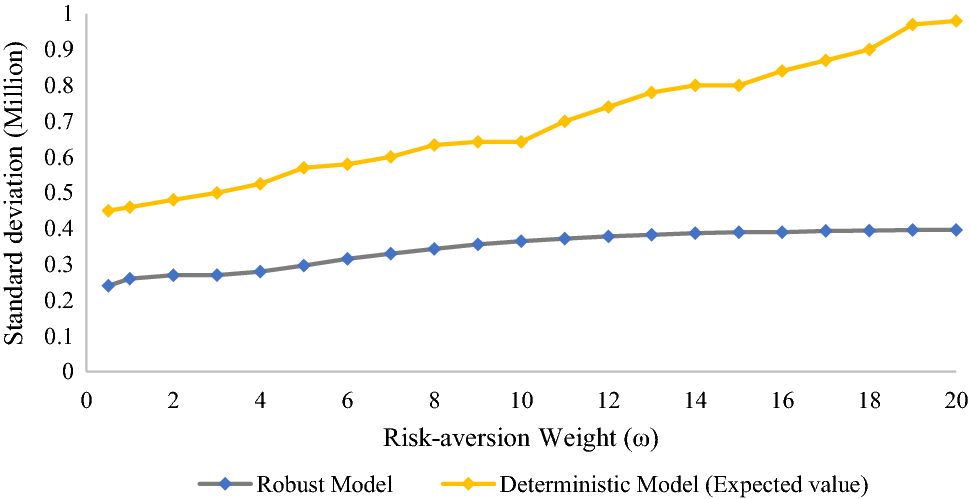
Another measure to evaluate the performance of the robust model versus the deterministic one is using the standard deviation of the optimum total costs under random realization. We vary the risk-aversion weight parameter and calculate the standard deviation for the robust and deterministic models. Considering 100 scenarios, the results show that the robust model gains a lower standard deviation than the deterministic model. Figure
4
illustrates that the robust model dominates over the deterministic model with respect to the standard deviation of the economic objective function. Mohseni and Pishvaee [
28
] conducted the same analysis to evaluate the performance of the robust model, and according to their study, the standard deviations of our robust model (provided in Fig.
4
) are acceptable.
Fig. 4
Standard deviation performance of the proposed robust model versus the expected value approach over a range of risk-aversion weights
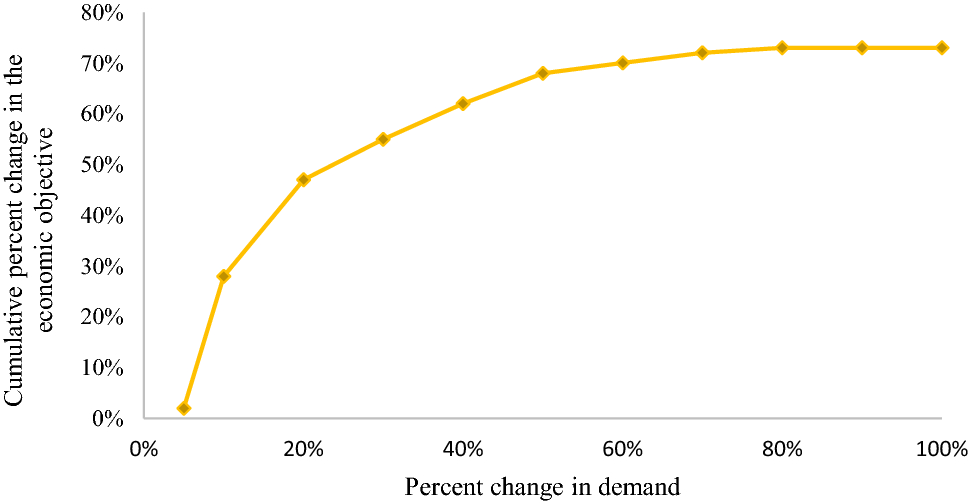
Sensitivity analysis
In this section, sensitivity analysis is carried out to evaluate the impact of the critical parameters on the results. The first key parameter is the demand for the final products. In other words, we are interested in finding the impact of change in demand on change in the economic objective function (net benefit). By increasing the demand, the economic objective function increases; however, this increase happens at a decreasing rate, which implies that the objective function is concave. This concavity is a result of the fact that at some point, demand is not a barrier to higher profits. In fact, it is lack of resources, such as limited pipeline capacity, that limits the benefit. Figure
5
demonstrates the cumulative percent change in the economic objective function over a range of variation in demand for final products. For instance, a 15% increase in demand for biodiesel and glycerin would result in an almost a 30% increase in the economic objective function.
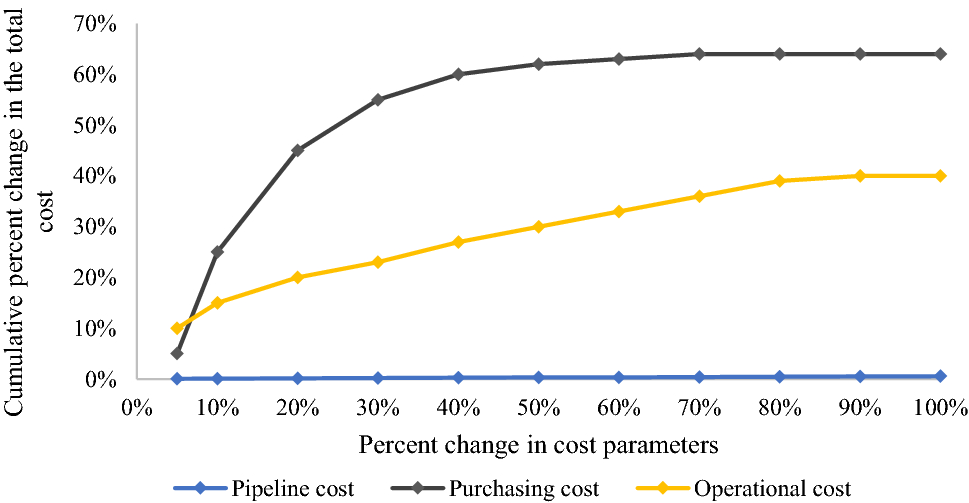
The next set of critical parameters are the cost parameters, including operational costs, capital costs for pipeline construction, and costs of purchasing raw materials. Figure
6
shows the impact of percent change in cost parameters on the cumulative percent change in the total costs. Since the capital costs of pipeline construction are a one-time expenses, even a significant variation in those costs does not lead to a substantial impact on the supply chain’s total costs. For example, a 100% increase in the capital costs of pipeline construction results in only a 1% increase in the total costs. In contrast, operational costs and the purchasing costs of raw material are recurring expenses. Therefore, we cab expect a significant increase in the supply chain’s total costs as a result of increases in recurring expenses.
Fig. 5
Percent change in the economic objective function as percent of change in demand varies
Fig. 6
Percent change in the economic objective function as percent of change in demand varies
Conclusion
The model proposed in this paper formulates a microalgae biofuel supply chain while taking strategic and tactical decisions into account over multiple periods of time. Since the cultivation stage is one of the most expensive stages in biofuel production, we determined the most desirable cultivation systems. First, we defined four criteria (cost, efficiency, pollution, and land use) for each potential cultivation system and then applied the BWM technique to choose the best system. Moreover, we introduced a dual-objective mathematical model which aims to simultaneously maximize the net benefit of the biofuel supply chain and minimizes greenhouse gas emissions. In most cases, the primary problem with biofuel production is its high implementation cost (for instance, cost of material supplement). Therefore, to reduce the material supplement costs, we proposed alternative sources of raw materials. As an example, to supply the water required, in addition to purchasing water from the market, we considered another alternative of reusing the water produced in the lipid extraction stage. Furthermore, we investigated the economic impact of reusing this source of water in the cultivation stage.
Uncertainty in demand is an integral part of any supply chain, and so to deal with the uncertain nature of a biofuel supply chain, we proposed scenario-based robust optimization. According to our best knowledge, this study is the first paper in the literature to formulate a biofuel supply chain using scenario-based robust optimization. The results show that the robust model dominates over the deterministic model (the expected value approach) with respect to the total cost and its standard deviation. Also, to analyze the impact of critical parameters of the proposed model, we implemented sensitivity analysis, and the results suggest that an increase in demand leads to a decreasing rate of revenue increase. The other set of key parameters that were investigated in the sensitivity analysis are cost parameters, and the results prove that among those parameters, purchasing cost has the highest impact on the total costs and the pipeline cost has the lowest.
Despite its contributions, our study is not without limitations. First, we utilized the BWM approach to determine the best cultivation system. There are studies, such as Tan et al. [
43
], that have focused on evaluating the best systems for all stages of a biofuel supply chain; however, since we did not have access to information related to other stages, we could only apply the BWM technique to the cultivation stage. Second, in this study, we took into account the economical and environmental performances of the proposed biofuel supply chain. Considering other objective functions such as social performance results in a robust multi-objective model. Finally, in this paper, we assume that the location of a hypothetical facility is pre-determined, and another research direction would be to employ different approaches to determine the best location for the facility.
Publisher's Note
Springer Nature remains neutral with regard to jurisdictional claims in published maps and institutional affiliations.
References
Ahmad et al. (2011) Microalgae as a sustainable energy source for biodiesel production: a review 15(1) (pp. 584-593)
Ahn et al. (2015) Strategic planning design of microalgae biomass-to-biodiesel supply chain network: multi-period deterministic model (pp. 528-542)
An et al. (2011) A mathematical model to design a lignocellulosic biofuel supply chain system with a case study based on a region in central texas 102(17) (pp. 7860-7870)
Arabi et al. (2019) A mathematical model for microalgae-based biobutanol supply chain network design under harvesting and drying uncertainties (pp. 1004-1016)
Arenas et al. (2017) Microalgae as a potential source for biodiesel production: techniques, methods, and other challenges 41(6) (pp. 761-789)
Asadi et al. (2018) A bi-objective stochastic location-inventory-routing model for microalgae-based biofuel supply chain (pp. 2235-2261)
Babazadeh et al. (2017) An integrated data envelopment analysis-mathematical programming approach to strategic biodiesel supply chain network design problem (pp. 694-707)
Bairamzadeh et al. (2015) Multiobjective robust possibilistic programming approach to sustainable bioethanol supply chain design under multiple uncertainties 55(1) (pp. 237-256)
Chen and Fan (2012) Bioethanol supply chain system planning under supply and demand uncertainties 48(1) (pp. 150-164)
Chisti (2007) Biodiesel from microalgae 25(3) (pp. 294-306)
Corsano et al. (2011) Optimal design for sustainable bioethanol supply chain considering detailed plant performance model 35(8) (pp. 1384-1398)
Giarola et al. (2011) Spatially explicit multi-objective optimisation for design and planning of hybrid first and second generation biorefineries 35(9) (pp. 1782-1797)
Gong and You (2014) Global optimization for sustainable design and synthesis of algae processing network for co2 mitigation and biofuel production using life cycle optimization 60(9) (pp. 3195-3210)
Huang et al. (2010) Multistage optimization of the supply chains of biofuels 46(6) (pp. 820-830)
Unknown ()
Jabbarzadeh et al. (2014) Dynamic supply chain network design for the supply of blood in disasters: a robust model with real world application (pp. 225-244)
Jorquera et al. (2010) Comparative energy life-cycle analyses of microalgal biomass production in open ponds and photobioreactors 101(4) (pp. 1406-1413)
Khoo et al. (2011) Life cycle energy and co2 analysis of microalgae-to-biodiesel: preliminary results and comparisons 102(10) (pp. 5800-5807)
Kim et al. (2010) Simultaneous design and operation decisions for biorefmery supply chain networks: centralized vs. distributed system 43(5) (pp. 73-78)
Klibi et al. (2010) The design of robust value-creating supply chain networks: a critical review 203(2) (pp. 283-293)
Komala and Prasad (2014) Utilization pattern of biomass energy and socioeconomic dimensions associated with yelandur, karnataka, india 5(2–3)
Unknown ()
Lee and Lavoie (2013) From first-to third-generation biofuels: challenges of producing a commodity from a biomass of increasing complexity 3(2) (pp. 6-11)
Liao et al. (2016) Fuelling the future: microbial engineering for the production of sustainable biofuels 14(5)
Liu et al. (2017) Supply chain optimization of forest biomass electricity and bioethanol coproduction (pp. 630-645)
Maggioni and Wallace (2012) Analyzing the quality of the expected value solution in stochastic programming 200(1) (pp. 37-54)
Mata et al. (2010) Microalgae for biodiesel production and other applications: a review 14(1) (pp. 217-232)
Mohseni and Pishvaee (2016) A robust programming approach towards design and optimization of microalgae-based biofuel supply chain (pp. 58-71)
Mohseni and Pishvaee (2019) Data-driven robust optimization for wastewater sludge-to-biodiesel supply chain design10.1016/j.cie.2019.07.001
Mulvey and Ruszczyński (1995) A new scenario decomposition method for large-scale stochastic optimization 43(3) (pp. 477-490)
Mulvey et al. (1995) Robust optimization of large-scale systems 43(2) (pp. 264-281)
Naik et al. (2010) Production of first and second generation biofuels: a comprehensive review 14(2) (pp. 578-597)
Unknown ()
Qazi (2014) Thermophilic fermentations of lignocellulosic substrates and economics of biofuels: prospects in pakistan 5(2–3)
Rezaei et al. (2016) A supplier selection life cycle approach integrating traditional and environmental criteria using the best worst method (pp. 577-588)
Rodrigues et al. (2017) Upgrading the glycerol from biodiesel production as a source of energy carriers and chemicals–a technological review for three chemical pathways 10(11)
Santibañez-Aguilar et al. (2016) Stochastic design of biorefinery supply chains considering economic and environmental objectives (pp. 224-245)
Seo et al. (2016) Lipid extraction from microalgae cell using persulfate-based oxidation (pp. 1073-1075)
Shafiee and Topal (2009) When will fossil fuel reserves be diminished? 37(1) (pp. 181-189)
Slade and Bauen (2013) Micro-algae cultivation for biofuels: cost, energy balance, environmental impacts and future prospects (pp. 29-38)
Sy et al. (2018) Multi-objective target oriented robust optimization for the design of an integrated biorefinery (pp. 496-509)
Tan et al. (2015) Fuzzy analytical hierarchy process (ahp) for multi-criteria selection in drying and harvesting process of microalgae system (pp. 829-834)
Unknown ()
Ubando et al. (2016) Application of stochastic analytic hierarchy process for evaluating algal cultivation systems for sustainable biofuel production 18(5) (pp. 1281-1294)
Unknown ()
Wang et al. (2013) Sustainable design and synthesis of hydrocarbon biorefinery via gasification pathway: integrated life cycle assessment and technoeconomic analysis with multiobjective superstructure optimization (pp. 55-76)
Wang et al. (2012) An optimization model for energy crop supply 4(1) (pp. 88-95)
Yang et al. (2011) Life-cycle analysis on biodiesel production from microalgae: water footprint and nutrients balance 102(1) (pp. 159-165)
Yu and Li (2000) A robust optimization model for stochastic logistic problems 64(1–3) (pp. 385-397)